
Archive for February 2018
2018 OOI Data Workshops – Apply Now

The OOI is hosting several workshops for early-career scientists (PhD candidates, postdocs and pre-tenure faculty up to 7 years post-PhD) interested in learning more about the OOI and how to use data from the program in their work.
Read MoreHypoxic Conditions Over the Oregon Shelf Respond to Wind Forcing on Time Scales of Days

From Barth et al., 9 February 2018
In recent years, hypoxic and even anoxic events have regularly occurred off Washington and Oregon as they have in upwelling regions worldwide [1, 2]. The OOI Endurance Array’s location, platforms and sensors were designed to address major OOI Science Themes with a particular focus on Hypoxia on Continental Shelves and Shelf/Slope Exchange [3]. Since its first full deployment in April 2015, the Endurance Array has maintained oxygen sensors at 6 fixed locations near the surface and near the bottom over the Washington and Oregon shelf and slope. Similar oxygen sensors are found on Endurance Array profilers and gliders and across other OOI arrays.
OOI marine operators, systems engineers and data team members have worked together to continually improve the quality of the OOI dissolved oxygen data products. We have worked with the vendor to improve their calibration of sensors; have compared data to physical samples [4]; and have implemented a UV-based biofouling mitigation [5].
Science Highlight: OOI Endurance Array data [6] describe low-oxygen events off central Oregon. Data from July 2017 illustrate variability on time scales of days as the wind-driven upwelling circulation advects low oxygen waters back and forth across the shelf. (Figure 1).
During this time, near-bottom oxygen levels at the OOI Oregon Inshore Surface mooring were often below the hypoxia threshold. When winds blow to the south, the near-bottom temperature decreases due to coastal upwelling, with a slight lag relative to the wind. During these events, near-bottom oxygen usually decreases (e.g., 23-25 July). Conversely, during low or northward winds the near-bottom temperature and oxygen increase rapidly. These changes are consistent with the upwelling circulation drawing near-bottom cold water low in dissolved oxygen toward the coast during upwelling and pushing warm water containing more oxygen down and away from the coast near the bottom during downwelling. The dissolved oxygen does not follow the winds or temperature as clearly as temperature follows the wind because there are the additional biological processes of photosynthesis and microbial decay that raise or lower dissolved oxygen levels, respectively.
Since this report [6], researchers continue to use OOI data to characterize hypoxia in summer 2018. There is also increasing interest in, and use of, OOI data by mission-oriented agencies such as the Oregon Department of Fish and Wildlife.
[blockquote][1] Grantham, B. A., Chan, F., Nielsen, K.J., Fox, D.S., Barth, J.A., Huyer, A., Lubchenco, A., Menge, B.A. (2004). Upwelling-driven nearshore hypoxia signals ecosystem and oceanographic changes in the northeast Pacific. Nature, 429, 749-754. DOI: 10.1038/nature02605.
[2] Chan, F., Barth, J.A., Lubchenco, J., Kirincich, A., Weeks, H., Peterson, W.T., Menge, B.A. (2008). Novel emergence of anoxia in the California Current System. Science, 319, 920, DOI: 10.1126/science.1149016
[3] ORION Executive Steering Committee (2007). Ocean Observatories Initiative Scientific Objectives and Network Design: A Closer Look. Joint Oceanographic Institutions, Inc. Washington, DC.
[4] Holm, C., R.T. Rohrer, E.P. Dever, and J.P. Fram (2018) Quality Assessment of Moored Near Surface Instrument Time Series on the OOI Endurance Array, Abstract IS14A-2541 presented at 2018 Ocean Sciences Meeting, Portland, OR, 12-16 Feb.
[5] Wingard, C.E., R.A. Desiderio, J.P. Fram, and E.P. Dever (2018) Time Series Measurements of Inherent and Apparent Optical Properties from the OOI Endurance Array, Abstract IS14A-2543 presented at 2018 Ocean Sciences Meeting, Portland, OR, 12-16 Feb.
[6] Barth, J. A., J. Fram, E. P. Dever, C. Risien, C. Wingard, R. W. Collier, and T. D. Kearney, 2018. Warm blobs, low-oxygen events and an eclipse: The Ocean Observatories Initiative Endurance Array captures them all, Oceanography 31(1): 90-97, https://doi.org/10.5670/oceanog.2018.114.
[/blockquote] Read More
Glider Observations Provide Insight into Spatial Patterns in Satellite Bio-Optical Measurements
From Henderikx et al., 9 February 2018
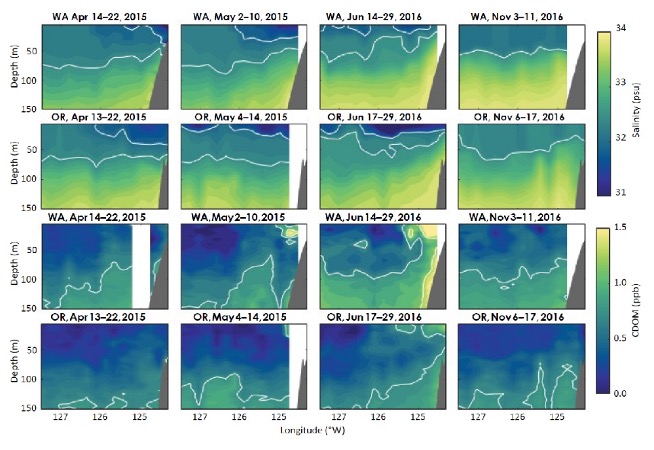
Hendrikx Freitas et al., 2018 compare satellite and Endurance Array glider estimates of chromophoric dissolved organic matter (CDOM) to characterize seasonal patterns and latitudinal and cross-shore gradients in particle concentrations between the Washington and Oregon shelves. While the Oregon and Washington shelves are both highly productive regions of the northern California Current Ecosystem, there are significant differences in the physical processes, with the central Washington shelf generally subject to weaker upwelling and a stronger Columbia River influence. The difference in physical forcing is reflected in satellite estimates of chlorophyll, which show higher concentrations off the Washington coast.
The conclusions from satellites contrast with in situ observations from gliders. Despite the differences in physical forcing, Henderikx et al., 2018 find OOI glider fluorescence based measurements of chlorophyll to be similar in magnitude across the Oregon and Washington shelves. Their research suggests that latitudinal differences in CDOM may be a partial explanation for perceived trends in satellite-derived chlorophyll. The OOI gliders gather simultaneous chlorophyll and CDOM fluorescence from an integrated three-channel sensor. While the glider observations indicate similar levels of chlorophyll fluorescence, they also show an increased presence of suspended sediments and CDOM off WA. The OOI observations, although temporally limited, indicate potential contamination of satellite retrievals of chlorophyll due to CDOM and suspended materials in the water column, particularly off the WA shelf, that should caution further attribution of satellite chlorophyll signals to differences in production.
Read More