
Posts by Amber Coogan
A Decade of Air-Sea pCO2 Observations from OOI’s Coastal Endurance Array
OOI has released a newly refined, quality-controlled dataset documenting ten years of air-sea pCO2 measurements from the Coastal Endurance Array off Oregon and Washington. Tracking coastal ocean acidification has been a goal for the array since operations began in 2015, and these long-term moored records now provide one of the most comprehensive views of air and surface seawater pCO2 and supporting environmental variables available in the Pacific Northwest.
This release includes measurements collected at four mooring sites, two off central Washington and two off central Oregon, positioned across the mid-shelf and continental slope to capture both along-shelf and cross-shelf variability. These time series highlight the dominant influence of seasonal and event-scale upwelling, which can elevate near-surface pCO2 to more than three times atmospheric levels and depress surface pH toward the aragonite saturation threshold. The record spans several notable marine heatwaves, offering insight into how warming anomalies interact with upwelling to shape coastal carbonate chemistry.
To build this dataset, OOI conducted extensive post-processing and human-in-the-loop quality control. This work involved correcting subtle sensor drifts and offsets, restoring usable data that had been removed for fixable issues, and checking the measurements against historical records, bottle samples, collocated instruments, and engineering diagnostics. All measurements were then merged onto an hourly time base to create a consistent, analysis-ready product suitable for research, modeling, and education.
In addition to pCO2, the dataset includes sea surface temperature, salinity, wind speed, and several derived carbonate system variables, such as estimated total alkalinity, and air–sea CO2 fluxes. These enhancements make it possible to explore marine carbonate system parameters without additional processing and allow users to evaluate physical drivers of variability.
The data are available in both NetCDF and Zarr formats for each mooring site, with updated metadata and documentation. In the near future, we plan to expand on this dataset to include inshore pCO2, near surface pH, and subsurface measurements.
For access to this dataset and all OOI community data products, visit the OOI collection in Zenodo.
[caption id="attachment_37284" align="alignnone" width="935"]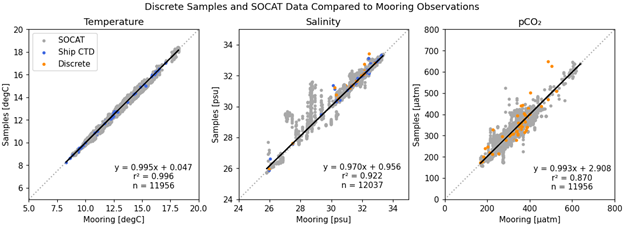 Figure 1. Cross-comparing the mooring observations against the discrete samples and SOCAT v2025 dataset.[/caption]
_
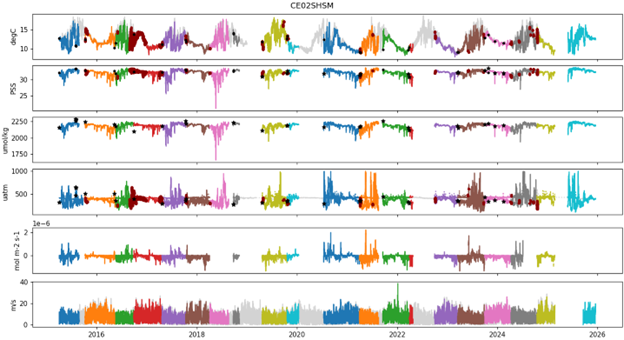
[caption id="attachment_37286" align="alignnone" width="624"] Figure 2. Time series of observations at the Oregon Shelf Surface Mooring (CE02SHSM) of sea surface temperature, salinity, estimated total alkalinity, air and surface pCO2, ocean to atmosphere CO2 flux, and 10 m, normalized wind speed. Black dots and stars are discrete samples collected during mooring maintenance cruises. Dark red dots are from the SOCAT v2025 dataset. Light grey lines in the surface temperature and wind speed records are from the NDBC Stonewall Bank (46050) Mooring.[/caption]
_______________________________
References:
Bakker, Dorothee C. E.; Alin, Simone R.; Aramaki, Takafumi; Barbero, Leticia; Bates, Nicholas; Gkritzalis, Thanos; Jones, Steve D.; Kozyr, Alex; Lauvset, Siv K.; Macovei, Vlad A.; Metzl, Nicolas; Munro, David R.; Nakaoka, Shin-ichiro; O’Brien, Kevin M.; Olsen, Are; Pierrot, Denis; Steinhoff, Tobias; Sullivan, Kevin F.; Sutton, Adrienne J.; Sweeney, Colm; Wada, Chisato; Wanninkhof, Rik; Akl, John; Arbilla, Lisandro A.; Azetsu-Scott, Kumiko; Battisti, Roman; Beatty, Cory M.; Becker, Meike; Benoit-Cattin, Alice; Berghoff, Carla F.; Bittig, Henry C.; Bonin, Jennifer A.; Bott, Randy; Bozzano, Roberto; Burger, Eugene F.; Brunetti, Fabio; Cantoni, Carolina; Castelli, Giuliano; Chambers, Don P.; Chierici, Melissa; Corbo, Andrea; Cronin, Margot; Cross, Jessica N.; Currie, Kim I.; Dentico, Carlotta; Emerson, Steven R.; Enochs, Ian C.; Enright, Matt P.; Enyo, Kazutaka; Ericson, Ylva; Evans, Wiley; Fay, Amanda R.; Feely, Richard A.; Fragiacomo, Elena; Fransson, Agneta; Gehrung, Martina; Giani, Michele; Glockzin, Michael; Hamnca, Siyabulela; Holodkov, Nikola; Hoppema, Mario; Ibánhez, J. Severino P.; Kadono, Koji; Kamb, Linus; Kralj, Martina; Kristensin, Tor O.; Laudicella, V. Alessandro; Lefèvre, Nathalie; Leseurre, Coraline; Lo Monaco, Claire; Maenner Jones, Stacy; Maenza, Reinaldo A.; McAuliffe, Anna M.; Mdokwana, Baxolele; Monacci, Natalie M.; Musielewicz, Sylvia; Neill, Craig; Newberger, Tim; Nojiri, Yukihiro; Ohman, Mark D.; Ólafsdóttir, Sólveig R.; Olivier, Léa; Omar, Abdirahman M.; Osborne, John; Pensieri, Sara; Petersen, Wilhelm; Plueddemann, Albert J.; Rehder, Gregor; Roden, Nicholas P.; Rutgersson, Anna; Sallée, Jean-Baptiste; Sanders, Richard; Sarpe, Dick; Schirnik, Carsten; Schlitzer, Reiner; Send, Uwe; Skjelvan, Ingunn; Sutherland, Stewart, C.; T’Jampens, Michiel; Tamsitt, Veronica; Telszewski, Maciej; Theetaert, Hannelore; Tilbrook, Bronte; Trull, Tom; Tsanwani, Mutshutshu; Van de Velde, Sebastiaan; Van Heuven, Steven M. A. C.; Veccia, Martín H.; Voynova, Yoana G.; Weller, Robert A.; Williams, Nancy L. (2025). Surface Ocean CO2 Atlas Database Version 2025 (SOCATv2025) (NCEI Accession 0304549). NOAA National Centers for Environmental Information. Dataset. https://doi.org/10.25921/648f-fv35.
Read MoreWave Power and UV Beams: OOI and 3newable Advance Wave-Powered Ocean Observing
Ocean technology is evolving rapidly, and wave energy is emerging as another promising pathway toward resilient, low-maintenance ocean observing systems. As part of that shift, 3newable LLC CEO Julie Fouquet and her team have been developing an innovative Wave Energy Converter (WEC) designed to provide reliable, small-scale power for ocean observing platforms. In parallel, they have created an ultraviolet (UV) illuminator designed to reduce biofouling on sensitive instruments.
Following a recent deployment at OOI’s Coastal Endurance Array, Fouquet sat down with us to discuss the evolution of the project, lessons learned from at-sea testing, and her vision for renewable ocean power in the years ahead.
From Concept to Ocean Deployment
The WEC project has gone through several iterations, including an early effort to test at OOI’s Pioneer New England Shelf Array. But logistical hurdles, funding constraints, and the eventual relocation of the Pioneer array prompted a pivot toward OOI’s Endurance Array, where Jonathan Fram, co-PI and Project Manager for the Endurance Array, was eager to support the UV-illumination component of the work.
That transition, initiated in 2022, set the stage for 3newable’s first field deployment in fall 2023, followed by a second deployment in spring 2025. The Endurance Array offered a flexible testbed and an engaged team ready to collaborate on mechanical integration, biofouling mitigation, and performance monitoring.
The WEC isn’t trying to compete with large-scale offshore energy systems. Instead, it’s purpose-built to deliver steady, modest power for sensors and low-draw electronics on buoys. In laboratory conditions, it can produce up to 50 watts, while real-world deployments are expected to eventually yield about 7 to 8 watts per WEC time-averaged over a year. Its fully sealed mechanical design prevents saltwater ingress, and its direct-drive electromagnetic engine allows it to operate with notably higher efficiency than many conventional designs.
Fouquet explained that the WEC uses a rack and pinion mechanism to convert buoy tilting motion into rotational power. While straightforward in concept, optimizing this system in real wave conditions demands careful tuning and specialized control algorithms. Wave-energy technologies vary widely, from large flaps and heaving-buoy systems to fully self-powered platforms, and with so many disparate approaches, nothing close to a “standard” design has emerged in the field. Given the wide range of wave-energy converter designs in the field, real-world deployments at the Endurance Array have been especially valuable in showing how the WEC’s sealed, compact approach behaves in operational conditions and where further refinements can enhance its performance.
Solving a Costly Challenge: Biofouling
One of OOI’s ongoing challenges is biofouling, which can shorten sensor deployments, degrade data quality, and drive-up servicing costs. Wide-angle emitters in the UV have been used to inhibit biofouling growth on some instruments, but they are not well-suited to the long, narrow geometries of the precision conductivity sensors used to measure salinity. Fouquet’s team developed a UV beam illuminator that can be powered either directly from the WEC or from a battery to keep the interior of a conductivity sensor clean.
During recent testing on buoy CE04, the UV system slightly outperformed tributyltin inserts that have traditionally been used to suppress microbial growth, while also offering a non-toxic alternative that avoids the environmental concerns associated with those legacy chemicals. Feedback from OOI engineers played a direct role in refining both the design and the deployment strategy, helping shape the system into a more effective tool for biofouling control.
The UV illuminator has become one of the project’s most promising offshoots, with potential to reduce maintenance cycle frequencies across a range of ocean observing platforms.
Testing the WEC at Sea: Early Data and Next Steps
In addition to working with OOI staff, 3newable also brought on recent OSU graduate Cedric LaPeyre, who had participated in the university’s Marine Energy Collegiate Competition (MECC) team. For the past four years, Endurance Array staff have collaborated with OSU’s MECC teams, each of which has designed a WEC concept around an OOI surface mooring for the Department of Energy competition. Through those connections, OOI was able to link Julie with students whose experience and skill sets aligned well with 3newable’s needs. La Peyre worked on the WEC at 3newable and on preparing the WEC for deployment at OOI-OSU.
During the recent deployment, the WEC achieved a net average power generation of 0.91 watts over 1 1/2 weeks, even in relatively low-energy conditions. Peak net average power generation during a five-minute interval was 2.4 W. For this demonstration, a commercial controller that consumes approximately 3 W was used in the control circuit, so the generated power was close to 4 W and the peak was over 5 W. The team also identified several engineering priorities, including better lubrication, wave-specific tuning, and control system modifications to maximize output in variable seas.
Fouquet emphasized that continued sea trials are essential: “We challenge our equipment in the lab, but the ocean is the ultimate test environment. Every deployment teaches us something new about the design, about the conditions, and about how to make our equipment truly practical.”
Funding Realities and Looking Forward
3newable deeply appreciates past support from the U.S. Department of Energy’s Water Power Technologies Office. However, changes to federal funding priorities have created major delays and uncertainties. Fouquet expressed concern that many renewable-energy innovators face similar hurdles, particularly smaller companies working on niche but important technologies.
Still, the long-term vision remains clear: “Expand the role of renewables within ocean observations and reduce the frequency of service voyages so that observing systems can sustain themselves with minimal intervention,” said Fouquet.
3newable would like to continue refining both the WEC and the UV illuminator, exploring new deployment opportunities, and working with OOI to strengthen ocean observing infrastructure through clean, efficient power.
As testing continues, the WEC project showcases the power of collaboration between engineers, researchers, and observing programs. Fouquet’s willingness to iterate quickly, integrate feedback, and share results openly reflects the spirit of innovation OOI strives to foster.
We look forward to sharing future updates as the project advances and as renewable ocean power becomes an increasingly central part of the global ocean observing landscape.
[caption id="attachment_37217" align="alignnone" width="1440"]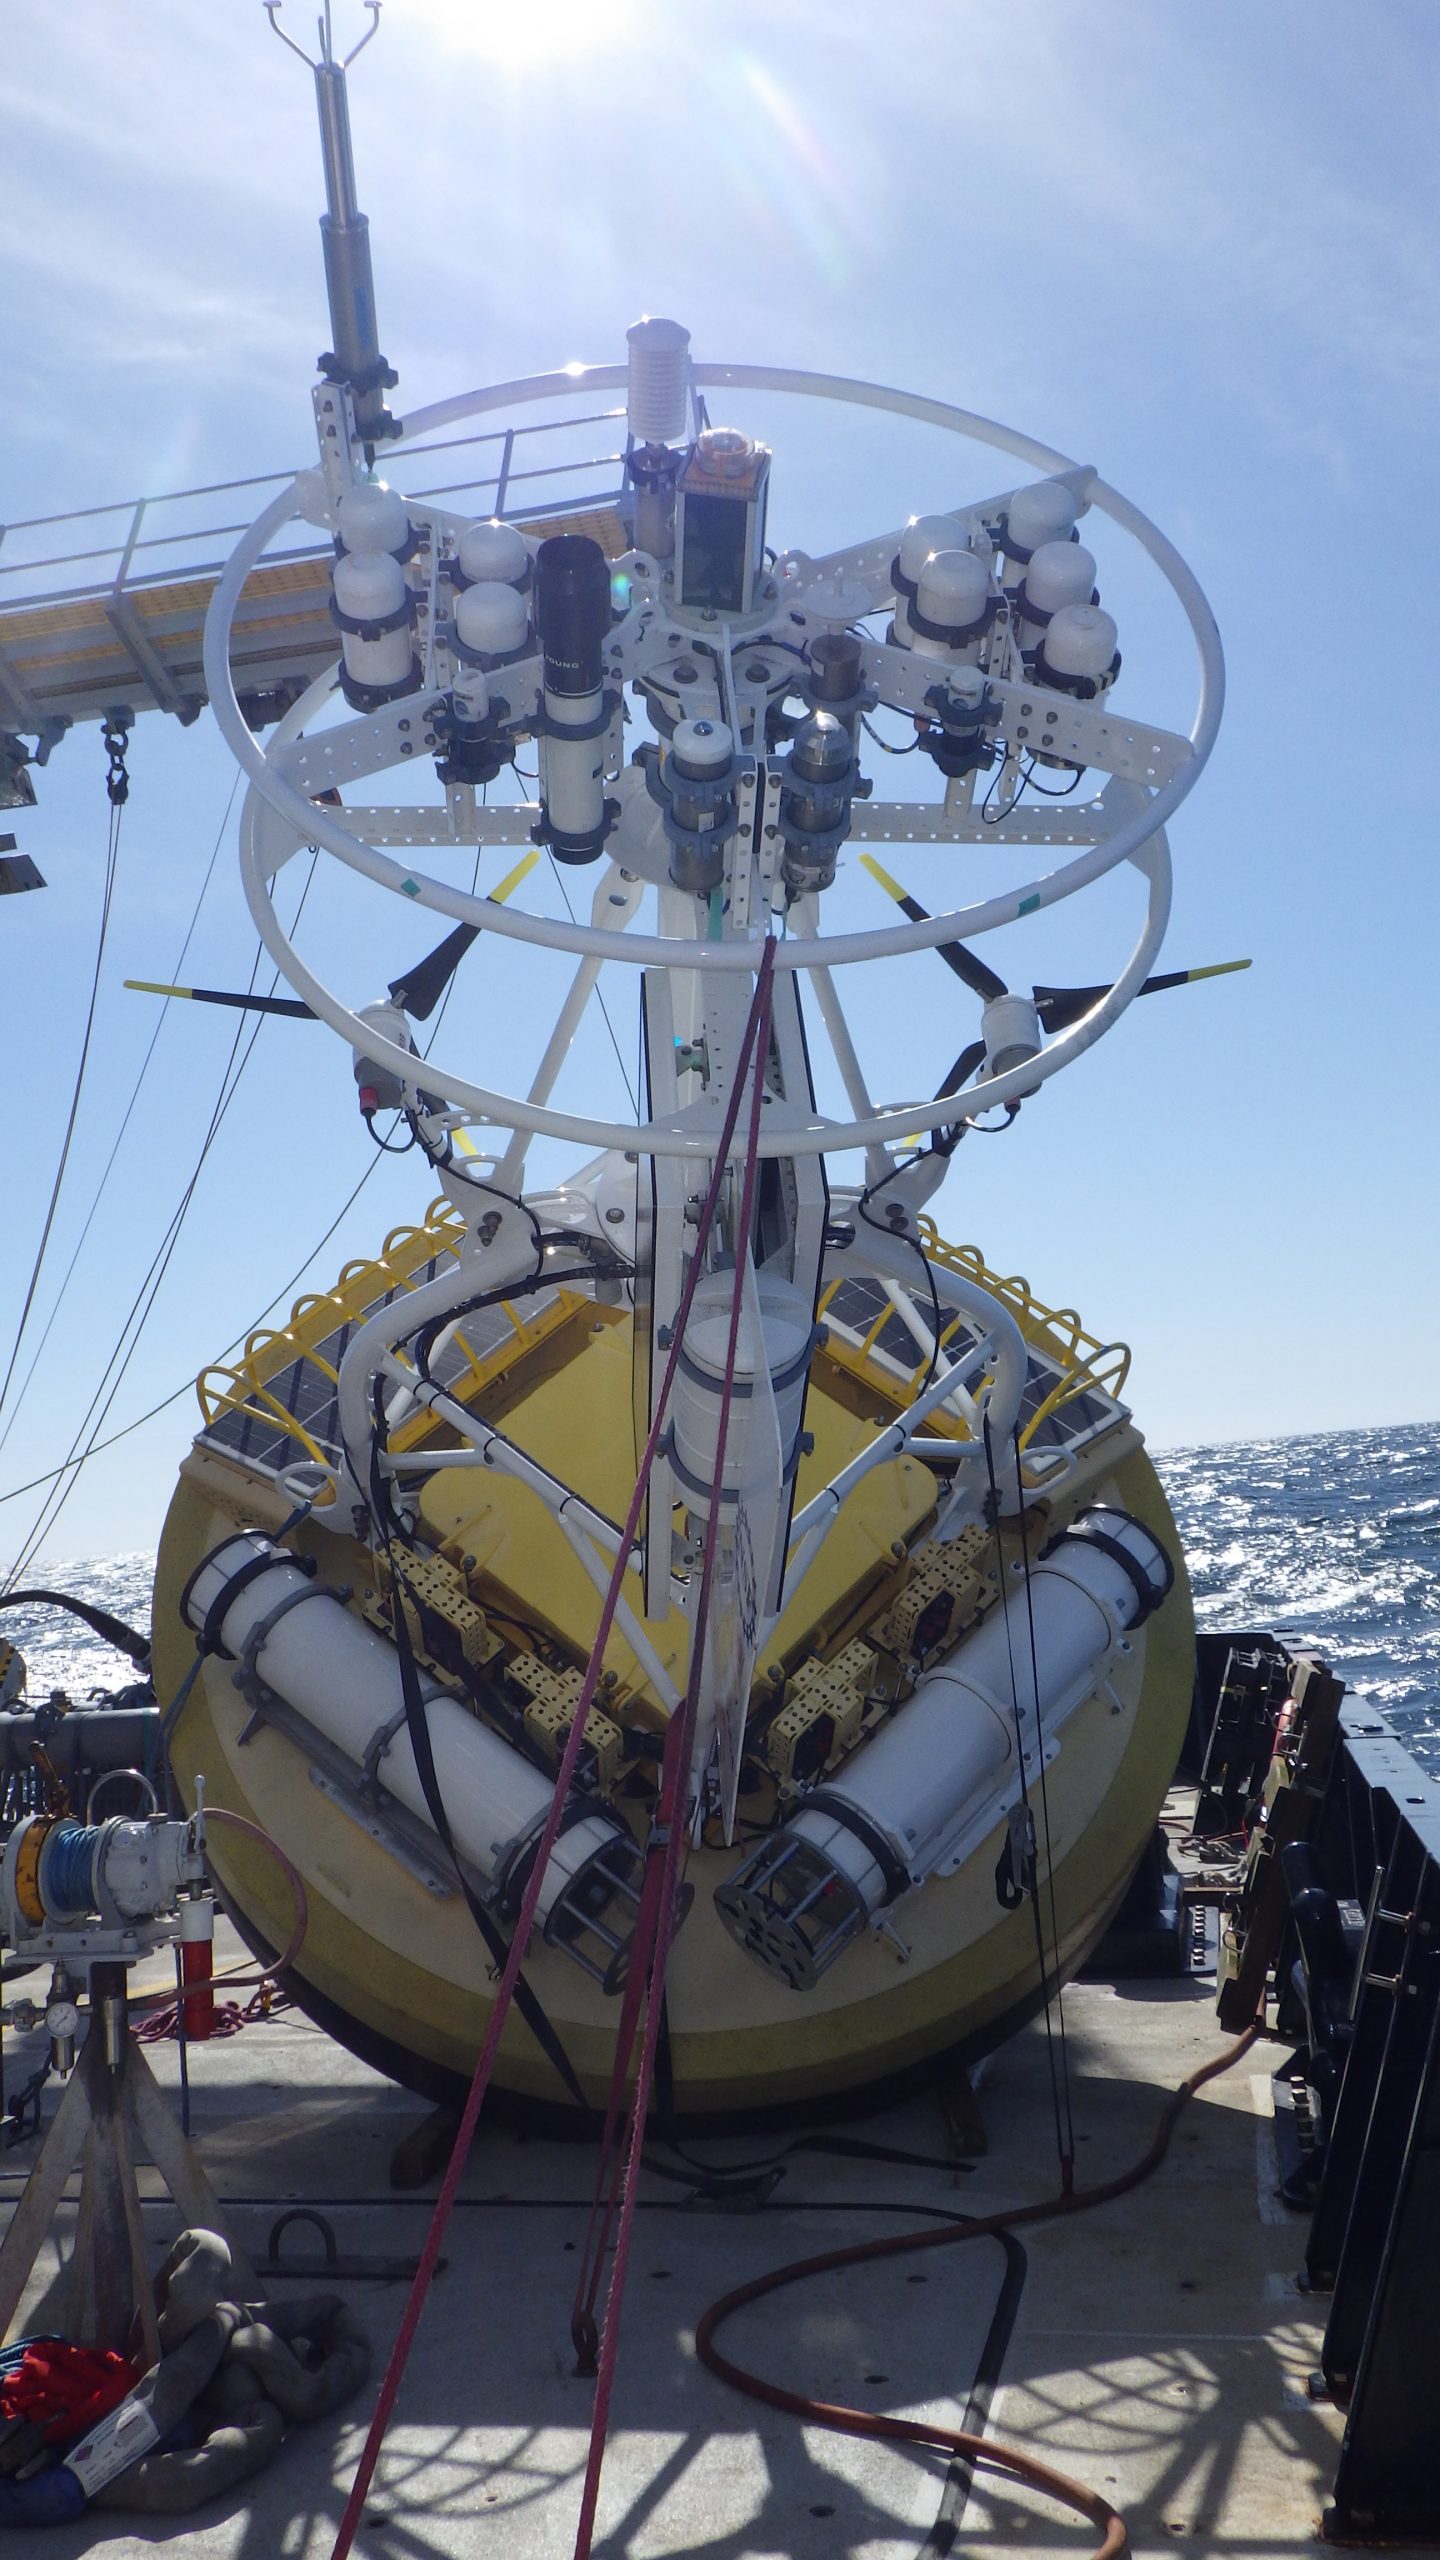 WEC UV Summer 2025 Deployment. (c): Endurance Array, OSU[/caption]
[caption id="attachment_37214" align="alignnone" width="2560"]
WEC UV Summer 2025 Deployment. (c): Endurance Array, OSU[/caption]
[caption id="attachment_37214" align="alignnone" width="2560"]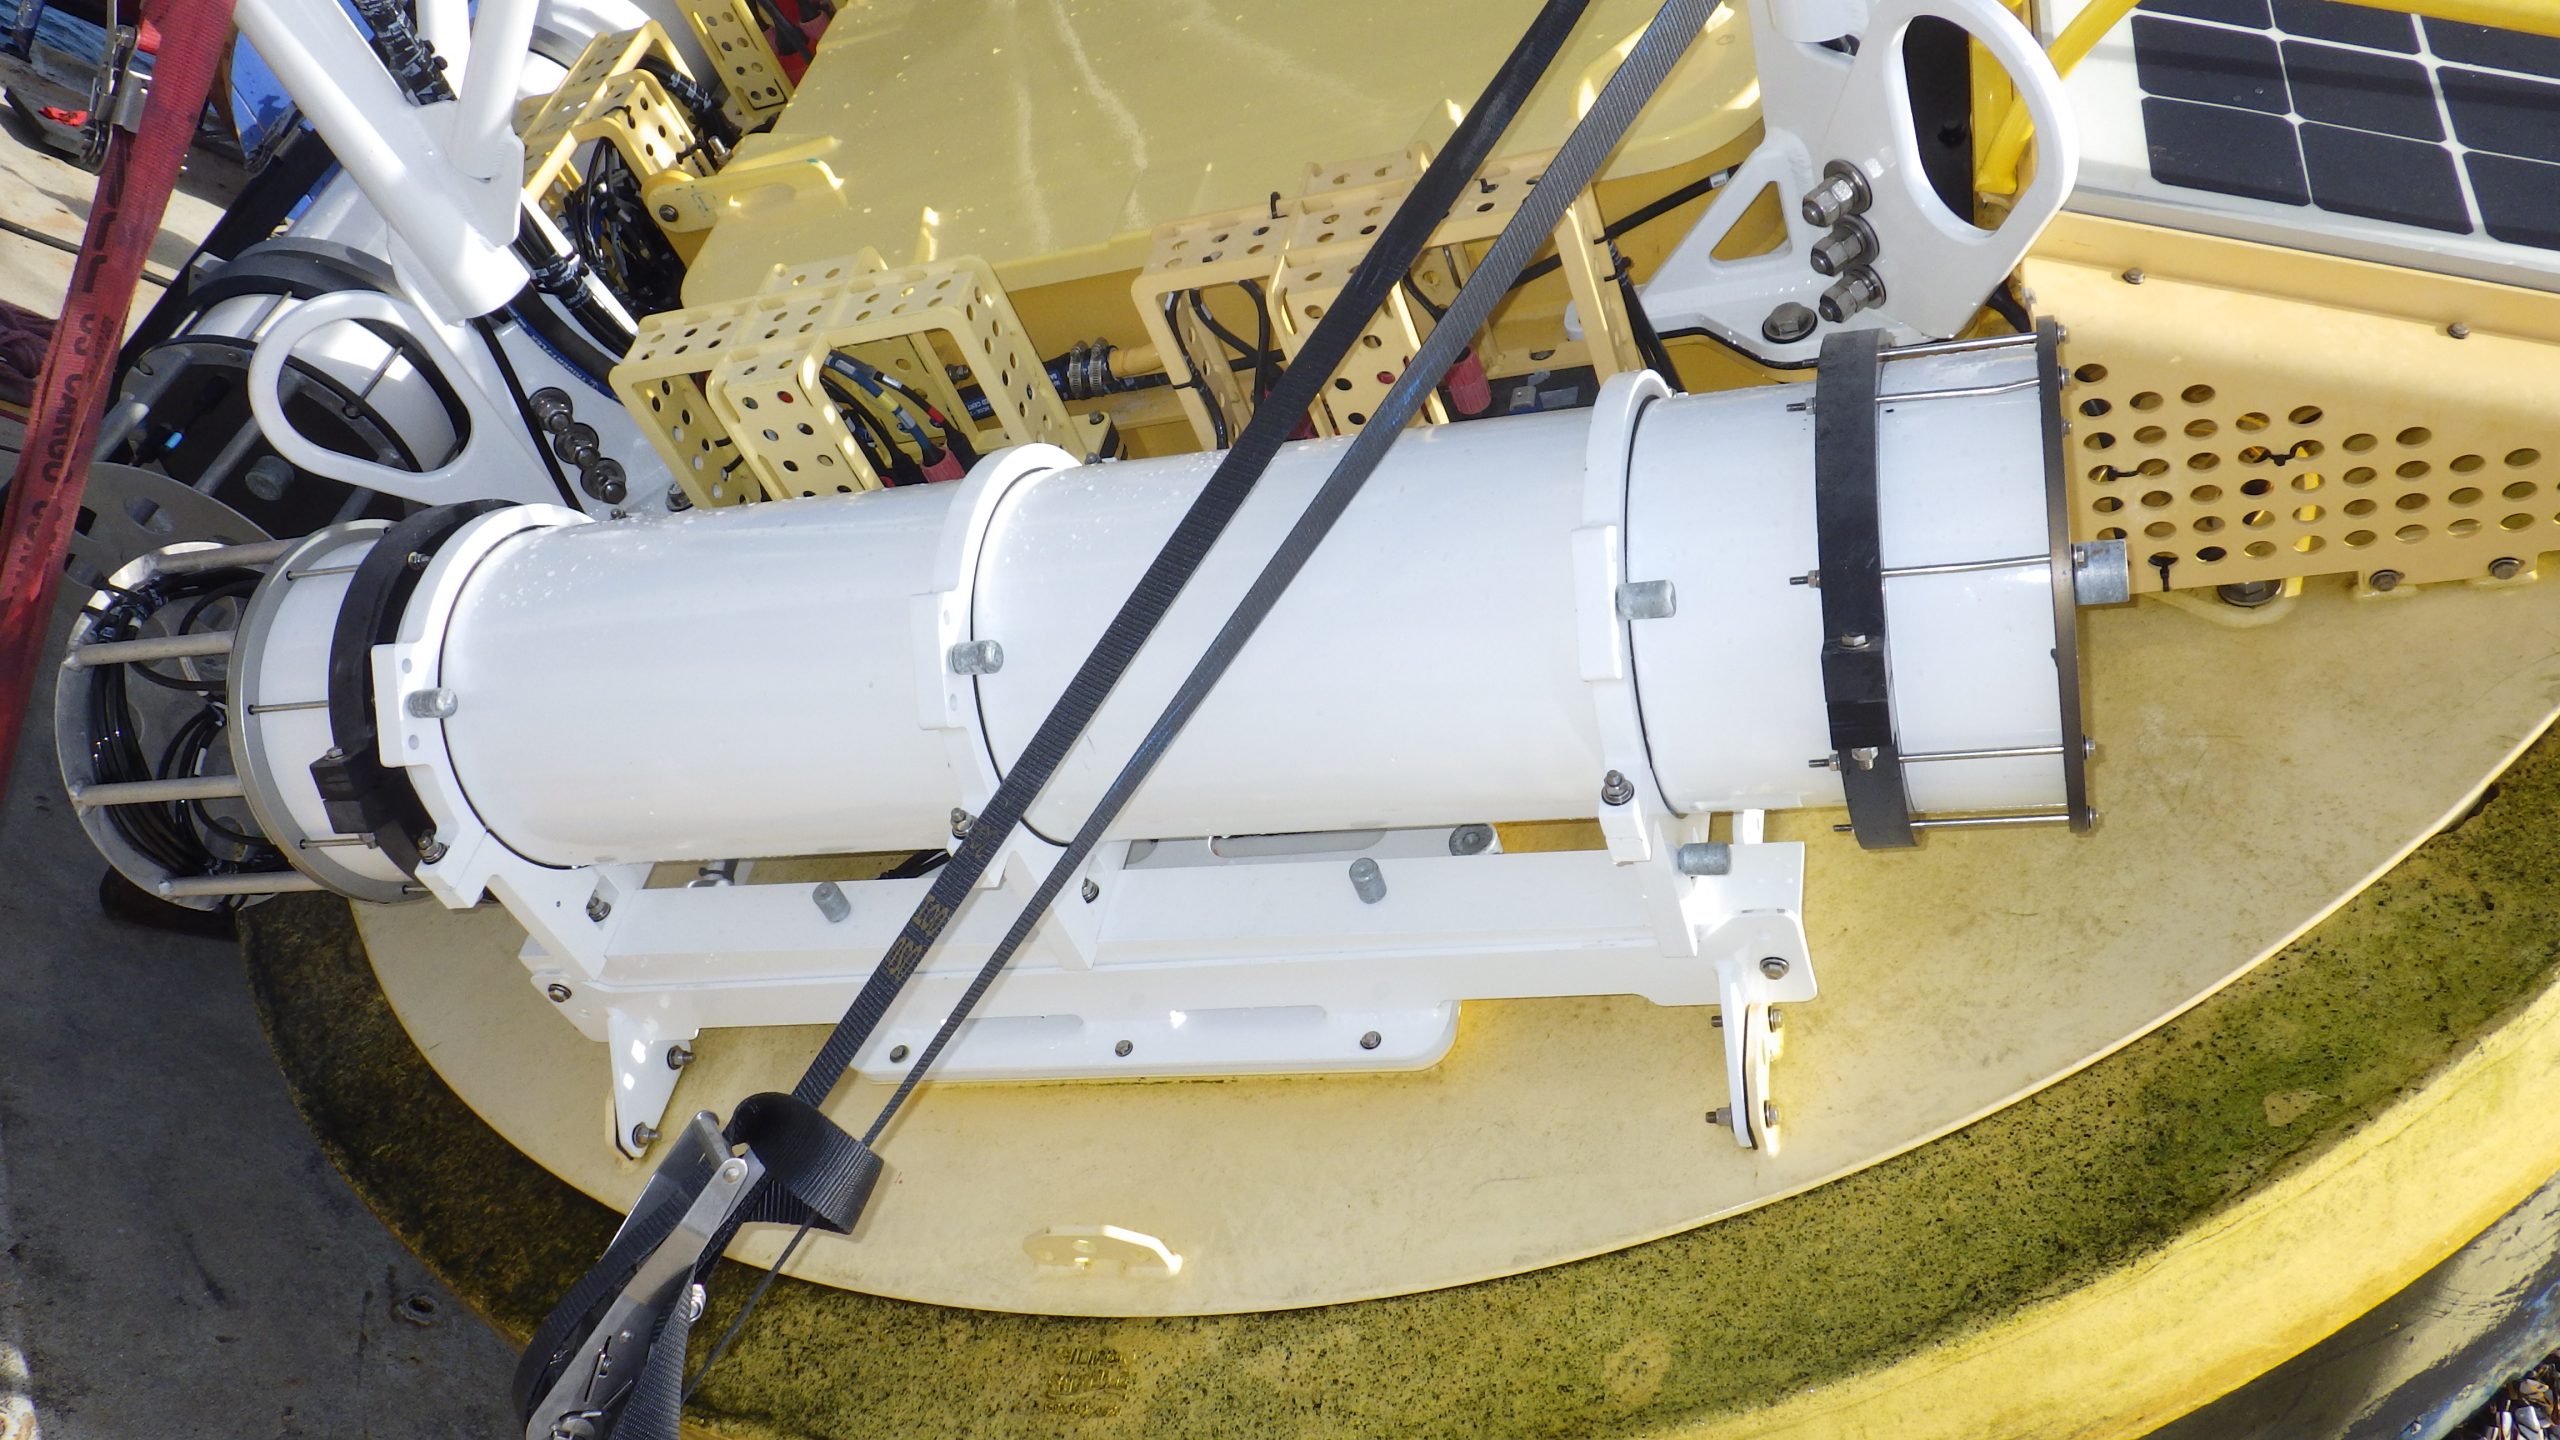 WEC Upon Recovery. (c): Endurance Array, OSU[/caption]
[caption id="attachment_37219" align="alignnone" width="960"]
WEC Upon Recovery. (c): Endurance Array, OSU[/caption]
[caption id="attachment_37219" align="alignnone" width="960"]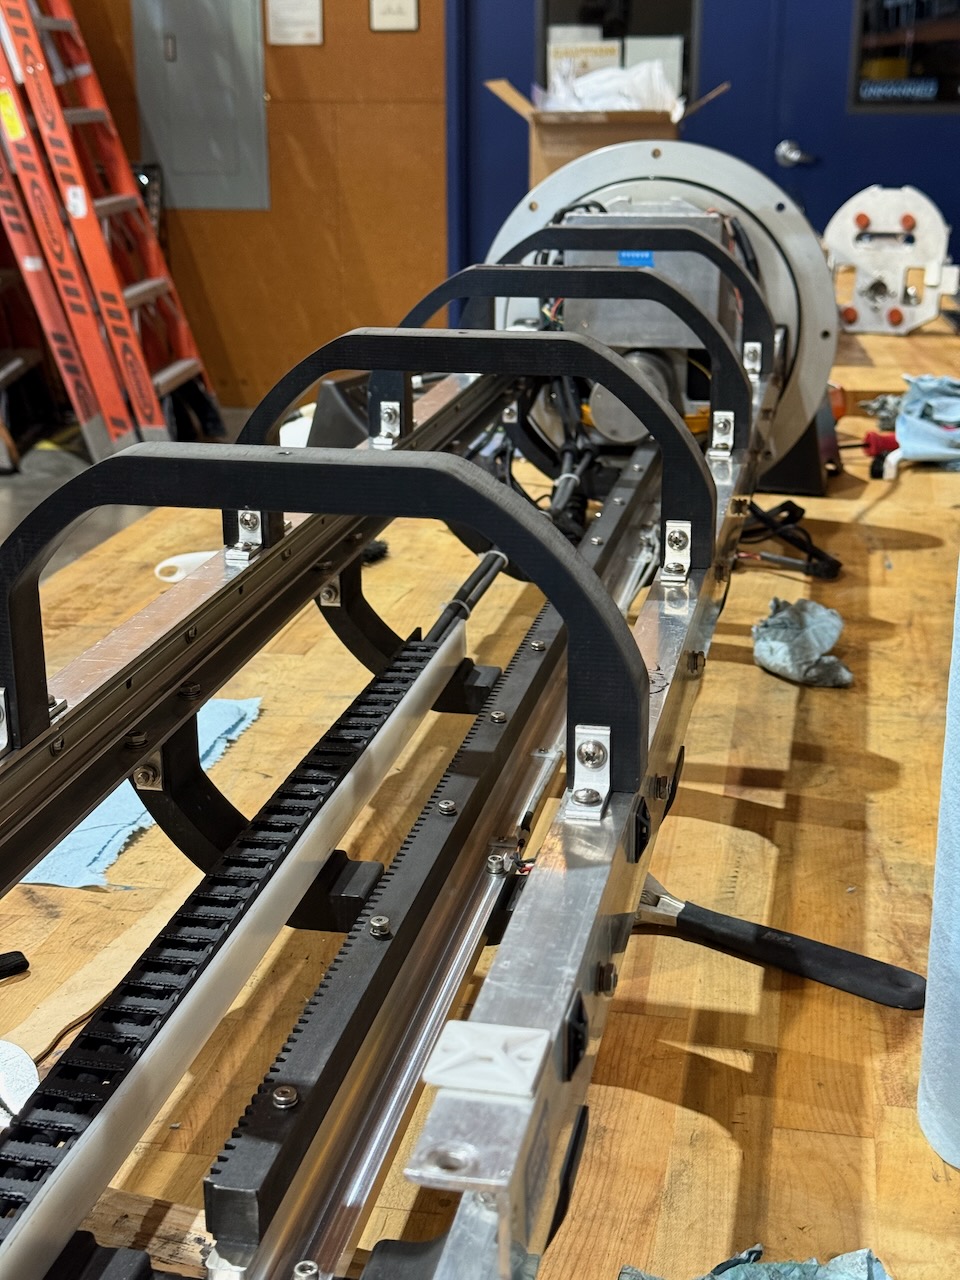 WEC chassis after recovery at OOI-OSU. (c): Julie Fouquet, 3newable LLC[/caption]
[caption id="attachment_37216" align="alignnone" width="1280"]
WEC chassis after recovery at OOI-OSU. (c): Julie Fouquet, 3newable LLC[/caption]
[caption id="attachment_37216" align="alignnone" width="1280"]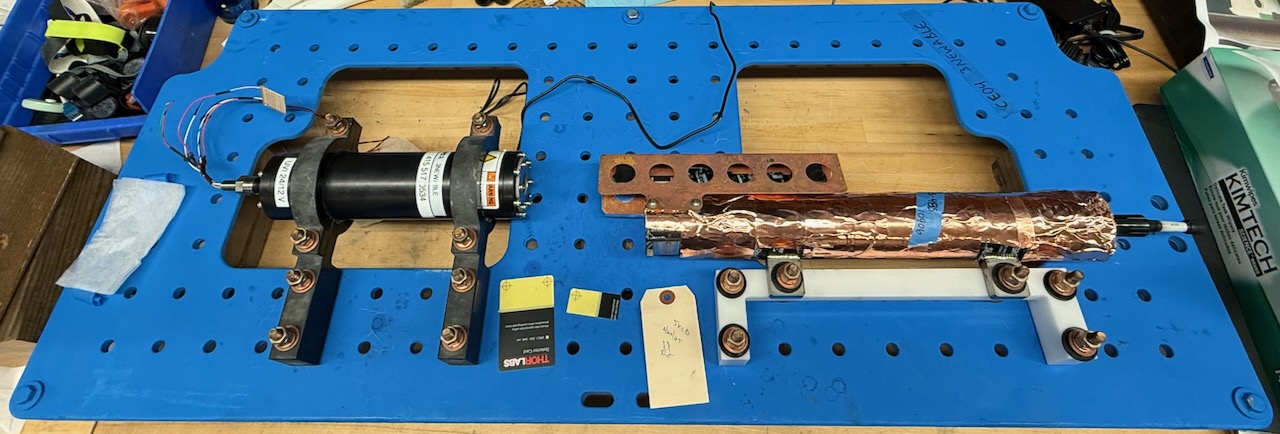 3newable’s UV illuminator (at left) sends a beam down the interior of the conductivity cell of a salinity sensor (at right) to prevent biofouling. (c): Julie Fouquet, 3newable LLC[/caption]
[caption id="attachment_37215" align="alignnone" width="1440"]
3newable’s UV illuminator (at left) sends a beam down the interior of the conductivity cell of a salinity sensor (at right) to prevent biofouling. (c): Julie Fouquet, 3newable LLC[/caption]
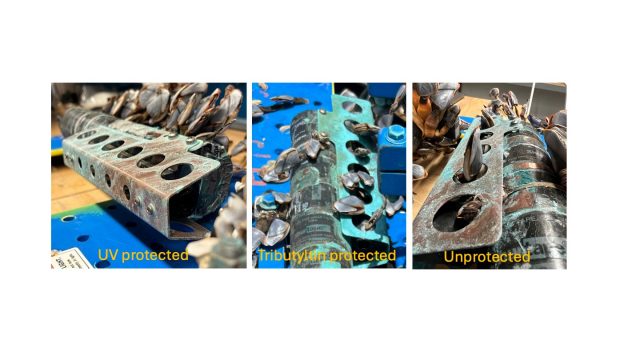
[caption id="attachment_37215" align="alignnone" width="1440"] Gooseneck barnacle growth varied by treatment: healthy on the unprotected CT, weakened near the tributyltin-protected CT, and nearly absent beside the UV-protected CT. (c): Julie Fouquet, 3newable LLC[/caption]
Read More
Gooseneck barnacle growth varied by treatment: healthy on the unprotected CT, weakened near the tributyltin-protected CT, and nearly absent beside the UV-protected CT. (c): Julie Fouquet, 3newable LLC[/caption]
Read More Portuguese Student Innovators Explore Ocean Engineering at OOI
A team of young innovators and their professor from Colégio Valsassina in Portugal recently stopped by Ocean Observatories Initiative (OOI) during their prize trip to the United States earned after winning the 2024–2025 Atlantic Junior Award. Their award-winning project centered on designing a low-flying aircraft capable of collecting coastal and ocean data, a concept that impressed judges and highlighted how engineering can support marine science.
During their visit to the OOI facilities at the Land Ocean Sensors and Observing Systems (LOSOS) lab, the students got an inside look at how OOI engineers build and maintain the coastal and global observing systems operating across the world’s oceans. Project Scientist Jim Edson showcased how OOI data is being used to support scientific investigations over the ocean. The tour also included hands-on demonstrations and conversations about instrument design, power systems, data delivery, and the challenges of long-term operations at sea.
Bridgewater State University played a key role in facilitating the visit, enabled by the Luso-American Development Foundation, helping ensure the students’ U.S. experience showcased both academic and engineering perspectives.
[caption id="attachment_37205" align="alignnone" width="480"] Lead Principal Investigator (PI) of OOI James Edson speaks to visiting students at LOSOS. © Viriato “Vinny” de Macedo, Bridgewater State University[/caption]
[caption id="attachment_37207" align="alignnone" width="480"]
Lead Principal Investigator (PI) of OOI James Edson speaks to visiting students at LOSOS. © Viriato “Vinny” de Macedo, Bridgewater State University[/caption]
[caption id="attachment_37207" align="alignnone" width="480"] Lead Principal Investigator (PI) of OOI James Edson speaks to visiting students at LOSOS. © Viriato “Vinny” de Macedo, Bridgewater State University[/caption]
[caption id="attachment_37206" align="alignnone" width="640"] © Viriato “Vinny” de Macedo, Bridgewater State University[/caption]
Read More
Lead Principal Investigator (PI) of OOI James Edson speaks to visiting students at LOSOS. © Viriato “Vinny” de Macedo, Bridgewater State University[/caption]
[caption id="attachment_37206" align="alignnone" width="640"] © Viriato “Vinny” de Macedo, Bridgewater State University[/caption]
Read More AI at sea: Dell and Oregon State dig deep to power the next wave of ocean discovery
The future of ocean science is arriving on the bow of a $150 million research vessel — complete with an onboard data center, AI-driven sampling tools and a new blueprint for how supercomputing meets ocean science. Read more from siliconANGLE.
Read MoreOOI Engages with Broader Earth Science Community at NCAR/UCAR Members’ Meeting

Early in October, OOI Lead Principal Investigator Dr. Jim Edson attended the annual NCAR/UCAR Members’ Meeting, where leaders from across the atmospheric, oceanic, and Earth sciences gathered to discuss shared challenges and opportunities in advancing community-driven science. The event, hosted by the University Corporation for Atmospheric Research (UCAR) which manages the National Center for Atmospheric Research (NCAR), provided an excellent opportunity to connect with colleagues, strengthen partnerships, and highlight how OOI data can contribute to interdisciplinary research across the environmental sciences.
Attending as a representative for both the Woods Hole Oceanographic Institution and OOI, Jim met with peers from oceanographic institutions and universities with strong programs in ocean, Earth, and atmospheric sciences. Conversations focused on expanding collaboration between NCAR and OOI, particularly in areas of data integration and educational engagement.
Discussions included potential joint initiatives, such as:
- Data Sharing and Integration: Exploring ways to link OOI’s data acquisition systems with NCAR’s Geoscience Data Exchange (GDEX) to enhance community access.
- Field Collaboration: Participation in an upcoming Pioneer Array turnaround cruise, with the goal of launching rawinsonde balloons to study the marine atmospheric boundary layer.
These efforts demonstrate OOI’s ongoing commitment to fostering partnerships that bridge ocean and atmospheric sciences, supporting both cutting-edge research and the next generation of Earth system scientists.
[caption id="attachment_37166" align="alignnone" width="1280"] Dr. Carol Anne Clayson and Dr. Jim Edson at the 2025 NCAR/UCAR Members’ Meeting[/caption]
Read More
Dr. Carol Anne Clayson and Dr. Jim Edson at the 2025 NCAR/UCAR Members’ Meeting[/caption]
Read More Nine years of water sampling data from the Pioneer New England Shelf Array now Available through BCO-DMO
OOI’s collaboration with the Biological & Chemical Oceanography Data Management Office (BCO-DMO) continues to expand. A new dataset compiling all discrete water sampling data from the Pioneer New England Shelf (NES) Array from 2013 to 2022 has been archived and is now publicly accessible through BCO-DMO.
OOI and BCO-DMO launched this partnership in 2023 to make OOI water sampling data broadly accessible through both the BCO-DMO website and BCO-DMO’s ERDDAP server. BCO-DMO curates oceanographic data for public use in alignment with FAIR data principles, ensuring datasets are findable, accessible, interoperable, and reusable.
Distributing OOI water sampling data through BCO-DMO provides several key benefits. The cruise-by-cruise discrete data sheets are concatenated into a single dataset, assigned a Digital Object Identifier (DOI), and served via ERDDAP to enable both user-friendly browsing and machine-to-machine access. In addition, each dataset is accompanied by detailed descriptions of sampling and processing methods and includes README files for every contributing cruise.
With the addition of the Pioneer NES Array, BCO-DMO now hosts compiled OOI discrete water sampling datasets from each of the following arrays:
- Station Papa Array
- Irminger Sea Array
- Southern Ocean Array
- Argentine Basin Array
- Pioneer NES Array (newly added)
You can access each of these datasets through this BCO-DMO project record for all OOI Discrete CTD and Water Sampling Cruise Data, or from the BCO-DMO home page by selecting Projects and searching for “OOI Discrete CTD and Water Sampling Cruise Data.”
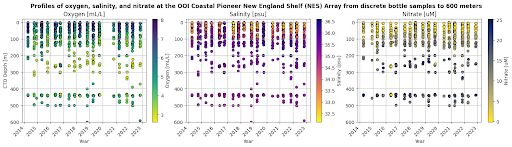
Figures 1 and 2 provide example plots generated from the nine-year Pioneer NES Array. A Python script (implemented in a Jupyter Notebook available here) was used to access the data from the BCO-DMO ERDDAP server, extract variables of interest, apply available quality control (QC) flags and visualize the data. Figure 1 shows profiles of selected variables for successive cruises to give a sense of the depth-time data coverage. Note that the sample depths are generally concentrated in the upper 200 meters of the water column at Pioneer NES since the OOI sampling goal is to validate instruments on the moorings rather than collect comprehensive profile data. Samples at depths greater than the maximum moored instrument depth of 450 m were collected to support mobile asset or collaborative cruise operations on the outer shelf. Figure 2 represents profile variability over time by overlaying all discrete observations for oxygen, salinity and nitrate with the color gradient representing the date of observations.
[caption id="attachment_37141" align="alignnone" width="512"] Figure 1. Profiles of oxygen, salinity, and nitrate at the OOI Coastal Pioneer New England Shelf (NES) Array from discrete bottle samples.[/caption]
[caption id="attachment_37142" align="alignnone" width="512"]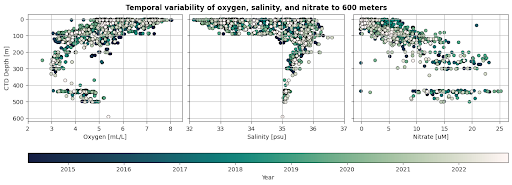 Figure 2. Temporal variability of oxygen, salinity, and nitrate from discrete bottle samples over 9 years depicted as overlaid profiles.[/caption]
The discrete water samples are collected in conjunction with standard CTD casts. For several variables (e.g. salinity, chlorophyll, oxygen) this allows comparison between CTD sensors and discrete samples at each depth where a Niskin bottle is closed. In Figure 3, discrete sample oxygen observations at the 3 coastal surface mooring sites of Pioneer NES in Fall 2021 exhibit good agreement with the CTD rosette-mounted SBE 43 Dissolved Oxygen Sensor.
[caption id="attachment_37143" align="alignnone" width="512"]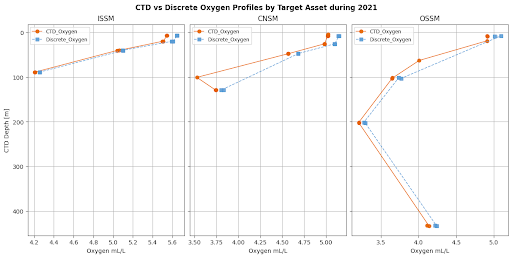 Figure 3. Profiles of discrete sample oxygen and CTD rosette-mounted oxygen observations at the time of bottle closure for comparison.[/caption]
Note that target asset names for the Pioneer NES array may differ slightly between cruises. For example, “CNSM” (used in Fall 2021) and “CN” (used in Spring 2021) refer to the same station location. Discrete README files within the BCO-DMO dataset and CTD Cast Logs on OOI’s Raw Data Archive can provide useful information to help identify relevant samples.
Figure 4 highlights additional seasonal insights offered by the Pioneer NES dataset through biannual research cruises, usually in the Spring and Fall of each year. The CTD temperature observations at bottle depths show strong seasonal variability as the surface layer transitions from stratified to well-mixed. A similar but more subtle signal also appears below 60 meters. The discrete water sample properties captured during Pioneer NES cruises constitute a long-term record of seasonal changes in water mass properties on the shelf and slope.
[caption id="attachment_37144" align="alignnone" width="512"]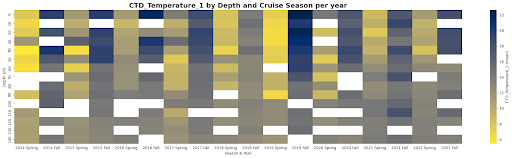 Figure 4. Hovmöller diagram of seasonal mean sea water temperature in the upper 150 meters of the water column surrounding the array.[/caption]
For additional Python scripts to explore OOI Discrete CTD and Water Sampling Cruise Data as distributed by BCO-DMO, see the Jupyter notebooks available in this GitHub repository: https://github.com/WHOIGit/ooi-on-bco-dmo/tree/main/notebooks.
Read MoreEmpowering Ocean Research: The Evolution of the OOI Data Center at Oregon State University

Written by Craig Risien, OOI Data Center Program Manager, and reviewed by Jack Barth, DC Principal Investigator
Oregon State University (OSU) in collaboration with Dell Technologies, has led the development and operation of the Ocean Observatories Initiative (OOI) Data Center since 2021. This facility serves as the backbone of OOI, supporting the collection, management and distribution of scientific data from across the OOI network.
Working closely with Dell Technologies, OSU built and configured the OOI 2.0 Data Center – a secure, scalable, and modern computing environment that become the official system of record on July 30, 2021. The transition from Rutgers University was completed without any downtime or disruption to services. Since then, the OSU team has maintained continuous operations with zero unplanned outages.
In 2025, OSU and Dell Technologies completed a major upgrade, launching the OOI 2.5 Data Center. This refresh doubled the data storage capacity, increased the network speeds by a factor of four, and greatly expanded the compute capacity, ensuring that OOI can continue to meet the growing demands of ocean data processing and delivery. The upgrade also significantly enhanced OOI’s cybersecurity by partnering with the National Science Foundation (NSF) funded Texas Advanced Computing Center (TACC), which provides a geographically remote, immutable backup of all OOI scientific data. The transition from OOI 2.0 to 2.5 was completely in Spring 2024.
Today, the OOI Data Center manages approximately 3.3 petabytes (PB) of data and distributes over 200 terabytes (TB) of data each year in response to more than 50 million data requests.
To simplify user access, the Data Center adopted CILogon, an NSF and Department of Energy (DOE) supported identity management system. This allows users to securely log in with credentials from their home institutions or identity providers such as ORCID, removing the need for multiple accounts.
OOI’s cybersecurity program continues to grow under the guidance of Trusted CI, the NSF Cybersecurity Center of Excellence. In 2022, the Data Center joined the first Trusted CI framework assessment cohort. In 2023, it became a member of the Trusted CI Research Infrastructure Security Community (RISC). In 2024, the team completed a framework reassessment alongside three other NSF Major Facilities, reaffirming its leadership position in cybersecurity.
The Data Center also offers a JupyterHub environment that givers researchers and students direct access to OOI data with no downloads required. This free resource supports Python, R, and MATLAB and includes NVIDIA GPUs for AI and machine learning work. JupyterHub has supported multiple community activities, including the 2023 Bio-optics Sensors and 2025 Acoustics OOIFB Summer Schools, the 2025 Imaging FlowCytobot (IFCB) Workshop, and numerous undergraduate courses, helping researchers and educators explore OOI data more efficiently.
[caption id="attachment_37174" align="alignnone" width="2560"]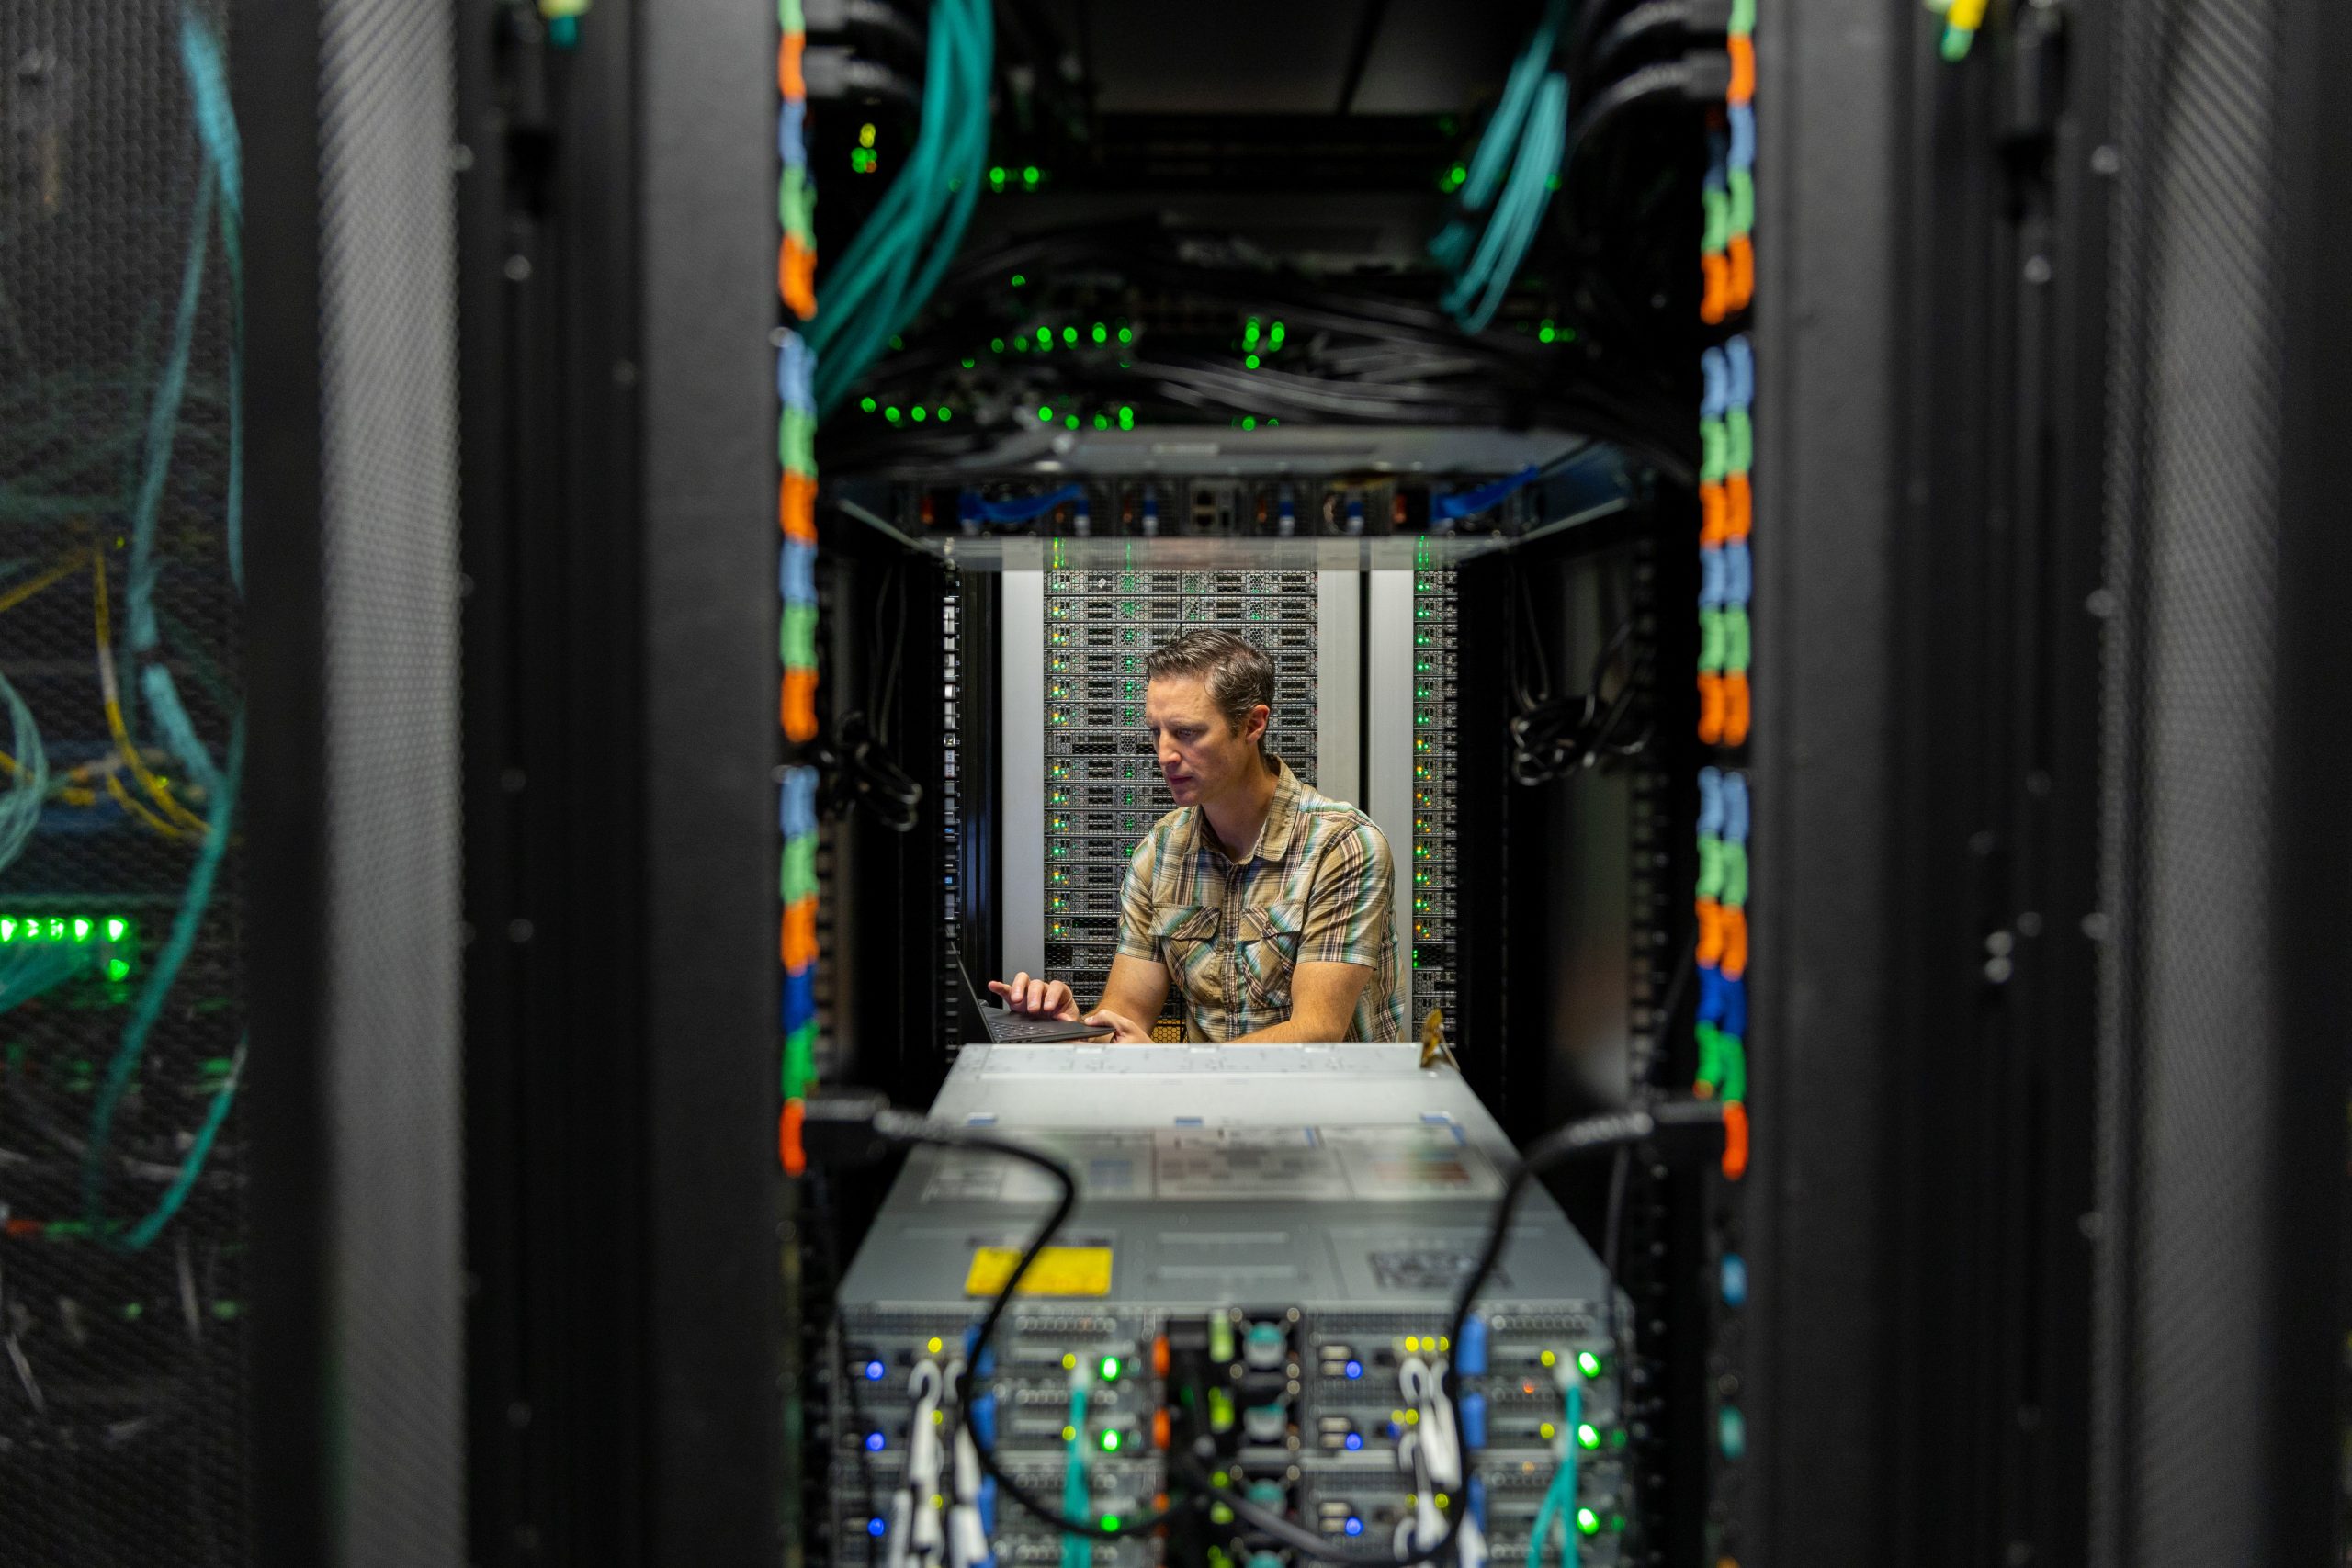 Credit: Oregon State University (OSU)[/caption]
Read More
Credit: Oregon State University (OSU)[/caption]
Read More UW researcher launches new technology for underwater acoustics
Earlier this month, a UW researcher deployed fiber optic cables — which are cables used to rapidly transmit audio and video data — into the Puget Sound, opening the floor for innovative research into marine mammals.
The fiber optic cable system was developed in the UW Ocean Data Lab, run by professor Shima Abadi. Abadi’s research focuses on passive underwater acoustics in oceanography, or listening for noises in the ocean.
A hydrophone, or underwater microphone, is typically used to record acoustics. The Ocean Observatories Initiative, a project funded by the National Science Foundation, has recorded underwater data for 10 years to observe long term trends in ocean ambient noise in Oregon and Washington. Read more from THEDAILY.
Read MoreThe 2019 marine heatwave at Ocean Station Papa
(Adapted from Kohlman et al., 2024)
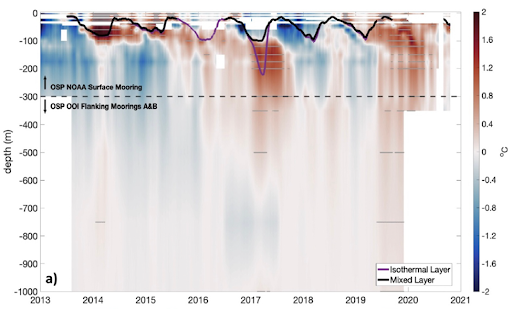
Marine Heat Waves (MHW; Hobday et al., 2016) are prolonged periods of extreme ocean sea surface temperature (SST) anomalies. MHWs are typically identified in satellite SST and/or ocean color records; subsurface data and interdisciplinary variables are often lacking. Ocean Station Papa (OSP) provided long-term, interdisciplinary, subsurface data to examine the physical and biochemical characteristics of a MHW in the Northeast Pacific.
MHWs may have multi-faceted causes, as well as impacts on primary production and higher trophic levels. A recent paper by Kohlman et al. (2024) examines the 2019 NE Pacific MHW using gridded satellite SST data and in-situ observations from multiple OSP platforms including the NOAA Pacific Marine Environmental Lab (PMEL) surface mooring, two OOI Flanking Moorings, the Applied Physics Lab (U. Washington) waverider mooring and shipboard samples from OOI and the Department of Fisheries and Oceans, Canada.
The 2019 MHW was identified in satellite SST data, but the Kohlman et al. study also assessed vertical stratification and the subsurface extent of the temperature signal. The PMEL surface mooring provided temperature and salinity (T/S) down to 300 m. The OOI Flanking Moorings extended the T/S data to 1500 m. The resulting composite time series from 2013-2020 is shown in Fig. 1. Both the extended 2013-2015 MHW and the 2019 MHW are identifiable. Subsurface temperature anomalies during 2013-2014 were strongest above the mixed layer depth (MLD). In the winter and spring of 2017, deeper waters (120–300 m) remained anomalously warm. This anomaly persisted into 2018 due to strong stratification from a fresher surface layer. During the 2019 MHW, anomalously warm waters extended down to 1000 m, whereas the 2013-2015 MHW extended only to about 150 m.
The authors used interdisciplinary data available from Station Papa platforms to assess the drivers and impacts of the 2019 MHW. They found that weaker winds and smaller significant wave height prior to the summer of 2019 created favorable pre-conditioning in the form of an unusually shallow winter MLD. During the MHW, they found that dissolved inorganic carbon and pCO2 decreased, while pH increased. Shipboard samples indicated a decrease in nutrients and an increase in primary productivity. Finally, they speculated that the increased productivity may have had an impact on higher trophic levels – more blue whale calls were recorded in 2019 at Station Papa than normal for Aug-Sep.
This project shows that the characteristics of MHWs are complex. Sustained, multi-disciplinary, subsurface observations are needed to unravel the drivers, pre-conditioning, characteristics, and impacts of these events. Station Papa, among the longest sustained ocean time series sites, is uniquely suited due to the task due to the collaborative observing effort at the site.
[caption id="attachment_37120" align="alignnone" width="512"] Figure 1. Subsurface temperature anomalies at Staton Papa during 2013-2020. Data from the surface to 300 m are from the PMEL surface mooring. Data below 300 m are from the OOI Flanking Moorings. Anomalies are relative to the 1999-2020 Argo climatology. The density-based mixed layer depth (black) and isothermal depth (purple) are overlaid. From Kohlman et al., 2024.[/caption]
___________________
References:
Hobday, A.J., Alexander, L.V., Perkins, S.E., Smale, D.A., Straub, S.C., Oliver, E.C.J., et al. (2016). A hierarchical approach to defining marine heatwaves. Prog. Oceanog., 141(0079–6611), 227–238. https://doi.org/10.1016/j.pocean.2015.12.014.
Kohlman, C., Cronin, M.F., Dziak, R., Mellinger, D.K., Sutton, A., Galbraith, M., et al. (2024). The 2019 marine heatwave at Ocean Station Papa: A multi‐disciplinary assessment of ocean conditions and impacts on marine ecosystems. J. Geophys. Res., 129, e2023JC020167. https://doi.org/10.1029/2023JC020167.
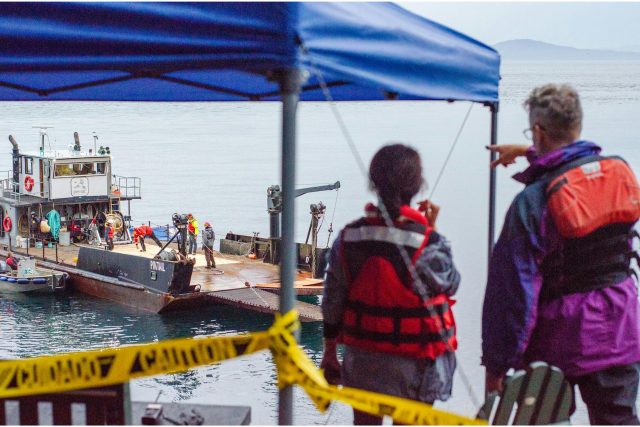
Read MoreSubmarine canyon sediment transport and accumulation during sea level highstand: Interactive seasonal regimes in the head of Astoria Canyon, WA
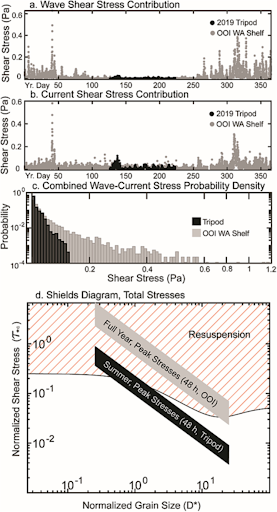
Lahr et al. (2025) use in-situ hydrodynamic data from a benthic tripod deployment in the head of Astoria Canyon to show that sediment resuspension and transport during summer is driven by internal tides and plume-associated nonlinear internal waves. Observations of shoreward-directed currents and low shear stresses (<0.14 Pa) along with sediment trap data suggest that seasonal loading of the canyon head occurs during summer. Nearby long-term wave data from the OOI Washington Shelf mooring shows that winter storm significant wave height often exceeds 10 m, driving shear stress capable of resuspending all grain sizes present within the canyon head. Swell events are generally concurrent with downwelling flows, providing a mechanism for episodic downcanyon sediment flux. This study indicates that canyon heads can continue to function as sites of sediment winnowing and bottom boundary layer export even with a detached, shelf-depth canyon head.
As part of this study, Lahr et al. (2025), used data from the OOI Washington Shelf Surface Mooring located 81 km north of the tripod site in Astoria Canyon. The 2019 benthic tripod deployment by Ogston was done as an ancillary activity on the Endurance 11B cruise aboard R/V Oceanus. The data used were concurrent spectral surface wave and meteorological data near bed current velocity for 2016 (chosen for its complete records). Figure xx shows the benthic tripod stress overlaid with the OOI Washington shelf mooring stress. Over the summer, the benthic tripod stress and OOI estimated stress compare well. Winter stresses (available from OOI mooring only) are much larger than those observed in summer.
[caption id="attachment_37116" align="alignnone" width="277"] Figure 1. Shear stress computed from the Astoria Canyon tripod deployment (black) and the OOI Shelf mooring (gray). Panels a) and b) depict relative stress contributions from waves and currents respectively, c) the distribution of total stresses, and d) maximum shear stresses from summer and winter on a Shields diagram. (Figure 3, Lahr et al., 2025)[/caption]
___________________
Reference:
Lahr, E.J., A.S. Ogston, J.C. Hill, H.E. Glover, and K.J. Rosenberger (2025). Submarine canyon sediment transport and accumulation during sea level highstand: Interactive seasonal regimes in the head of Astoria Canyon, WA. Marine Geology, no. (2025): 107516. https://www.sciencedirect.com/science/article/pii/S0025322725000416.
Read More