Posts by Amber Stronk
Irminger Sea Carbon Cycle
The high-latitude North Atlantic, a region with high phytoplankton production in the spring and deep convection in the winter, is of particular importance for the global carbon cycle. The vertical transport of carbon from near the surface into the deep ocean, by combination of biological and physical processes, is known as the biological carbon pump. The carbon pump is particularly active in the Irminger Sea, yet the carbon budget, and its seasonal and interannual variability, are poorly known. A study by Yoder et al. (2024) used carbon system data from multiple observational assets (moorings and CTD casts) of the OOI Irminger Sea Array to assess net community production in the mixed layer and the implications for the biological pump in this region.
Data analysis was challenging, because it involved working with multiple instrument types, gappy records, calibration offsets, and other idiosyncrasies. In addition, data from multiple instruments and observing platforms needed to be combined to produce continuous records. The primary sensors utilized were pH and pCO2. These are difficult sensors to work with, to the extent that a community workshop was convened to develop a “users guide” to best practices for analysis (Palevsky et al., 2023). Yoder et al. were able to quality control, cross-calibrate, and merge data from the OOI surface mooring, flanking moorings, gliders and shipboard CTD casts (Fogaren and Palevsky 2023; Palevsky et al. 2023) to create the first multi‐year time series of the inorganic carbon system for the Irminger Sea mixed layer. This remarkable data set, based on instruments with sample rates of 1-2 hours, provides a seven-year record with near-daily resolution (Figure 28).
The time series results (Figure 3) showed that carbon system variables (dissolved inorganic carbon (DIC), total alkalinity (TA), and partial pressure of CO2 (pCO2)) co-vary through the annual cycle, with minimums in late summer at the end of the productive season and maximums in winter. The summer draw-down of pCO2 indicates that biophysical effects, rather than temperature, are the primary drivers of pCO2 variability. The influence of vertical mixing and primary productivity can be clearly seen in DIC and TA. In the subpolar North Atlantic, shoaling of the mixed layer in spring is generally associated with spring phytoplankton blooms, as indicated by increasing chlorophyll (Chl) concentration. Interestingly, it is found that highest integrated rates of DIC removal from the mixed layer via photosynthesis take place prior to mixed layer shoaling.
After a thorough analysis that included mixed layer budgets of DIC and TA, followed by assessment of gas exchange, physical transport, and the hydrologic cycle, the authors conclude that strong biological drawdown is the primary removal mechanism of inorganic carbon from the mixed layer. Furthermore, they point out the importance of interannual variability in both the drivers of and resulting magnitude of surface carbon cycling. This is primarily due to variability in net community production. Acknowledging the challenges taken on by OOI to maintain an array in the Irminger Sea, the authors note that “collecting observational data is both costly and challenging, however if only 1 year of data is collected or multiple years are averaged together, [carbon system dynamics] … will be misrepresented.”
This project shows the potential for OOI data, with appropriate processing and analysis, to provide unique insights into the ocean carbon system. It is notable that the authors made a substantial effort to calibrate and combine data from multiple instruments and moorings, and to take advantage of ancillary data (e.g. gliders, OOI CTD casts, and non-OOI CTD casts) in their processing. Enabling this type of analysis was a goal in the design of the multi-platform OOI Arrays and shipboard validation protocols.
[caption id="attachment_34983" align="alignnone" width="623"] Time series of dissolved inorganic carbon (DIC), total alkalinity (TA), partial pressure of CO2 (pCO2) temperature, chlorophyll-a (Chl), and mixed layer depth (MLD) in the Irminger Sea mixed layer from 2015-2022. Colors identify annual cycles. From Yoder et al., 2024.[/caption]
___________________
References:
- Fogaren, K. E., Palevsky, H. I. (2023) Bottle-calibrated dissolved oxygen profiles from yearly turn-around cruises for the Ocean Observations Initiative (OOI) Irminger Sea Array 2014 – 2022. Biological and Chemical Oceanography Data Management Office (BCO-DMO). Version Date 2023-07-19 doi:10.26008/1912/bco-dmo.904721.1
- Palevsky, H.I., S. Clayton and 23 co-authors, (2023).OOI Biogeochemical Sensor Data: Best Practices & User Guide Global Ocean Observing System, 1(1.1), 1–135. https://doi.org/10.25607/OBP-1865.2
- Palevsky, H. I., Fogaren, K. E., Nicholson, D. P., Yoder, M. (2023) Supplementary discrete sample measurements of dissolved oxygen, dissolved inorganic carbon, and total alkalinity from Ocean Observatories Initiative (OOI) cruises to the Irminger Sea Array 2018-2019. Biological and Chemical Oceanography Data Management Office (BCO-DMO). Version Date 2023-07-19 doi:10.26008/1912/bco-dmo.904722.1
- Yoder, M. F., Palevsky, H. I., & Fogaren, K. E. (2024). Net community production and inorganic carbon cycling in the central Irminger Sea. J. Geophys. Res., 129, e2024JC021027. https://doi.org/10.1029/2024JC021027
Impact of Ocean Model Resolution on Temperature Inversions in the Northeast Pacific Ocean
Temperature inversions are a local vertical minimum in temperature located at a shallower depth than a local maximum. In the Northeast Pacific, several water masses and multiple mechanisms for transforming or advecting ocean temperature (cold air events, upwelling, river discharge, cross-shelf eddy transport) create favorable conditions for temperature inversions. Modeling these temperature inversions is challenging. Osborne et al. (2023) analyze observations from 2020 and 2021 to characterize inversions in the Northeast Pacific. The data for these observations come largely from OOI Endurance Array gliders accessed through the GTS database. They compare the observed inversions to model results from the U.S. Navy’s Global Ocean Forecast System version 3.1 (GOFS 3.1) and two instances of the Navy Coastal Ocean Model. Temperature inversions are observed to be present in about 45% of profiles with temperature minimums between 50 – 150 m, temperature maximums between 75 – 175 m, and inversion thickness almost entirely less than 40 m. Modeled temperature inversions are present in only about 5% of model-observations comparisons, with weaker, shallower minimums. This is attributed to two primary causes: coarse model resolution at the inversion depth and the assimilation process which low-pass filters temperature, making inversions weaker. Osborn et al. identify additional work to test the impact of vertical grids on improving model performance.
[caption id="attachment_34977" align="alignnone" width="392"] Maps of inversion counts for observed profiles collected during 2020-2021 and analyzed in this work. Profiles have been filtered to be offshore of the 200 m isobath and to only one profile per collection platform per day (e.g., one profile per glider per day). Black line near the coast marks the 200 m isobath. Light gray indicates no profiles collected during the study period.[/caption]
___________________
References:
J. Osborne V, C. M. Amos and G. A. Jacobs, “Impact of Ocean Model Resolution on Temperature Inversions in the Northeast Pacific Ocean,” OCEANS 2023 – MTS/IEEE U.S. Gulf Coast, Biloxi, MS, USA, 2023, pp. 1-8, doi: 10.23919/OCEANS52994. 2023.10337390.
Read MoreNew Hints When Axial Might Erupt: Precursor Events Detected Through Machine Learning
A recent paper by Wang et al., “Volcanic precursor revealed by machine learning offers new eruption forecasting capability” [1] describes the characterization of time-dependent spectral features of earthquakes at Axial Seamount prior to the 2015 using unsupervised machine learning (this method applies algorithms to analyze data without humans in the loop). A major finding from this work is the identification of a distinct burst of mixed-frequency earthquake (MEF) signals that rapidly increased 15 hours prior to the start of the eruption, peaked one hour before lavas reached the seafloor, and earthquakes at Axial Seamount prior to the 2015 using unsupervised machine learning (this method applies algorithms to analyze data without humans in the loop). A major finding from this work is the identification of a distinct burst of mixed-frequency earthquake (MEF) signals that rapidly increased 15 hours prior to the start of the eruption, peaked one hour before lavas reached the seafloor, and migrated along pre-existing faults. The earthquakes are thought to reflect brittle failure driven by magma migration and/or degassing of volatiles. The source mantle beneath Axial Seamount contains extremely high CO2 concentrations leading to high concentrations in the melts [3,4]. MEFs were detected for months prior to the eruption, which could result from volatile release associated with inflation of the sills that feed Axial [5]. Importantly, the identification of these signals may help forecasting of the upcoming Axial eruption and may also be applied to other active volcanoes.
The authors utilized a wealth of geophysical data from the past decade to present an integrated view of Axial (Figure 1) including a subset of earthquake data 4 months prior to the eruption (67,767 out of their >240,000 earthquake catalogue from the RCA seismic array [2]), coupled with bottom pressure from BOTPT instruments at the Central Caldera and Eastern Caldera sites, and 3D modeling.
[caption id="attachment_34973" align="alignnone" width="640"]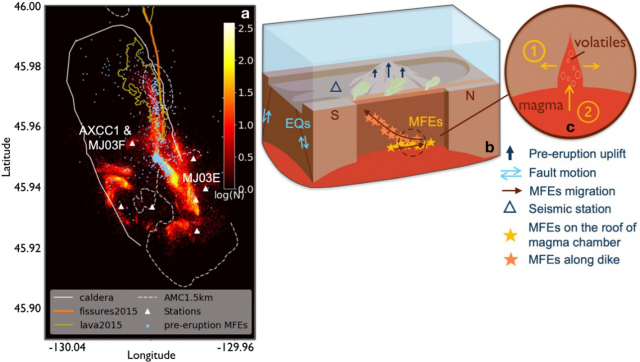 After Wang et al., 2024 [1] Figures 1 and 4: a) Heatmap of earthquake density at Axial Seamount from Nov 2014 to Dec 2021 [2]. Image highlights mixed‐frequency earthquakes (MFEs – light blue dots) one day before the eruption, the caldera rim (white solid line), the 1.5 km depth contour of the Axial magma chamber (AMC)(dashed white line), eruptive fissures (orange lines), lava flows of the 2015 eruption (yellow lines), the location of the RCA short-period seismometer array (white triangles),broadband seismometer AXCC1 and bottom pressure tilt instruments (MJ03E and MJ03F. Heatmap shows the number of earthquakes in each 25 m × 25 m bins. b) Cartoon summarizing observations. Tidally‐driven earthquakes occur on caldera ring faults, while the MFEs track movement of volatiles and magma prior to the eruption. c) possible mechanisms of the MFEs. ① and ② correspond to crack opening and volatile/magma influx processes.[/caption]___________________
References:
[1] Wang, K., F. Waldhouser, M. Tolstoy, D. Schaff, T. Sawi, W.S.D. Wilcock, and Y.J. Tan (2024) Volcanic precursor revealed by machine learning offers new eruption forecasting capability. Geophyiscal Research Letters, 51 (19) https://doi.org/10.1029/2024GL108631.
[2] Wang, K., F. Waldhouser, D.P. Schaff, M. Tolstoy, W.S.D. Wilcock, and Y.J. Tan (2024) Real-time detection of volcanic unrest and eruption at Axial Seamount using machine learning. Seismological Research Letters, 95, 2651–2662, doi: 10.1785/0220240086.
[3] Helo, C., M.-A. Longpre, N. Shimizu, D.A. Clague and J. Stix. (2011) Explosive eruptions at mid-ocean ridges driven by CO2-rich magmas. Nature Geoscience. 4, 260–263 (2011). https://doi.org/10.1038/ngeo1104.
[4] Dixon, J. E., E. Stolper, E., and J.R. Delaney (1988). Infrared spectroscopic measurements of CO2 and H2O in Juan de Fuca Ridge basaltic glasses. Earth and Planetary Science Letters, 90(1), 87–104. https://doi.org/10.1016/0012‐821x(88)90114‐8.
Read MoreOOI-CGSN Team Completes First Standalone AUV Cruise at Pioneer MAB Array
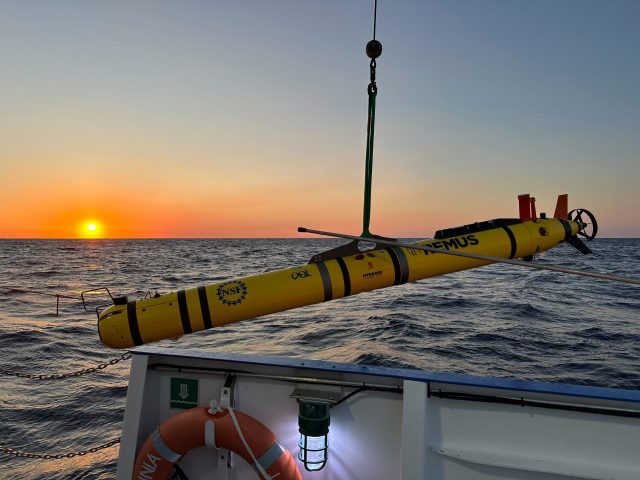
The Ocean Observatories Initiative’s (OOI) Coastal and Global Scale Nodes (CGSN) team recently conducted their first standalone small vessel Autonomous Underwater Vehicle (AUV) cruise at the Pioneer Mid-Atlantic Bight (MAB) Array. Aboard the R/V Virginia, team members Andy Robinson, Collin Dobson, and Dan Bogorff successfully completed dock testing of their launch and recovery systems before heading offshore to carry out AUV transects through the array.
The mission utilized two REMUS600 AUVs, equipped with a variety of scientific instruments, including CTDs (conductivity, temperature, depth), fluorometers, dissolved oxygen sensors, nitrate sensors, photosynthetically active radiation (PAR) sensors, and ADCPs (acoustic doppler current profilers). These tools provide essential data for understanding ocean conditions and biogeochemical processes at the Pioneer MAB array.
This accomplishment highlights the OOI-CGSN team’s dedication to advancing autonomous AUV ocean exploration and data-driven research.
[gallery size="full" ids="34951,34952,34953,34954,34955,34956"](c): Collin Dobson
Read MoreUpcoming OOI SUGR Meeting Focused on Advancing Ocean Carbon Research
The Ocean Observatories Initiative (OOI) is hosting a Scientific User Group for Research (SUGR) meeting just before the AGU conference in Washington, D.C. on Sunday, December 8th from 11am-2pm ET. This meeting will serve as a platform for both current and potential users of OOI and other datasets to collaborate on research efforts aimed at improving our understanding of the Carbon Cycle.
The SUGR meeting will feature key presentations on ocean carbon science and data quality, followed by a discussion on updating the GOOS-Endorsed Best Practices document to incorporate the latest scientific advancements. Attendees will also see a demonstration of the OOI data explorer, highlighting its role in improving data quality assessments and research. Additionally, the meeting will invite input on potential new sensors to enhance OOI’s infrastructure, further supporting biogeochemical research.
This is an excellent opportunity to collaborate, share experiences, and learn more about how OOI data contributes to carbon cycle research.
The meeting will last for three hours and include a lunch break, with boxed lunches provided for in-person attendees. If you’re interested in attending, please contact Amber Coogan, OOI’s Community Engagement Manager, at amber.coogan@whoi.edu, and indicate whether you’d prefer to attend in person or virtually.
Note: AGU registration is not required to participate in the SUGR meeting.
Read MoreA Forum for OOI’s Imaging FlowCytobot (IFCB) Community
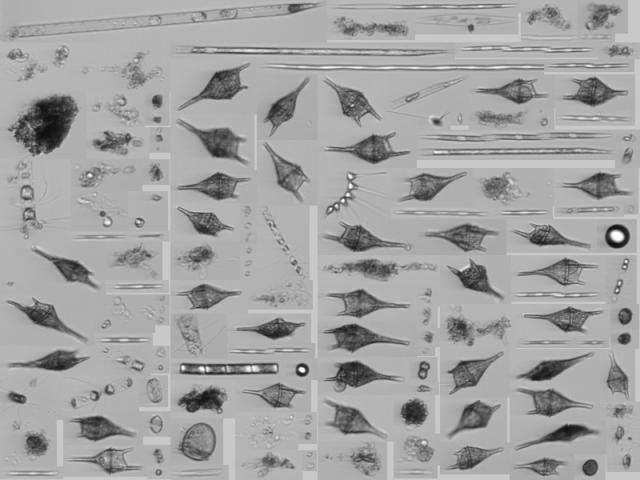
The OOIFB Pioneer Mid-Atlantic Bight (MAB) Array Community Workshop brought together scientists, resource managers, educators, and other interested parties to learn about the capabilities of the newly relocated Pioneer Array. The workshop generated interest in new instrumentation, including plankton imaging with an Imaging FlowCytobot (IFCB) on the Pioneer Central Surface Mooring. Potential users were looking for ways to ask questions, share results, and provide a community of practice for OOI’s IFCB data. One recommendation was for OOI to provide an online forum. This was recently implemented on OOI’s community forum on Discourse.
The forum, called “IFCB Community” can be accessed on Discourse, linked from OOI’s Data HelpDesk webpage. Within Discourse, “IFCB Community” can be found from the drop down menu under “categories”. The newest topics appear first by default. To access a topic in the forum, simply click on the topic. You need to log in (with a free account) to comment on or add a new topic. OOI welcomes the use of this new forum as a place for the community of OOI IFCB Data users to share methods and results, troubleshoot data issues, and create a dialogue with colleagues.
Read MoreOpen Call for Applications: OOI Facility Board
The U.S. National Science Foundation (NSF) Ocean Observatories Initiative Facility Board (OOIFB) is tasked with representing the science community and users of the NSF Ocean Observatories Initiative (OOI) Facility. The OOIFB works to expand scientific and public awareness of OOI, and ensure that the oceanographic community is kept informed of developments of NSF OOI.
The OOIFB is soliciting applications to fill one membership position that will open as of November 30, 2024. The selected individual will fill one term that will run through November 30, 2027, and then be eligible to serve an additional 3-year term.
Scientists, spanning water column to seafloor expertise, as well as experimentalists, engineers, and modelers, with experience using scientific observing systems, such as the NSF OOI, are encouraged to apply. Familiarity/expertise with Station Papa, the Irminger Sea Array, and/or the Regional Cabled Array are preferred, although not required. All interested applicants will be considered.
The OOIFB holds at least one in-person meeting per year and one web conference each month. The responsibilities of the OOIFB may include, but are not limited to, the following:
- Serving as the prime scientific and technical conduit between the oceanographic community and NSF regarding OOI.
- Examining the accomplishments and work flow of the NSF OOI Operator, in order to provide feedback regarding the NSF OOI Annual Work Plans (AWPs).
- Via workshops, community meetings, and/or other mechanisms, stimulate and engage the user community in order to keep the accomplishments of the NSF OOI at the cutting edge of scientific inquiry and technological innovation.
- Developing and implementing strategies to expand scientific and public awareness of the unique scientific and technological opportunities of the NSF OOI.
- Helping to identify collaborative relationships with potential governmental, industrial, educational, and international partners in the NSF OOI, where appropriate.
- Ensure fair and consistent access to the NSF OOI by all sectors of the user community.
Applications should be submitted to Holly Morin, at the OOIFB Administrative Support Office (holly@ooifb.org), and must include a letter of interest and a CV. The statement of interest should highlight the applicant’s experience using observatory data and have fostered an environment of respect in their research endeavors.
Please note, applications cannot be accepted from individuals affiliated with the NSF OOI Program Facility institutions (Woods Hole Oceanographic Institution, Oregon State University, and the University of Washington), individuals under contract with the NSF OOI Program, and individuals from institutions already represented on the OOIFB (the current list of OOIFB members is available HERE).
Applications are due by November 18, 2024. Applications will be reviewed by the OOIFB, who will give due consideration to the qualifications of applicants, as well as the maintenance of gender, career level, discipline, and regional balance on the OOIFB. For more information about OOIFB and its activities, please visit the website, http://ooifb.org, or contact Dax Soule, OOIFB Chair (Dax.Soule@qc.cuny.edu).
Read MoreOOI Supports Scientific Collaboration at UCAR Annual Meeting
The Ocean Observatories Initiative (OOI) participated in the University Corporation for Atmospheric Research (UCAR) meeting held on October 8-9, 2024 in Boulder, CO. This annual gathering serves as an important platform for collaboration among leading atmospheric and oceanographic research institutions.
At the meeting, OOI Principal Investigator and Senior Scientist Jim Edson discussed with attendees the latest advancements in ocean data collection, spotlighting the role of OOI’s data in critical climate research. He was given the opportunity to describe the OOI and some of the enabled science to a several labs at the National Center for Atmospheric Research (NCAR). These included presentations to members of NCAR’s Climate & Global Dynamics Lab (Ocean Section); Earth Observing Lab; Mesoscale & Microscale Meteorology; Atmospheric Chemistry Observations & Modeling Lab. Jim highlighted efforts to deploy advanced sensors in previously under-sampled areas, such as the Irminger Sea and Gulf of Alaska, addressing major data gaps in these regions. These efforts are essential for gaining a deeper understanding of ocean-atmosphere interactions.
We expect to follow up these meetings with NCAR at the AGU and/or AMS meetings in December and January, respectively. OOI’s partnership with UCAR highlights a shared commitment to integrated climate monitoring. By providing high-quality, real-time ocean data, OOI enables scientists to improve climate models, enhance forecasting precision, and support policy decisions aimed at environmental sustainability.
[caption id="attachment_34970" align="alignnone" width="640"]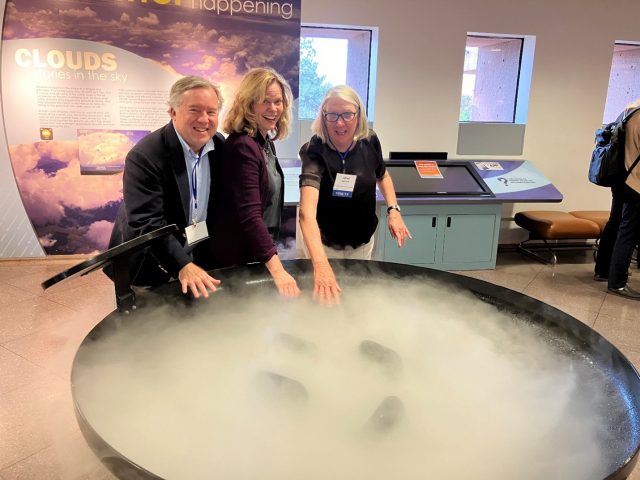 Jim Edson, Carol Anne Clayson (WHOI) and Janet Sprintall (SIO) check out the Cloud Display at the NCAR Mesa Laboratory during the UCAR Reception.[/caption]
Read More
 UG2 Workshop ’24: A Collaborative Hub for Underwater Glider Innovation
The UG2 Workshop ’24, held from September 10-12 on the University of Michigan campus, brought together leading researchers, industry professionals, and practitioners to advance the capabilities and collaborative efforts of the underwater glider community. National Science Foundation Ocean Observatories Initiative (OOI) attendees included Ed Dever, Principal Investigator of the Northeast Pacific Endurance Array (EA), Peter Brickley, Senior Engineer with the Coastal and Global Scale Nodes (CGSN), and EA glider lead Stuart Pearce and glider tech Jonathan Whitefield. Over the course of three days, OOI participants contributed to in-depth discussions on data management, operational best practices, and emerging technologies, laying the foundation for future advancements in ocean monitoring and glider operations.
Workshop Goals and Objectives
The primary objective of UG2 is to foster a cohesive community that promotes the sharing of glider mission resources within the U.S. and internationally. The 2024 Workshop aimed to:
- Harmonize Glider Efforts: Improve data management and foster partnerships while documenting best practices to enhance collaboration.
- Share New Developments: Highlight recent advancements in sensors, glider technologies, and novel applications.
- Refine Operational Activities: Enhance strategies for sustained ocean observations and explore the impact of glider data on ocean modeling.
- Identify Action Items and Needs: Address communication gaps and improve UG2’s communication platforms for the future.
- Network with Glider Users: Facilitate interactions among U.S. and international glider users to strengthen partnerships.
Key Highlights
The workshop featured several interactive components that fostered deep engagement and collaborative dialogue:
- Liesl Hotaling’s Plenary Talk and Breakout Session: Liesl Hotaling’s plenary talk and subsequent breakout session focused on developing microcredentials for ocean technology professionals. This initiative aims to address workforce needs by creating stackable credentials that recognize core competencies. Her session, co-led with Josh Kohut, invited attendees to discuss the application of these credentials in building capacity for glider maintenance and piloting.
- Data Management Sessions (Day 2): A significant portion of Day 2 was dedicated to addressing challenges in glider data management. Facilitators Jennifer Bowers, Leila Baghdad-Brahim, and Jennifer Sevadjian led discussions on best practices for data collection, registration, and sharing. The sessions provided valuable insights into the U.S. IOOS National Glider Data Assembly Center (DAC) and efforts to standardize glider data handling, ensuring efficient management of multidimensional data. All OOI glider data are routinely reported to the DAC using code developed by Stuart Pearce and others.
- Sustained National Glider Network Session (Day 2): Daniel Rudnick and J. Xavier Prochaska facilitated this session, which emphasized the importance of a sustained glider-based observation network within the Global Ocean Observing System (GOOS). Participants explored the feasibility of creating a coordinated network that integrates coastal and basin-scale observations, building on previous efforts by the Ocean Gliders Boundary Ocean Observing Network (BOON). The OOI’s Endurance Array lines are part of the BOON along the US Pacific coast.
- Poster Presentations: The poster sessions showcased a wide range of research and operational insights. OOI contributed two posters.
- Stuart Pearce et al. presented a poster on “OOI In-Air Oxygen Calibration Adjustments and Improved Oxygen Sensor Mount,” highlighting advancements in sensor calibration for improved accuracy.
- Peter Brickley et al. showcased “OOI Glider Operations in the Mid-Atlantic Bight,” detailing operational strategies and findings from extensive glider deployments in this dynamic region.
Outcomes and Next Steps
The workshop successfully facilitated deep engagement and collaboration, resulting in several key outcomes:
- Enhanced Data Management Practices: The data management sessions provided a comprehensive overview of current challenges and future directions, including early-stage data federation efforts aimed at harmonizing international standards.
- Support for a Sustained Glider Network: The discussions around a national glider network laid the groundwork for future collaboration, emphasizing the need for long-term, high-resolution coastal and deep ocean observations.
- Advancements in Professional Training: The workshop underscored the importance of developing innovative, stackable educational opportunities to build capacity in the blue economy. These efforts aim to enhance workforce skills and provide diverse learning pathways for individuals seeking careers in ocean technology.
[caption id="attachment_34904" align="alignnone" width="640"]
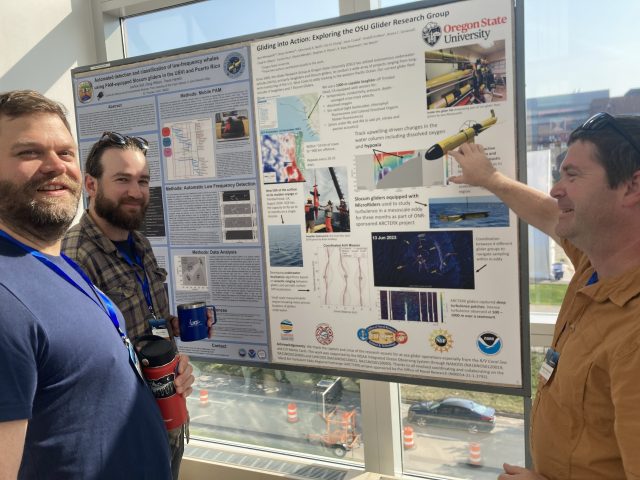 Stuart Pearce (OSU Endurance, left), Brian VerWey (OSU research glider group, center), and Jonathan Whitefield (OSU Endurance, right) pose during discussions around Brian’s poster.[/caption]
Read More
 Irminger Sea Wind Speed Validation
The Irminger Sea in the North Atlantic is a stormy, windy place. Consequently, it is an area of interest for studying the flux balance of heat, momentum, and biogeochemically important gasses such as CO2. The Ocean Observatories Initiative (OOI) deploys meteorological instruments in the Irminger Sea, as part of the OOI Global Irminger Sea Array, to collect in-situ observations in this relatively undersampled region. The goal is to deliver high-quality, long-term observations to the ocean science community to study these, and many more, questions of interest.
Validating these measurements is an important part of delivering quality data to the ocean science community. This summer, rising senior at California State University – Monterey Bay Aaron Wickware took on the challenge of validating OOI wind measurements in the Irminger Sea. Aaron was a Woods Hole Partnership in Education Program (PEP) scholar. PEP is a program designed primarily for college juniors and seniors from underrepresented groups who want to spend a summer gaining practical experience in marine and environmental science. The program consists of an accredited course in global climate change and a ten-week research project.
At Aaron’s disposal were six different sensors: a Gill Windobserver II two-axis sonic anemometer, R.M. Young Wind Monitor propeller-driven anemometer, and a Gill R3 three-axis sonic anemometer integrated into the direct flux covariance instrument (FDCHP) on the recently deployed Irminger Sea surface mooring; a Gill Windobserver II on the surface mooring to be recovered; and the two Vaisala sonic anemometers located on the ship’s mast. Aaron downloaded all the data, identified the overlapping time periods, calculated the wind speeds from the u-and-v-vector components, adjusted the speeds to a common-height using a community standard bulk flux algorithm (COARE 3.5), and took the 1-hour averages. His resulting comparison demonstrated that the two Gill two-axis sonic anemometers under-reported wind at speeds greater than 8 m/s. His workflow and analysis code are accessible on his GitHub page at https://github.com/Aaron-Wickware/ooicgsn-wind-validation.
Aaron’s results are part of a broader OOI Data Team investigation into the accuracy of buoy-based sonic anemometer wind measurements. This work is being followed up by similar sensor cross-comparisons at other mooring arrays. The results will be incorporated into a report to facilitate the use of data from the OOI-deployed buoy-based anemometers.
[caption id="attachment_34892" align="alignnone" width="493"] Figure 1. Comparison of hourly-averaged wind speeds with standard deviations from the six available wind sensors all operating at the same time at the OOI Global Irminger Sea Array.[/caption]
Read More
