
Posts by ooistaff
Chlorophyll Enhancement at the Shelfbreak
Adapted and condensed by OOI from Oliver et al., 2022, doi:/10.1029/2021JC017715.
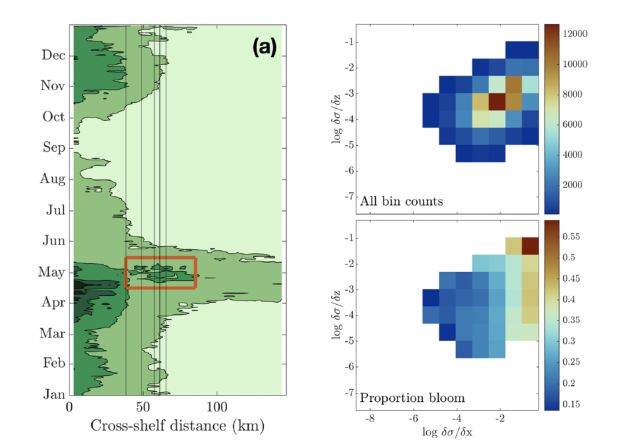
[media-caption path="/wp-content/uploads/2022/08/Screen-Shot-2022-08-18-at-3.10.51-PM.png" link="#"](left) Eighteen-year composite annual cycle of surface chlorophyll concentration from MODIS satellite. Vertical lines indicate the shelfbfreak region (depths 75 to 1,000 m); red box highlights chlorophyll enhancement at the shelfbreak. (right; upper) OOI glider data with more than 100 chlorophyll observations within horizontal and vertical density gradient bins and (lower) proportion of bins with chlorophyll > 2 mg/L, indicating a bloom. From Oliver et al., 2022.[/media-caption]The enhancement of chlorophyll due to phytoplankton blooms is recognized to occur near the frontal boundary of the New England Shelf, but the blooms are ephemeral and not consistently found in satellite remote sensing of ocean color. In a recent study, Oliver et al., (2021) show that enhanced surface chlorophyll concentrations at the shelfbreak are short lived events, and are associated with periods when a surface layer of lighter shelf water moves over denser slope water at the shelfbreak front. Both data and a computational model show that eastward, upwelling-favorable winds are the primary driver of the frontal restratification and localized enhanced surface chlorophyll.
The study used a variety of data sources, including MODIS satellite chlorophyll estimates, shipboard CTD casts from a Shelf-break Productivity Interdisciplinary Research Operation at the Pioneer Array (SPIROPA) cruise and a Pioneer mooring turn cruise, Pioneer glider density and chlorophyll, and atmospheric reanalysis winds after comparison with Pioneer surface mooring winds. A two-dimensional configuration of the Regional Ocean Model System (ROMS) coupled to a nitrogen-phytoplankton-zooplankton-detritus (NPZD) model was used to simulate the wind-driven response.
The eighteen-year time-evolution of the cross-shelf distribution of surface chlorophyll concentration from MODIS showed that shelf-break chlorophyll enhancements were evident in most years, followed an inshore spring bloom in April, and were typically seen during a short period in the spring (mid-April – mid-May; Figure above). For individual years, the shelf-break chlorophyll enhancements were short-lived, typically lasting less than a week. Pioneer Array glider data were used to explore the relationship between enhanced chlorophyll concentrations and both horizontal (assumed to be associated with the shelfbreak front) and vertical density gradients. Near surface (upper 30 m) chlorophyll concentrations were collected in log-transformed density gradient bins and then displayed according to the proportion of bins with chlorophyll > 2 mg/L, indicating a bloom. The “bloom bins” were associated with high horizontal density gradients and a range of vertical density gradients, indicating that frontal restratification is associated with enhanced chlorophyll at the shelfbreak (Figure above).
The study concludes that enhanced surface chlorophyll events at the New England shelfbreak occur consistently in the spring, but are transient, lasting only a few days to a week, and thus not discernible in seasonal climatologies. Periods of enhanced chlorophyll are associated with strong horizontal density gradients and appear to be triggered by the increase in stratification resulting from wind-driven cross-shelf advection of less dense shelf water over denser slope water. This process creates a shallow mixed layer at the front which alleviates light limitation and supports transient surface enhancements of chlorophyll.
Oliver, H., Zhang, W.G., Archibald, K.M., Hirzel, A.J., Smith, W.O. Jr, Sosik, H.M., Stanley, R.H.F and D.J. McGillicuddy Jr (2022). Ephemeral surface chlorophyll enhancement at the New England shelf break driven by Ekman restratification. Journal of Geophysical Research: Oceans, 127, e2021JC017715. https://doi.org/10.1029/2021JC017715.
Read More45 Days of Discovery: RCA’s 8th O&M Expedition
The Regional Cabled Array (RCA) team left port in Newport, Oregon on August 5 aboard the global class research ship the R/V Thomas G. Thompson for a 45-day expedition. This is the eighth operations and maintenance cruise to the array, a network of 900 kilometers of electro-optical cables that crosses a tectonic plate and powers sensors on the seafloor and in the water column, including instrumented profiling platforms on moorings.
The expedition is such a complex operation that it will be conducted in five legs, with the ship returning to Newport to offload recovered equipment and load new and refurbished equipment for a subsequent leg. A scientific and engineering team of 26 from the University of Washington will be joined by an engineering team of 8 that will operate the remotely operated vehicle ROPOS, owned by the Canadian Scientific Submersible Facility. These groups will be joined by 28 students from the University of Washington, participating in the at-sea-experiential learning program, VISIONS, which provides undergraduate students opportunities to conduct research at sea using advanced oceanographic research instruments.
[media-caption path="/wp-content/uploads/2022/08/Thompson-leaving-dock.-FZqU5VxUYAAWUie-scaled.jpeg" link="#"]The R/V Thompson as it left the dock in Newport and headed towards the OOI Slope Base site for the first dive of this 45-day expedition. Credit: NSF-OOI/UW/V22.[/media-caption]There will be a live feed video for the duration of the expedition. “During the cruise, website visitors will be able to directly observe parts of the seafloor rarely seen by humans, including the most active submarine volcano off our coast ‘Axial Seamount’ located ~300 miles offshore and nearly a mile beneath the oceans’ surface,” said Deb Kelley, principal investigator of the RCA. “ Visitors will be able to witness one of the most extreme environments on Earth – underwater 700°F hot springs teaming with life that thrive on volcanic gases and that live in the complete darkness of the deep sea. The team will also visit the Cascadia Margin, spending time at Southern Hydrate Ridge where methane ice deposits are sometimes exposed on the seafloor. This hummocky, sediment-rich environment hosts a large number of areas where methane gas seeps from the seafloor feeding dense microbial mats that also host large clams. ROPOS will also visit shallower sites that are some of the most biologically productive areas in the world’s ocean.”
The 45-day expedition required an immense logistics operation with ~20 trucks transporting >130,000 lbs. of gear to Newport. During the cruise, the ROV will deploy and recovery a diverse array of >200 instruments, several small seafloor substations that provide power and communications to instruments on the seafloor and on moorings that span depths of 2900 m (9500 ft) to 80 m (260 ft) beneath the oceans’ surface. In addition, several novel, externally funded instruments developed by scientists in the US and Germany will be installed.
Follow along as the journey unfolds: Live video feed. Student Blog. Expedition updates.
Read More
Using Aircraft Expertise for Underwater Operations
Regional Cabled Array (RCA) Engineer Eric McRae came to the RCA Team with a 20+ year background keeping aircraft in the air, cars on the road, and medical devices safe. McRae worked on a Head-Up display and skid control and braking systems on some large commercial aircraft that are flying now. He also worked on a popular pacemaker/defibrillator for a medical instrument company. As a result of this experience, and long-term work in automotive engine control, McRae brought with him a mindset about correct behavior of control software to the RCA. He simply will not accept anything that is misbehaving. In the past, people’s lives were at stake, now it’s possible interruption of data collection or loss of scientific equipment.
McRae adopted his approach to help design and keep operational the Shallow Profilers on the RCA moorings which must work correctly for a year at a time in the cold, dynamic, and sometimes hostile, waters of the Pacific Ocean. The Shallow Profiler houses 10 scientific instruments and includes a winch that pays out power and communication cable allowing the science pod to rise through the water column to a depth below the surface determined by currents and wave conditions.
“I think that the Cabled Array Team is successful because many of us came from industries where it was not acceptable to produce something that could fail,” McRae explained. “We use this same mindset to figure out ways to make things work and keep them working even under the most difficult of circumstances.”
[media-caption path="/wp-content/uploads/2022/07/eric-selfie.png" link="#"]RCA Engineer Eric McRae stands with the components of one of the RCA Shallow Profilers that he programmed to successfully move up and down the water column in the Pacific since 2014. Photo: McRae.[/media-caption]From his first days at the RCA, Gary Harkins, his boss at the time, told McRae that his job was to make sure the Shallow Profiler was safe. “Safety was the top priority — not science, or anything else. Once we were sure the profiler could be operated safely, we could accomplish whatever the science mission wanted.” Initially, McRae worked with Dr. Doug Luther and Dr. Kendra Daly to understand how the science team wanted the profiler to run. Once he understood the science requirements, he worked with RCA’s mechanical designers to understand how they wanted to design the mechanical aspects of the system.
McRae then used his experience to influence the design and created a viable electronic control system that supports communications that keep the winch running and its science pod node traveling up towards the surface and back down nine times a day. A winched cable provides continuous power and communications to the science pod, allowing science and engineering data to flow to shore in real time. The mechanical design and control system have kept the Shallow Profiler operational since its launch in 2014.
[embed]https://vimeo.com/733359478[/embed]The control system continually “talks” to the winch and science pod to assess movement through the water. Near the bottom, the science pod doesn’t move very much, except for an occasional tilt caused by currents. As it gets close to the surface, however, surface waves can have a huge impact on how the profiler moves and how much tension is on the cable. The science pod weighs ~900 pounds in air so when it gets moving back and forth underneath waves, it could significantly stress the cable. To prevent this from happening, the science pod “reports” three times a second to the control system about the conditions it is experiencing. These reports include acceleration, rotation, proximity to the surface, wave length, and a slew of other variables so that needed adjustments can be made automatically to keep the winch and ultimately its valuable science pod “safe.” If conditions warrant, the control system has the capability of aborting a running profile and/or parking the science pod near the mooring to wait things out.
The Shallow Profiler is often on the move. Each of the nine daily profiles take between one and a half to two and a half hours, depending on the profile type and ocean conditions. There’s a gap of about 30 to 45 minutes between profiles, where the science pod is parked down near the mooring platform. During that time, the controller is constantly monitoring the waves on the surface. McRae developed an algorithm to look at the worst-case peak to trough wave pressure so that when the profiler starts up for a run towards the surface, it has already calculated what it thinks the worst wave height combination will be. The original requirements of the system were that the science pod can go no closer to the surface than five meters or three wave heights, whichever is greater, so when it starts up, it already knows the ceiling for the coming profile.
“As designed, the profiler is smarter than we are. It makes seven decisions three times a second to ensure that it is on the right path and has accounted for all predictable conditions” McRae said.
Of course, there are other hazards besides ocean conditions. In September of 2017, a trawler’s net hit the mooring line at the Oregon Offshore site and eventually the mooring platform itself, pulling the 14,000-pound mooring and its two huge anchors from the seafloor. The profiler was running at the time and recorded the action until the boat pulled hard enough that the seafloor cable came unplugged. There has also been a smattering of mechanical issues, but the system has matured nicely. Should something unexpected go wrong in the future, McRae has programmed the profiler to take “evasive” action, then notify him and his team on land. This performance record demonstrates that not only did McRae’s work help keep the profiler safe, it helped make it a reliable component of the RCA that scans through the water with ease. The three profilers have made >40,000 profiles since 2015, making unprecedented measurements of ocean parameters.
Read More
Despite Weather, Irminger 9 Met Objectives
The R/V Neil Armstrong departed Woods Hole, Mass., on June 20. Under the direction of Chief Scientist Sheri N. White of Woods Hole Oceanographic Institution (WHOI), the 14-member science party headed to OOI’s Global Irminger Sea Array for the ninth time to recover and deploy moorings and gliders and carry out scientific sampling. Nearly a month later, the ship and science party pulled into the port of Reykjavik, Iceland, on July 16th, having accomplished all of its objectives.
“The Irminger Sea can be a challenging environment to work in. Storms with high winds and seas regularly move through the area, and these conditions can limit our mooring recovery and deployment operations,” said Chief Scientist Sheri N. White. “We were lucky to have relatively good weather conditions during our cruise, and adjusted our schedule when needed when storms passed through. Thanks to an excellent team – the ship’s crew and shipboard science technicians, the mooring operations team, and OOI and OSNAP teams – we able to accomplish all of our goals. My huge thanks to everyone on the ship and all of our shore-side support for all of their efforts.”
In addition to ten OOI personnel, the team was rounded out by three members from OSNAP (Overturning in the Subpolar North Atlantic Program) and a marine mammal observer from the National Oceanic and Atmospheric Administration.
For OOI, the team successfully recovered and deployed a Surface Mooring, Hybrid Profiler Mooring, and two Flanking Moorings, and deployed two new Irminger Sea gliders. For OSNAP, the team recovered and deployed four new moorings, replacing those originally deployed in the Summer 2020. The team also conducted CTD casts with salinity, oxygen, carbon, nutrient and chlorophyll water sampling. These sampling measurements are used for instrument validation and to further characterize the region of the moored array.
Why the Irminger Sea?
The Global Irminger Sea Array is off the southeast tip of Greenland, close to 39°W, 60°N. Data from this location are improving understanding of the impact of natural and climate variability in the region. The location experiences strong air-sea interaction and wintertime water mass formation that supports the global thermohaline (a.k.a. meridional overturning circulation – MOC). In recent years, a freshening of the water column has been observed.
The combination of the moored array and the gliders in the Irminger Sea enables investigation into the role of ocean processes at mesoscale and sub-mesoscale horizontal length scales through observations that sample the full water column, from the sea floor to the sea surface. The Surface Mooring provides a unique time-history of observations of surface meteorology and air-sea fluxes.
A Look at Life at Sea
The following and in the sidebar to the right is an assortment of activities onboard the Armstrong during the month of July. Other images and stories can be found here.
[media-caption path="/wp-content/uploads/2022/07/Pete_bow.jpeg" link="#"]Whale sightings: Marine mammal observer Peter Duley spent many hours on deck looking for marine mammals. He observed Humpback, Beaked, Sei, and Fin whales, as well as orcas, harbor porpoise and common dolphins. Credit: Sheri N. White © WHOI.[/media-caption] [media-caption path="/wp-content/uploads/2022/07/pilot-whales_sm-2048x1365-1.jpeg" link="#"]Pod came to visit: A pod of pilot whales on a foggy day in the Irminger Sea. Credit: Peter Duley, NOAA.[/media-caption] [media-caption path="/wp-content/uploads/2022/07/Glider_DSC_0381.jpeg" link="#"]Glider missions: Gliders have two missions at the Irminger Sea Array. They travel around the triangular array to collect data (temperature, salinity, fluorescence and dissolved oxygen) in between the moorings. And, they pass the data from the subsurface mooring to shore. When they come to the surface, they send their data and the subsurface mooring data back to shore via satellite. Credit: Sawyer Newman©WHOI.[/media-caption] Read MoreSubmit an Abstract to OOI’s Session at AGU
 OOI is hosting a session at the Fall 2022 AGU Meeting in Chicago entitled: OS019. Process Studies, Educational Activities and Technological Advancements Using Data and Infrastructure from the Ocean Observatories Initiative (OOI). All are encouraged to submit an abstract to share your innovative research, technology, and educational approaches that use OOI data.
Below are submission details:
Session Title: OS019. Process Studies, Educational Activities and Technological Advancements Using Data and Infrastructure from the Ocean Observatories Initiative (OOI)
Direct Link to Session: https://agu.confex.com/agu/fm22/prelim.cgi/Session/161994
Abstract Submission Deadline: Wednesday, 3 August 2022 at 23:59 EDT
Session Abstract:
The NSF’s Ocean Observatories Initiative (OOI) is an integrated network that enables scientific investigation of interlinked biogeochemical and physical processes throughout the global ocean. We invite presentations that investigate all aspects of ocean observatory science using data and infrastructure (physical and cyber) from the OOI and related observing systems. The OOI is comprised of coastal and global arrays that support surface moorings, bottom landers, profilers and gliders; as well as a regional cabled array that spans the seafloor and water column with cabled moorings and seafloor nodes. The OOI data delivery and QC systems have been continuously improved with input from the user community. The OOI data already provide decade long time series with broad spatial coverage that enables investigations of marine processes, event detection, and climate assessment. We particularly encourage new and innovative research and educational approaches that rely on ocean observatory systems with an emphasis on the OOI.
Session Co-chairs:
James Edson, Edward Dever, Deborah Kelley, Albert Plueddemann, Anthony Koppers
Read MoreMeasurements Below the Surface
Strong winds and large waves in remote ocean locations don’t deter the Ocean Observatories Initiative (OOI) from collecting measurements in spite of such extreme conditions. By moving the moorings below the surface, the OOI is able to secure critically important observations at sites such as the Global Station Papa Array in the Gulf of Alaska, and the Global Irminger Sea Array, south of Greenland. These subsurface moorings avoid the wind and survive the waves, making it possible to collect data from remote ocean regions year-round, providing insights into these important hard-to-reach regions.
Instrumentation on the surface mooring in the Irminger Sea, however, has nowhere to hide and the measurements they provide are also often crucial for investigations, such as net heat flux estimates. Providing continuous information about wind and waves remains one of the most challenging aspects of OOI’s buoy deployments in the Irminger Sea. Fortunately, with each deployment, OOI is improving the survivability of the surface mooring so they continue to add to the valuable data collected in the region by their subsurface counterparts.
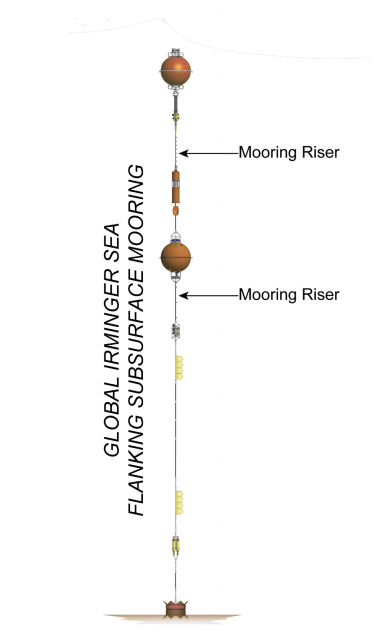
[media-caption path="/wp-content/uploads/2022/07/FLMB-9_DSC_0934.jpg" link="#"]The top sphere of a Flanking Mooring being deployed through the R/V Neil Armstrong’s A-Frame. Credit: Sawyer Newman©WHOI.[/media-caption]Below the surface in the Irminger Sea
A team of 15 OOI scientists and engineers spent the month of July in the Irminger Sea aboard the R/V Neil Armstrong, recovering and deploying three subsurface moorings there, along with other array components. The Irminger Sea is one of the windiest places in the global ocean and one of few places on Earth with deep-water formation that feeds the large-scale thermohaline circulation. Taking measurements in this area is critical to better understanding changes occurring in the ocean.
OOI’s Irminger Sea Array also provides data to an international sampling effort called OSNAP (Overturning in the Subpolar North Atlantic) that runs across the Labrador Sea (south of Greenland), to the Irminger and Iceland Basins, to the Rockall Trough, west of Wales. The OOI subsurface Flanking Moorings form a part of the OSNAP cross-basin mooring line with additional instruments in the lower water column. During this current expedition, the Irminger Team will be recovering and deploying OSNAP instruments that are included as part of the OOI Flanking moorings, in addition to turning several OSNAP moorings as well.
[media-caption path="/wp-content/uploads/2022/07/FLMB-9_DSC_0941.jpg" link="#"]The Flanking Mooring top float in the water during deployment. The sensors mounted in the sphere will measure conductivity, temperature, fluorescence, dissolved oxygen and pH at 30 m depth. Credit: Sawyer Newman©WHOI.[/media-caption]The triangular array of moorings in the Irminger Sea provide data that resolve horizontal variability, how much the physical aspects of the water (temperature, density, currents) and its chemical properties (salinity, pH, oxygen content) change over the distance between moorings. The individual moorings resolve vertical variability – the change in properties with depth. Three of these moorings are entirely underwater, with no buoy on the surface. They do have, however, multiple components that are buoyant to keep the moorings upright in the water column.
[media-caption path="/wp-content/uploads/2022/07/FLMB-9_DSC_0984.jpg" link="#"]The mid-water sphere holds an ADCP instrument which will measure a profile of water currents from 500 m depth to the sea surface. Photo Credit: Sawyer Newman©WHOI.[/media-caption]Each subsurface mooring has a top sphere at 30 m depth, a mid-water sphere at 500 m depth, and back-up buoyancy at the bottom to ensure that the mooring can be recovered if any of the other buoyant components fail. Instruments are mounted to the mooring wire to make measurements throughout the water column.
[media-caption path="/wp-content/uploads/2022/07/FLMB-9_IMG_5328.jpg" link="#"]Glass balls in protective “hard hats” provide extra flotation at the bottom of the mooring. Their tennis ball yellow color looks almost fluorescent in the brief (and much enjoyed) sunshine. Photo Credit: Sheri N. White©WHOI.[/media-caption] Read MoreBGC Workshop Cooks Up a Recipe for Collaborative Research
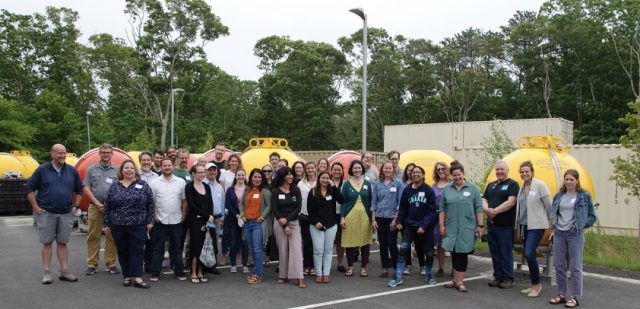
Thirty-six researchers from 19 institutions from five countries converged on the Woods Hole Oceanographic Institution for three days (June 16-18) to participate in a workshop designed to enhance the use of data from biogeochemical (BGC) sensors on Ocean Observatories Initiative arrays. A product of the workshop will be the “OOI Biogeochemical Sensor Best Practices and User Guide” designed to standardize the use of BGC sensor measurements and promote best practices in their research application.
In summer 2021 the NSF-funded OOI Biogeochemical Sensor Data Working Group was established to develop guidelines and best practices for using OOI biogeochemical sensor data to broaden users and applications of these data, and build community capacity to produce analysis-ready data products. The Working Group convened regular virtual meetings beginning with a three-day virtual workshop in July 2021. Members developed a draft best practices guide with explicit recommendations for end users working with data from four sensor sub-groups: dissolved oxygen, inorganic carbon parameters, bio-optics, and nitrate. The five chapters of the best practices guide cover background on the OOI arrays and the biogeochemical sensors deployed on them, data QA/QC and data access, and each of the four sensor sub-groups listed above.
Current and prospective OOI biogeochemical sensor data users gathered together with the Working Group members at the June workshop to review and discuss the best practices guide and to explore scientific questions that can be explored with these data. The discussions were lively and productive. Small breakout groups discussed scientific research ideas using OOI biogeochemical sensor data, with the hope that these discussions would kickstart research collaborations, and help inform a planned follow-on peer-reviewed publication (e.g. a Frontiers in Ocean Observing article) to present the exciting science that OOI biogeochemical data and the best practices guide will enable. The second goal of the workshop was to solicit the revisions and edits needed to finalize the best practices guide in advance of dissemination to the wider community through Ocean Best Practices.
The workshop was a huge success. Said participant Michael Vardaro from the University of Washington and a member of the OOI Regional Cabled Array Data Team, “It was a great workshop. I hope we and NSF can inspire other interested early career scientists to organize more workshops like this. They ask hard questions, which ultimately will make the program better!”
Over the past year Sophie Clayton, Old Dominion University, Hilary Palevsky, Boston College, and Heather Benway, Woods Hole Oceanographic Institution have facilitated the Biogeochemical Working Sensor Data Group meetings and preparation of the best practices guide.
“We’ve spent the past year working with a great group of early career and experienced researchers on developing best practices for maximizing the use of biogeochemical data from OOI sensors, “ said Sophie Clayton.
“The workshop gave us all a great opportunity to meet in person and discuss a wide range of exciting research ideas that the OOI BGC data will enable. We were also so pleased to connect and see how much new progress we made in just three days thanks to being all in the same place together,” added Hilary Palevsky.
[media-caption path="/wp-content/uploads/2022/06/BGC-Workhshop.jpeg" link="#"]Participants at the end of a three-day Biogeochemical Sensor Workshop held at Woods Hole Oceanographic Institution June 17-19, 2022. Photo: Mai Maheigan ©WHOI.[/media-caption]The working group members are: Annie Bourbonnais, (University of South Carolina), Susan Hartman (National Oceanography Centre), Hilde Oliver (WHOI), Kristen Fogaren (Boston College), Merrie Beth Neely, (Global Science and Technology – embedded contractor at NOAA), Filipa Carvalho (National Oceanography Centre), Andrew Reed (OOI – CGSN), Isabela Le Bras (WHOI), Alison Chase (University of Washington – Applied Physics Laboratory), Cara Manning (University of Connecticut), Rob Fatland (University of Washington), Ellen Briggs (University of Hawaii at Manoa), Christina Schallenberg (University of Tasmania), Ian Walsh (Freelance Researcher), Jennifer Batryn (WHOI), Christopher Wingard (Ocean Observatories Initiative Endurance Array), Jonathan Fram (Oregon State University (OOI)), Roman Battisti (University of Washington/NOAA PMEL), Dariia Aamanchuk (Dalhousie University), Jennie Rheuban (WHOI), Rachel Eveleth (Oberlin College) and Joseph Needoba (Oregon Health & Science University).
The additional participants who reviewed the draft Best Practices and User Guide and attended the workshop are: Kohen Bauer (Ocean Networks Canada – University of Victoria), Baoshan Chen (Stony Brook University), Jose Cuevas (Boston College), Susana Flecha (Spanish National Research Council), Micah Horwith (Washington State Department of Ecology), Melissa Melendez (University of Hawaii at Manoa), Tyler Menz (Stony Brook University), Al Plueddemann (WHOI/OOI), Sara Rivero-Calle (University of Georgia), Nick Roden (Norwegian Institute for Water Research), Pablo Nicolás Trucco-Pignata (University of Southampton – National Oceanography Centre), Michael Vardaro (University of Washington, OOI), and Meg Yoder Boston College.
Read MoreRecap of Successful NE Pacific Workshop
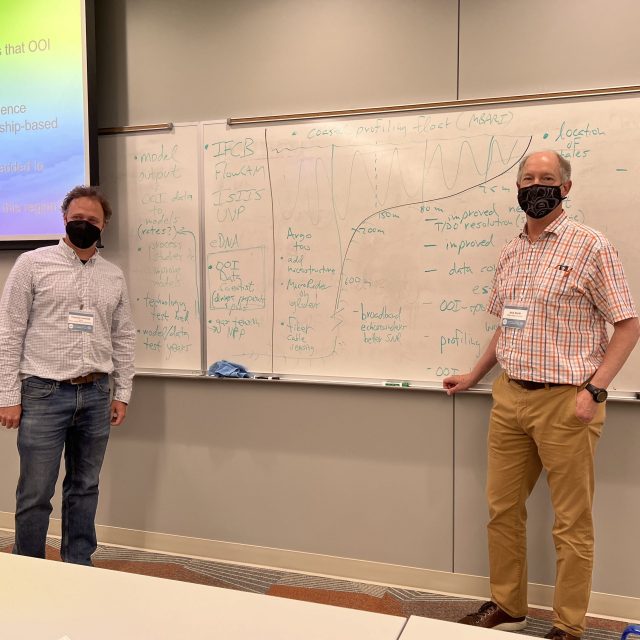
The Ocean Observatories Initiative Facility (OOIFB) hosted a well-attended three-day workshop (June 7-9), followed by an optional Q&A data workshop on June 10. The workshop explored research opportunities using OOI data and its infrastructure to advance understanding of ocean processes in the NE Pacific. More than 100 people attended the workshop, 70 in-person, in the first such event in two years, and 30 virtual participants.
[media-caption path="/wp-content/uploads/2022/06/20220607_105055-2-scaled.jpg" link="#"]The workshop consisted of a mix of plenaries, breakout groups, posters, and many informal, productive discussions about how to maximize use of OOI data. Photo: Abby Ernest-Beck, URI.[/media-caption]
“Not only was it exciting to be with colleagues after all of this time,” said Kendra Daly, chair of the OOIFB, “the number of new ideas discussed on how to expand use of OOI data and extend partnerships with other observatories in the region was truly invigorating. The workshop laid the groundwork for new ways in which to use OOI data to explore research questions relevant to the NE Pacific.”
The three-day event alternated between plenaries on topics such as the “Warm Blob,” preparing for the next eruption at Axial Seamount, and how OOI data are used in modeling efforts and in the classroom. Lively breakout group sessions covered topics ranging from how to access OOI data, to major scientific questions, to research aimed at specific geographic regions, to potential broader impact initiatives.
The workshop was funded by the National Science Foundation.
For those who missed the workshop, all presentations and posters are available online here. Recordings of the workshop will be available online in the coming weeks.
Read MoreMonth-long Expedition to Refresh Irminger Sea Array
In late June, a team of 15 scientists and engineers headed to the Irminger Sea, a region with high wind and large surface waves in the North Atlantic. This remote ocean region is one of the few places on Earth with deep-water formation that feeds the large-scale thermohaline circulation.
[media-caption path="/wp-content/uploads/2022/06/IMG_5251.jpg" link="#"]The R/V Neil Armstrong is loaded with Irminger Sea gear, ready to depart fo a month-long expedition to recover and deploy OOI’s Global Irminger Sea Array. Photo: Sheri N. White©WHOI.[/media-caption]
The Irminger Sea 9 expedition is taking place on the R/V Neil Armstrong, operated by the Woods Hole Oceanographic Institution (WHOI). After an eight-day transit to the mooring array site off the tip of Greenland, the team will recover and deploy four moorings and three gliders over the next two and a half weeks. They will conduct CTD (conductivity, temperature, and depth) casts at the deployment/recovery sites and carry out shipboard sampling for field validation of the platforms and sensors that will remain in the water for the next year.
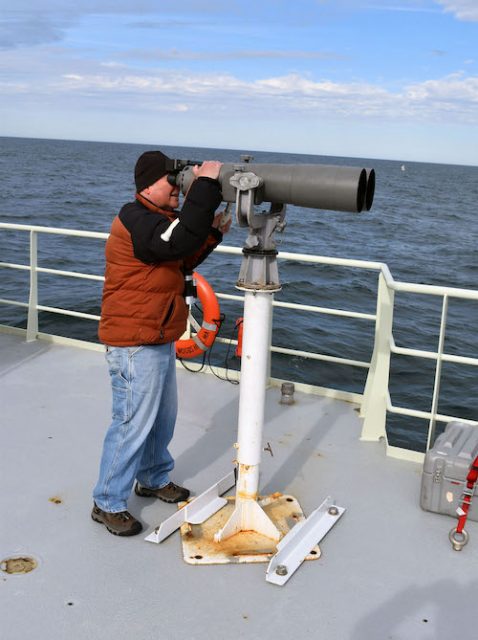
In addition to the Ocean Observatories Initiative’s (OOI) operations, a team from OSNAP (Overturning in the Subpolar North Atlantic Program) also will be onboard to recover and deploy four moorings, conduct CTD casts and water sampling at the mooring sites, and conduct additional instrument field validation tests to ensure the quality of the data collected. A participant from the National Oceanic and Atmospheric Administration will also be on board using Big Eyes binoculars mounted on a forward deck to make observations of marine mammals during the transit and in the Irminger Sea.
[media-caption path="/wp-content/uploads/2022/06/big_eyes.jpg" link="#"]Large, deck-mounted binoculars known as “big eyes” are used for marine mammal observations. NOAA Research Wildlife Biologist Peter Duley will be onboard the R/V Neil Armstrong watching for marine life in the Irminger Sea. Photo: Al Plueddemann ©WHOI.[/media-caption]
“Measurements in this remote ocean region are critical to increasing understanding of changes occurring in the ocean,” said Al Plueddemann, head of the OOI Coastal and Global Scale Nodes, which operates the OOI Global Irminger Sea Array. “It’s great to have a collaborative effort with OSNAP in this important area and an opportunity to learn more about marine life during this month-long expedition.”
Read MoreTrina Litchendorf: A Wealth of Sea-going and Engineering Experience
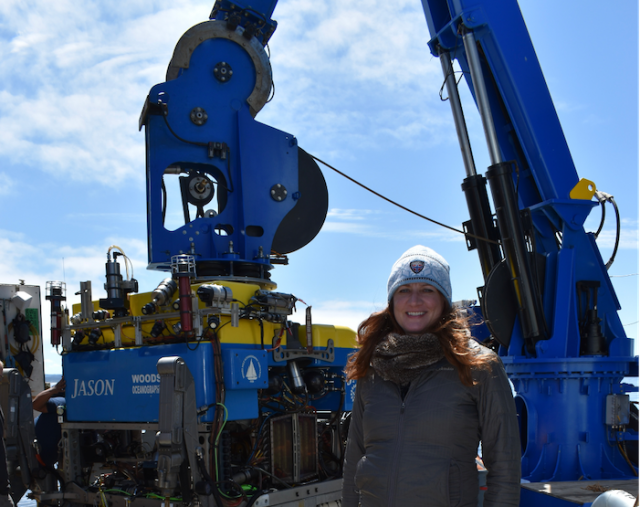
Trina Litchendorf is a highly experienced member of the Regional Cabled Array (RCA) team with a wealth of sea-going and engineering experience. She’s been with the Applied Physics Laboratory (APL) at the University of Washington (UW) since 2001. She started there as an intern through a NASA sponsorship, and stayed on while getting a degree in chemical oceanography at the UW. After graduation, she remained at APL, where she has been involved in keeping ocean observing instrumentation operational ever since. She has been working specifically on RCA instruments since 2013. She was onboard for the first deployment of cabled array instrumentation in 2014, and has served as a key part of every annual expedition since.
[media-caption path="/wp-content/uploads/2022/06/Trina-1.png" link="#"]Trina Litchendorf in front of the ROVJason. Credit: University of Washington.[/media-caption]
Trina’s duties at APL and for the RCA vary by the season. During the spring and early summer, she is actively engaged in testing and building RCA components so that they are ready for the annual Operations and Maintenance cruise. These cruises usually take place in August when undergraduate students join RCA team members at sea as part of the VISIONS at-sea experiential learning program to recover and deploy the infrastructure and instruments that the cable powers.
Each instrument undergoes three rounds of testing. The first is in the winter after the recovered instruments have been refurbished. Each is put through a rigorous round of testing, with a 12-page document of things to check. These procedures cover everything from checking for ground faults to prevent instruments from shorting out in saltwater, to placing them in a large salt water tank to simulate deployment conditions to ensure they work under such conditions. The instruments are also put through a pressure test to simulate seafloor conditions, followed by full functionality testing.
The second and third tests happen directly before the annual cruise and prior to deployment. “The second test is an integration test in the lab. We attach the instruments on the platforms on which they will be deployed to make sure that we can communicate with them and operate them through the platform. Once this test is complete, we are ready for the third, which happens onboard the ship during the annual expedition.” Onboard, she conducts a final test, connecting to the platform again to make sure all the instruments are working before anything goes into the water. She also is ready with spare and replacement parts should anything go awry during this final test.
During the expedition, Trina also directs remotely operated vehicle (ROV) dives, which serves as the eyes, ears, and hands of the underwater operation. She sits in the “hot seat” next to the ROV pilot where she directs activities on the seafloor and in the water column. The pilot manipulates the ROV to execute myriad complex operations she directs. Every platform is a little different so it is necessary to follow a prescribed dive plan to make sure every task is completed in the order in which it is supposed to happen. The complexity of these dives makes for some long days. “Typical dives run anywhere from 3-12 hours or more, and I usually end up pulling one or two 24-hour days while I’m at sea.”
“We have to get all of our gear on the seafloor plugged in and operational and last year’s gear up and off the seafloor,” Trina explained. “We have so much equipment that there’s not enough deck space for all of it, so we break the cruises up into multiple legs to load the next batch of equipment and offload the recovered gear. As a result, these cruises last anywhere from five to six or more weeks.” She’s currently getting ready to depart on VISIONS 22 in August, which because of its scope, is six weeks long and will be conducted in five legs.
Once recovered, another of her jobs is to photograph the platform and instruments’ condition, before helping with clean up, scraping of sea life that has colonized instruments and platforms, and removing a years-worth of additional biofouling.
[media-caption path="/wp-content/uploads/2022/06/students_20190622_171924_working.jpg.jpg" link="#"]Chris Williams, an undergraduate student at UW, helps to clean off a bioacoustics sonar package heavily covered with barnacles and anemones. Credit: UW/VISIONS’19/NSF/OOI.[/media-caption]
In the fall, after the cruise is over, Trina’s responsibilities turn to refurbishment and readying the instruments their next deployment. This, too, is a big job. There are close to 150 instruments deployed on more than 30 different types of platforms. The platforms range from junction boxes on the seafloor that serve as power sources for many instruments to benthic experimental packages with their own suite of instruments to shallow and deep-water profilers that move instruments up and down through the water column to sample at various depths. Her task is to ensure that recovered instruments are cleaned, taken apart, and refurbished. Most of the instruments are sent off to vendors for refurbishment and recalibration. The ultimate objective is to ensure that all of the instruments are working and that high quality data are being streamed from the RCA for community use.
The winter, into spring is spent testing and putting the platforms and instruments back together again in preparation for the upcoming cruise as the cycle begins again.
Trina’s favorite part of her job is her time at sea, particularly the time she spends in the control van with the ROV team. There she also runs the science camera, which gives her an inside look into a world few others have the opportunity to see. “I’m seeing things that most people only get to see on the Discovery Channel or National Geographic. It really is a great privilege to be part of that.”
And, she sees the cabled array as a vision realized. “I remember Dr. John Delaney telling us (during one of her undergraduate oceanography classes) about this idea he had to put a large cable in the water to power multiple seafloor sensors to study the ocean and that the whole paradigm of how oceanographic research was conducted was going to change. He saw it as moving from the old model of going out to sea on research vessels for just a few weeks at a time to collect data, to having a 24/7 365–day presence on the seafloor and throughout the water column streaming data in real time to scientists all over the world. And here I am now, actually doing this work and helping this science happen. It’s amazing,” she concluded.
Read More