
Posts by ooistaff
A Case Study for Open Data Collaboration
Recognizing that freely accessible ocean observatory data has the potential to democratize interdisciplinary science for early career researchers, Levine et al. (2020) set out to demonstrate this capability using the Ocean Observatories Initiative. Publicly available data from the OOI Pioneer Array moorings were used, and members of the OOI Early Career Scientist Community of Practice (OOI-ECS) collaborated in the study.
A case study was constructed to evaluate the impact of strong surface forcing events on surface and subsurface oceanographic conditions over the New England Shelf. Data from meteorological sensors on the Pioneer surface moorings, along with data from interdisciplinary sensors on the Pioneer profiler moorings, were used. Strong surface forcing was defined by anomalously low sea level pressure – less than three times the standard deviation of data from May 2015 – August 2018. Twenty-eight events were identified in the full record. Eight events in 2018 were selected for further analysis, and two of those were reported in the study (Figure 24).
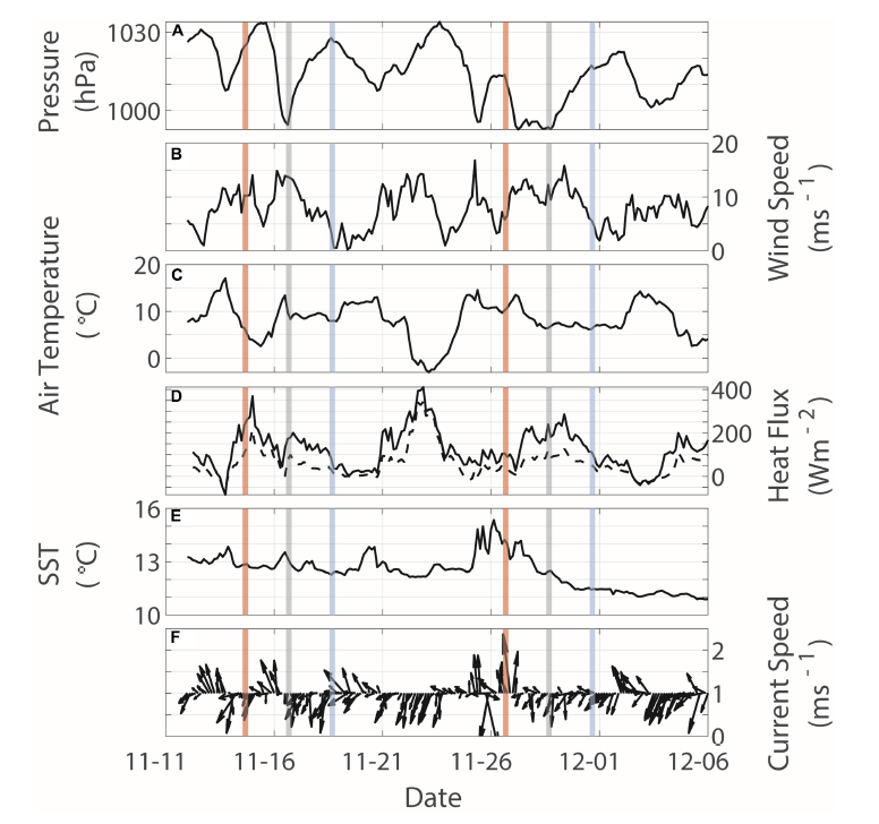
[media-caption path="https://oceanobservatories.org/wp-content/uploads/2021/07/CGSN-Highlight.png" link="#"]Figure 24. Two surface forcing events (16 and 27 November) identified from the time series of surface forcing at the Pioneer Central surface mooring. Vertical lines indicate the peak of the anomalous low-pressure events (gray), as well as times 48 h before (red) and after (blue). (A) sea level pressure, (B) wind speed, (C) air temperature, (D) latent (solid) and sensible (dashed) heat fluxes, (E) sea surface temperature, and (F) surface current speed and direction. [/media-caption]The impact of surface forcing on subsurface conditions was evaluated using profile data near local noon on the day of the event, as well as 48 hr before and after (Figure 24). Subsurface data revealed a shallow (40-60 m) salinity intrusion prior to the 16 November event, which dissipated during the event, presumably by vertical mixing and concurrent with increases in dissolved oxygen and decreases in colored dissolved organic matter (CDOM). At the onset of the 27 November event, nearly constant temperature, salinity, dissolved oxygen and CDOM to depths of 60 m were seen, suggesting strong vertical mixing. Data from multiple moorings allowed the investigators to determine that the response to the first event was spatially variable, with indications of slope water of Gulf Stream origin impinging on the shelf. The response to the second event was more spatially-uniform, and was influenced by the advection of colder, fresher and more oxygenated water from the north.
The authors note that the case study shows the potential to address various interdisciplinary oceanographic processes, including across- and along- shelf dynamics, biochemical interactions, and air-sea interactions resulting from strong storms. They also note that long-term coastal datasets with multidisciplinary observations are relatively few, so that the Pioneer Array data allows hypothesis-driven research into topics such as the climatology of the shelfbreak region, seasonal variability of Gulf Stream meanders and warm-core rings, the influence of extreme events on shelf biogeochemical response, and the influence of a warming climate on shelf exchange.
In the context of the OOI-ECS, the authors note that the study was successfully completed using open-source data across institutional and geographic boundaries, within a resource-limited environment. Interpretation of results required multiple subject matter experts in different disciplines, and the OOI-ECS was seen as well-suited to “team science” using an integrative, collaborative and interdisciplinary approach.
______________________________________________________________________________________________
Levine, RM, KE Fogaren, JE Rudzin, CJ Russoniello, DC Soule, and JM Whitaker (2020) Open Data, Collaborative Working Platforms, and Interdisciplinary Collaboration: Building an Early Career Scientist Community of Practice to Leverage Ocean Observatories Initiative Data to Address Critical Questions in Marine Science. Front. Mar. Sci. 7:593512. doi: 10.3389/fmars.2020.593512.
Read MoreSummer at Sea: Three Arrays Turned
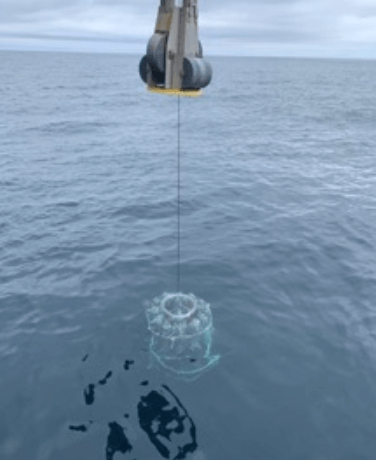
This summer has been a busy time for OOI’s teams, who are actively engaged in ensuring that OOI’s arrays continue to provide data 24/7. Teams are turning – recovering and deploying – three arrays during July and August. The first expedition occurred earlier in July when a scientific and engineering team spent 16 days in the Northeast Pacific recovering and deploying ocean observing equipment at the Global Station Papa Array. The team recovered three subsurface moorings and deployed three new ones. They also deployed one open ocean glider, recovered one profiling glider, and conducted 11 CTD casts (which measure conductivity, temperature, and depth) to calibrate and validate the instruments on the array. After completing this eighth turn of the Station Papa Array, the team returned to Woods Hole Oceanographic Institution by way of Seward, Alaska on the second of August.
[embed]https://vimeo.com/580883575[/embed]On 30 July, the Regional Cabled Array team embarked on the first of four legs of its 37-day Operations and Maintenance Cruise aboard the R/V Thomas G. Thompson. The ship, operated by the University of Washington, is hosting the remotely operated vehicle (ROV) Jason, operated by Woods Hole Oceanographic Institution (WHOI). During the cruise, Jason will be used to deploy and recover a diverse array of more than 200 instruments from the active Pacific seafloor. The science, engineering, and ROV teams will be joined this year by 19 students sailing as part of the University of Washington’s educational mission (VISIONS’21). A live video feed of the ship’s operations and Jason dives is available for the duration of the cruises.
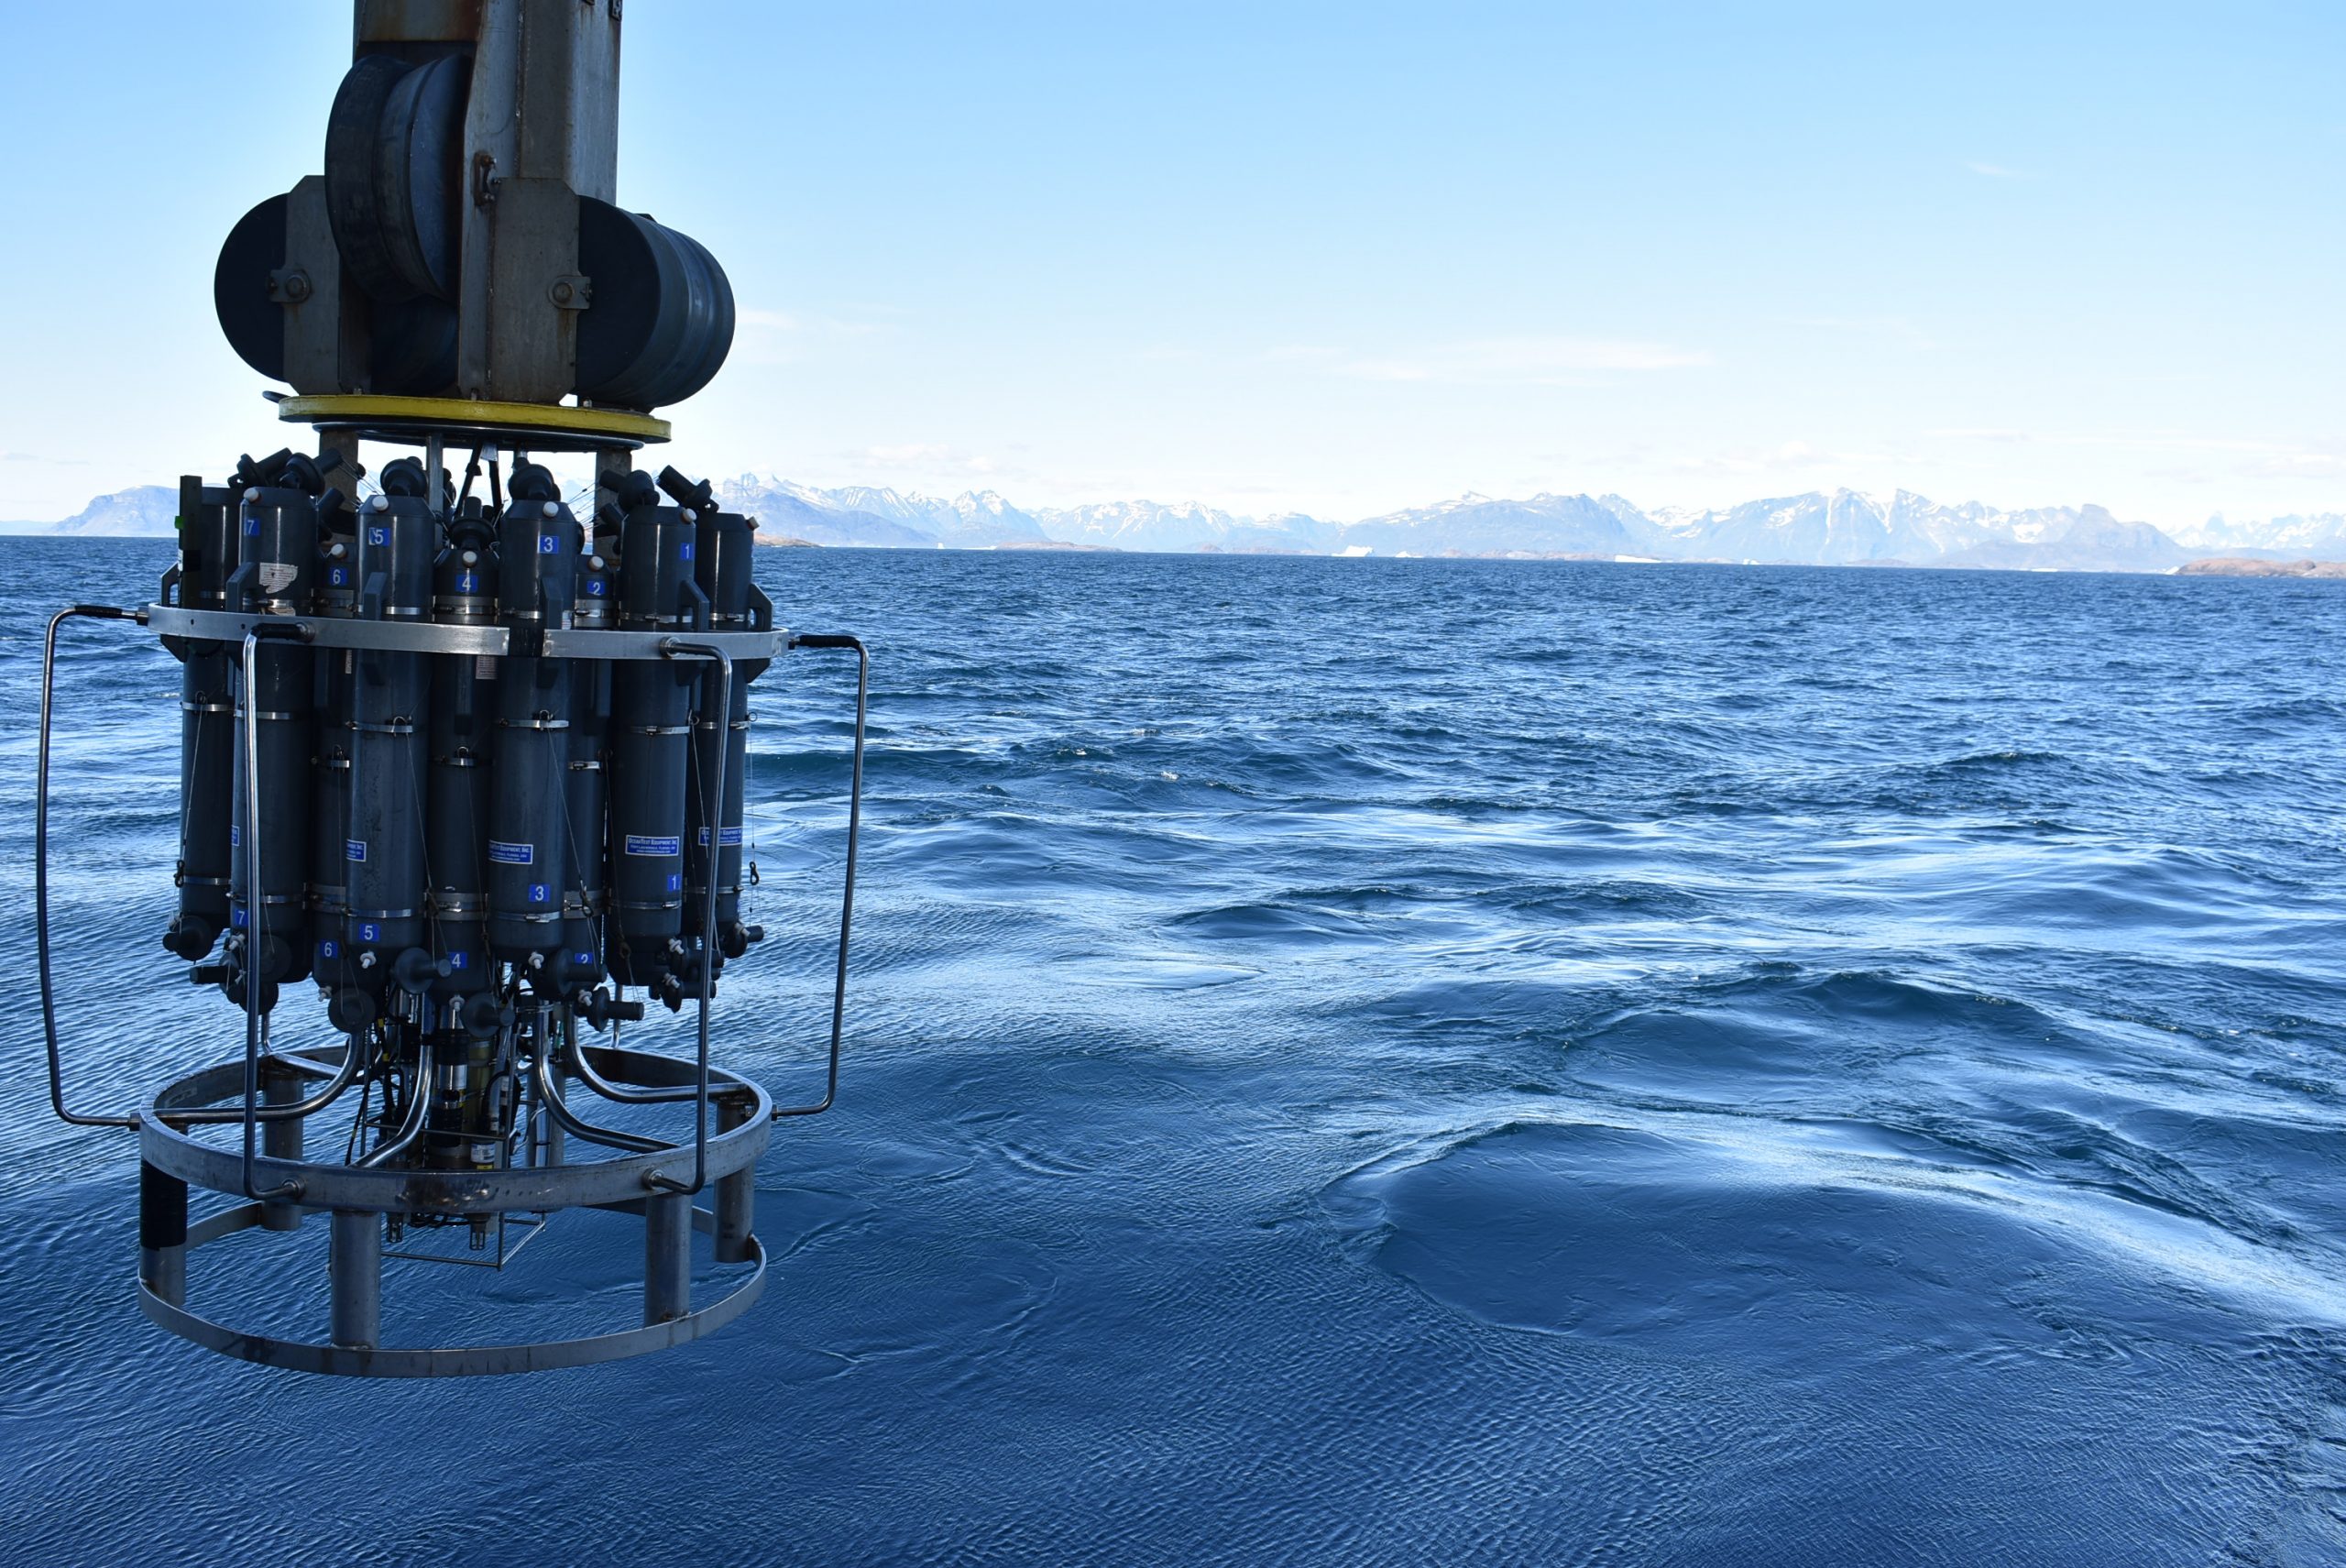
[media-caption path="https://oceanobservatories.org/wp-content/uploads/2021/07/r1472_elguapo.top_.web_-768x511-1.jpg" link="#"]The Regional Cabled Array team expects to share imagery as spectacular as this during its upcoming cruise. Shown here is the El Guapo hot spring, covered in life venting boiling fluids 4500 feet beneath the oceans surface. Credit: UW/NSF-OOI/CSSF; V11.[/media-caption]On 3 August, a team from WHOI boarded the R/V Armstrong for a weeklong transit to recover and deploy the Global Irminger Sea Array, off the Southeast coast of Greenland. The array is located in one of the most important ocean regions in the northern hemisphere and provides data for scientists to better understand ocean convection and circulation, which have significant climate implications. A science and engineering team will be deploying and recovering a global surface mooring, a global hybrid profiler mooring, two global flanking moorings, and three gliders (two open ocean and one profiling) during the three-week expedition. The team will also carry out shipboard sampling and CTD casts to support the calibration and validation of platform sensors while underway. A novel aspect of this cruise is that near real-time CTD profiles will be made publicly available during the cruise. The profiles will be evaluated by onshore staff, who will provide feedback to the ship, and share online assessment of CTD results.
“This summer’s at-sea activities are the culmination of months of planning, testing, and logistical work that goes on behind the scenes to make these expeditions possible,” said John Trowbridge, OOI’s Principal Investigator and head of the Program Management Office. “A tremendous amount of human effort and ingenuity is required to keep the arrays operational year-round, particularly in some of the ocean’s most challenging environments like the Irminger Sea and on the seafloor at Axial Seamount. The data collected, however, are essential, providing scientists with the tools needed to understand our changing ocean.”
The progress of the expeditions will be reported on these pages and on OOI’s social media channels.
[media-caption path="https://oceanobservatories.org/wp-content/uploads/2021/07/Irminger-Surface-mooring-.jpg" link="#"]A global surface mooring in the Woods Hole Oceanographic Institution stage area is outfitted and ready for deployment in the Irminger Sea Array. Photo: ©Jade Lin, WHOI[/media-caption]
Read More
Oregon Sea Grant Spotlights Partner OOI
In its August 2021 newsletter, Oregon Sea Grant highlights the work of OOI’s Endurance Array Team at Oregon State University. Sea Grant Scholar Charlotte Klein interviewed the Endurance Array Principal Investigator Ed Dever, who describes some of challenges in keeping arrays operational in a challenging offshore environment.
The article can be found here, on page four.
Read MoreRecommended CTD Resources
Hydrographer Leah McRaven (PO WHOI) from the US OSNAP team provided the following CTD resources to help researchers and others better how she and the Irminger Sea Array team are working with the near real-time data being provided by CTD sampling from the R/V Neil Armstrong:
There are four main sources considered in this list:
- Seabird Electronics is one of the most commonly used manufacturers of shipboard CTD systems. Their CTDs allow for integration of instruments from several other manufactures.
- The Global Ocean Ship-Based Hydrographic Investigations Program (GO-SHIP) provides decadal resolution of the changes in inventories of heat, freshwater, carbon, oxygen, nutrients and transient tracers, with global measurements of the highest required accuracy to detect these changes. Their program has documented several methods and practices that are critical to high-accuracy hydrography, which are relevant to many CTD data users.
- The California Cooperative Oceanic Fisheries Investigations (CalCOFI) are a unique partnership of the California Department of Fish & Wildlife, NOAA Fisheries Service and Scripps Institution of Oceanography. CalCOFI conducts quarterly cruises off southern & central California, collecting a suite of hydrographic and biological data on station and underway. CalCOFI has made great effort to document methods that are helpful to those collecting hydrographic measurements near coastal regions.
- University-National Oceanographic Laboratory System (UNOLS) is an organization of 58 academic institutions and National Laboratories involved in oceanographic research and joined for the purpose of coordinating oceanographic ships’ schedules and research facilities.
Instrument care and use
Seabird training module on how sensor care and calibrations impact data: https://www.seabird.com/cms-portals/seabird_com/cms/documents/training/Module9_GettingHighestAccuracyData.pdf
Data acquisition and processing
Notes on CTD/O2 Data Acquisition and Processing Using Seabird Hardware and Software: https://www.go-ship.org/Manual/McTaggart_et_al_CTD.pdf
CalCOFI Seabird processing: https://calcofi.org/about-calcofi/methods/119-ctd-methods/330-ctd-data-processing-protocol.html
Seabird CTD processing training material: https://www.seabird.com/training-materials-download
Within this material, discussion on dynamic errors and how to address them in data processing: https://www.seabird.com/cms-portals/seabird_com/cms/documents/training/Module11_AdvancedDataProcessing.pdf
General overview documents and resources
GOSHIP hydrography manual: https://www.go-ship.org/HydroMan.html
CalCOFI CTD general practices: https://www.calcofi.org/references/methods/64-ctd-general-practices.html
UNOLS site https://www.unols.org/documents/water-column-sampling-and-instrumentation?page=2 )
Read More
OOI Facility Board Opening: Apply by Aug 15
The Ocean Observatories Initiative Facility Board (OOIFB) provides independent input and guidance regarding the management and operation of the National Science Foundation-funded Ocean Observatories Initiative (OOI). The OOIFB works to expand scientific and public awareness of the OOI, and ensure that the oceanographic community is kept informed of developments of the OOI.
The OOIFB is soliciting applications to fill one open membership position. The appointment will fill the remainder of an unexpired term and will be effective starting in September 2021 and run through June 2023. The selected individual will be eligible to serve a second term of 3-years. The OOIFB holds at least one in-person meeting per year and one web conference each month.
Scientists with experience using scientific observing systems, such as the OOI, are encouraged to apply. In an effort to maintain the expertise and disciplinary depth on the committee, we are particularly interested in applicants with research experience using data from the OOI Global Arrays. However, all interested applicants will be considered.
The responsibilities of the OOIFB may include, but are not limited to, the following:
- Serving as the prime scientific and technical conduit between the oceanographic community and NSF regarding OOI.
- Examining the accomplishments and work flow of the OOI Operator, in order to provide feedback regarding the OOI Annual Work Plans (AWPs).
- Via workshops, community meetings, and/or other mechanisms, stimulate and engage the user community in order to keep the accomplishments of the OOI at the cutting edge of scientific inquiry and technological innovation.
- Developing and implementing strategies to expand scientific and public awareness of the unique scientific and technological opportunities of the OOI.
Applications should be submitted to Annette DeSilva, at the OOIFB Administrative Support Office, and must include a letter of interest and an academic CV. Applications are due by August 15, 2021. Applications will be reviewed by the OOIFB, who will give due consideration to the qualifications of applicants, as well as the maintenance of gender, career level, discipline, and regional balance on the OOIFB. For more information about OOIFB and its activities, please visit the website or contact Kendra Daly, OOIFB Chair. The OOIFB Charter is available for review here.
Read More
Jupyter Notebook Produces Quality Flags for pH Data
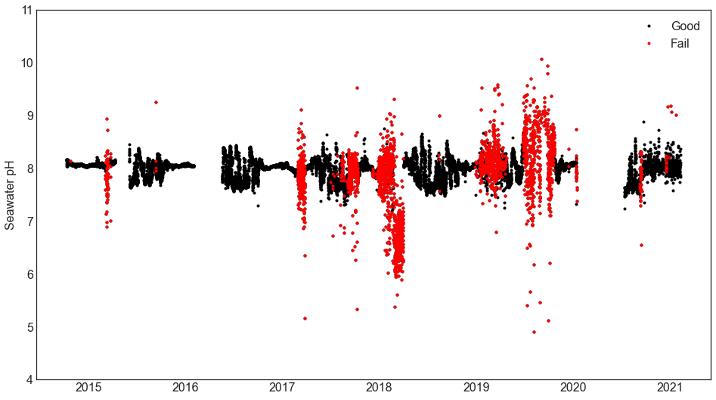
OOI uses the SAMI2-pH sensor from Sunburst Sensors, LLC to measure seawater pH throughout the different arrays. Assessing the data quality from this instrument is an involved process as there are multiple parameters produced by the instrument that are then used to calculate the seawater pH. These measurements are subject to different sources of error, and those errors can propagate through the calculations to create an erroneous seawater pH value. Based upon the vendor documentation and MATLAB code Sunburst provides to convert the raw measurements, OOI data team members have created a set of rules from those different measurements to flag the pH data as either pass, suspect or fail.
The resulting flags can be used to remove failed data from further analysis. They can also be used to help generate annotations for further Human in the Loop (HITL) QC checks of the data to help refine quality metrics for the data. OOI team member, Chris Wingard (OSU), has written up the QC process as a Python Jupyter notebook. This notebook and other example notebooks are freely available to the scientific community via the OOI GitHub site (within the OOI Data Team Python toolbox accessed from https://oceanobservatories.org/community-tools/ ).
In this notebook, Wingard shows how the quality rules can be used to remove bad pH data from a time series, and how they can be used to then create annotations. The impact of using these flags is shown with a set of before and after plots of the seawater pH as a function of temperature. The quality controlled data can then be used to estimate the seasonal cycle of pH to set climatological quality control flags.
Here an example is shown using data from a pH sensor on the Oregon Inshore Surface Mooring (CE01ISSM) near surface instrument frame (NSIF), deployed at 7 m depth (site depth is 25 m).
[media-caption path="https://oceanobservatories.org/wp-content/uploads/2021/07/EA-Highlight.png" link="#"]Figure 25: pH data from the Oregon Inshore Surface Mooring (CE01ISSM) near surface instrument frame (NSIF). Good data are shown in black, failed data in red. Note that simple range tests on the final calculated pH are often not enough to distinguish good from failed data. The automated QC processing examines intermediate measurements and fails data if intermediate measurements are outside acceptable ranges and propagated to final measurements.[/media-caption] [media-caption path="https://oceanobservatories.org/wp-content/uploads/2021/07/EA-highlight-2.png" link="#"]Figure 26: Good data together with annual cycles (red) constructed with available good data from initial deployment through 2021. Data which falls outside three standard deviations of the climatology is flagged as suspect. The climatological tests are used to flag suspect data. Simple range tests for suspect (cyan) and failed (magenta) data are also shown. The annual cycle at this site is strongly influenced by annual summer upwelling and winter storms and river plumes. The summer decrease in pH is consistent with cold, relatively acidic upwelled water high in CO2 (see e.g., Evans et al., 2011)[/media-caption]
Evans, W., B. Hales, and P. G. Strutton (2011), Seasonal cycle of surface ocean pCO2on the Oregon shelf,J. Geophys. Res., 116, C05012, doi:10.1029/2010JC006625.
Read MoreSeismic Hazards Around the Globe: A Visualization Tool to Bring RCA Data into the Classroom
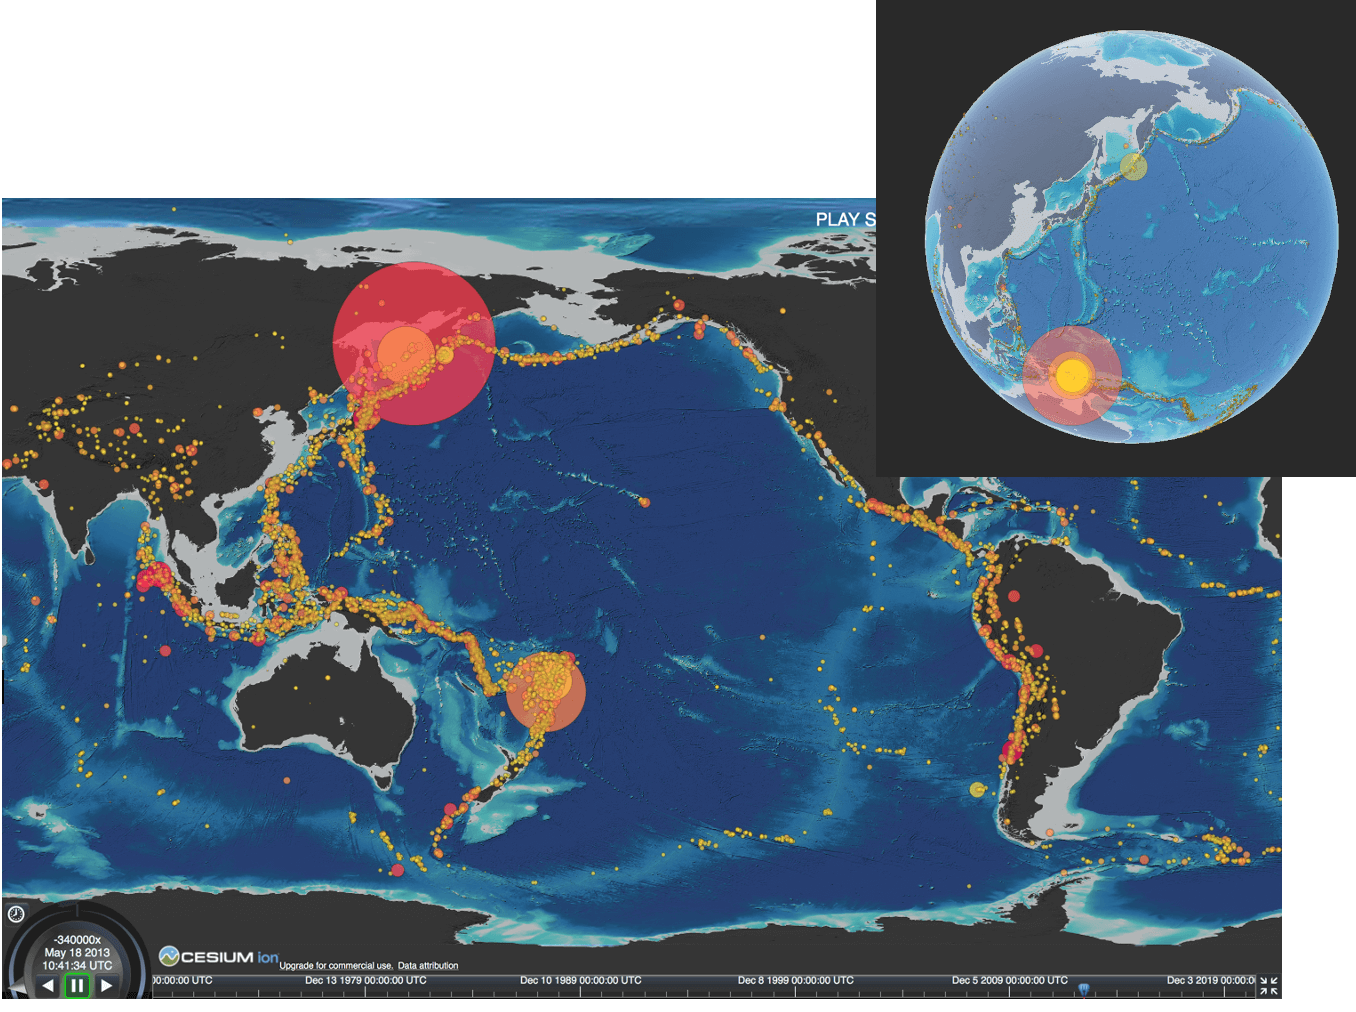
As part of the continuing University of Washington engagement effort, and in preparation for the new National Science Foundation K12 education award focused on bringing OOI data into the classroom, Kelley collaborated with the Center for Environmental Visualization within the School of Oceanography to generate an earthquake exploration tool focused on seismic events within the global oceans from 1970 to present. We anticipate that one of the curriculum modules developed for the K12 program will be focused on geohazards, with an emphasis on the Cascadia Subduction Zone within the context of the “ring of fire.” A video of this animation is hosted on interactive oceans and a direct link to the developmental site is provided above. The animation will be used in a Queens College physical geology class this next year that has 150 students (Dr. Dax Soule). This effort is also in preparation for completing a similar visualization focused on Axial Seamount and Regional Cabled Array seismic data.
The data sets used for this effort include a map centered on the Pacific Ocean that shows the distribution of earthquakes of magnitude ≥6 in the U.S. Geological Survey catalog from 1970 through 2021. The topographic dataset is licensed under Creative Commons CC BY-4.0. The data were formatted to match the JSON format recommended for use of global visualization using the ‘Cesium’ interactive virtual earth viewer promoted within its 3D geospatial visualization for the web toolset. The Cesium JavaScript API was utilized to implement algorithms for procedural color determination based on magnitude and hypocenter point radius animation based on the date-time of the earthquake event. The resultant animation is highly interactive, allowing the user to choose a 3D global view or a flat view, and viewing speeds of 1-8 times. In addition, the field of view can be changed to move to a specific area of interest and includes zoom capabilities. A sliding time bar allows the user to focus in on particular items of interest.
Read More
Shipboard CTD Data in Near-real Time from Irminger 8
In August, members of the OOI team aboard the R/V Neil Armstrong for the eighth turn of the Global Irminger Sea Array and members of OSNAP (Overturning in the Subpolar North Atlantic Program) onshore are working together to make near-real time shipboard CTD data available here.
[button link="https://oceanobservatories.org/community-tools/"] READ NEAR REAL-TIME CTD DATA REPORT BLOGS DURING CRUISE [/button]
The OOI shipboard team is working directly with an onshore expert hydrographer, Leah McRaven (PO WHOI), from the US OSNAP team to support collection of an optimized hydrographic data product. This collaboration is supporting the OOI team through the cruise planning stages, during the cruise, and during initial data processing stages. In the end, both teams aim to document the process of collecting thoroughly vetted data from the shipboard CTD (conductivity, temperature, depth) system.
A special feature of this collaboration is the near real-time sharing of OOI shipboard CTD data with the public. Interested parties have access to the same CTD profiles that McRaven will be reviewing. Additionally, McRaven will share brief reports online while the cruise is underway.
The hydrographic data collection facilitated by OOI on the Irminger Sea cruise will bolster not only OOI end users, but also supports international oceanographic research projects, including OSNAP, AMOC (Atlantic Meridional Overturning Circulation) and BGC-ARGO (BioGeoChemical Array for Real-time Geostrophic Oceanography).
“We hope sharing this data will present an opportunity for OOI end users to learn more about working with oceanographic data as well as good data practices,” said McRaven.
Al Plueddemann, PI of OOI’s Coastal and Global Scale nodes, which includes the Global Irminger Array, added “This is a great example of a cross-project collaboration that expands the visibility of OOI data over the short-term and improves its quality for integration into long-term research projects like OSNAP.”
Read MoreScoping the New Pioneer Array in the Southern Mid-Atlantic Bight
A very engaged group of participants spent the week of June 21st thinking about how to optimize the Pioneer Array for its relocation to the southern Mid-Atlantic Bight (MAB) in 2024. The five-day Innovations Lab, sponsored by the National Science Foundation (NSF) was led by the OOIFB (Ocean Observatories Initiative Facilities Board), a talented team of “Sparks”, Knowinnovation, Inc. (KI), and expertly supported by the OOI Facility. The group identified a range of representative interdisciplinary science questions that can be addressed using the Pioneer Array within the MAB and proposed optimum locations and potential configurations for the array.
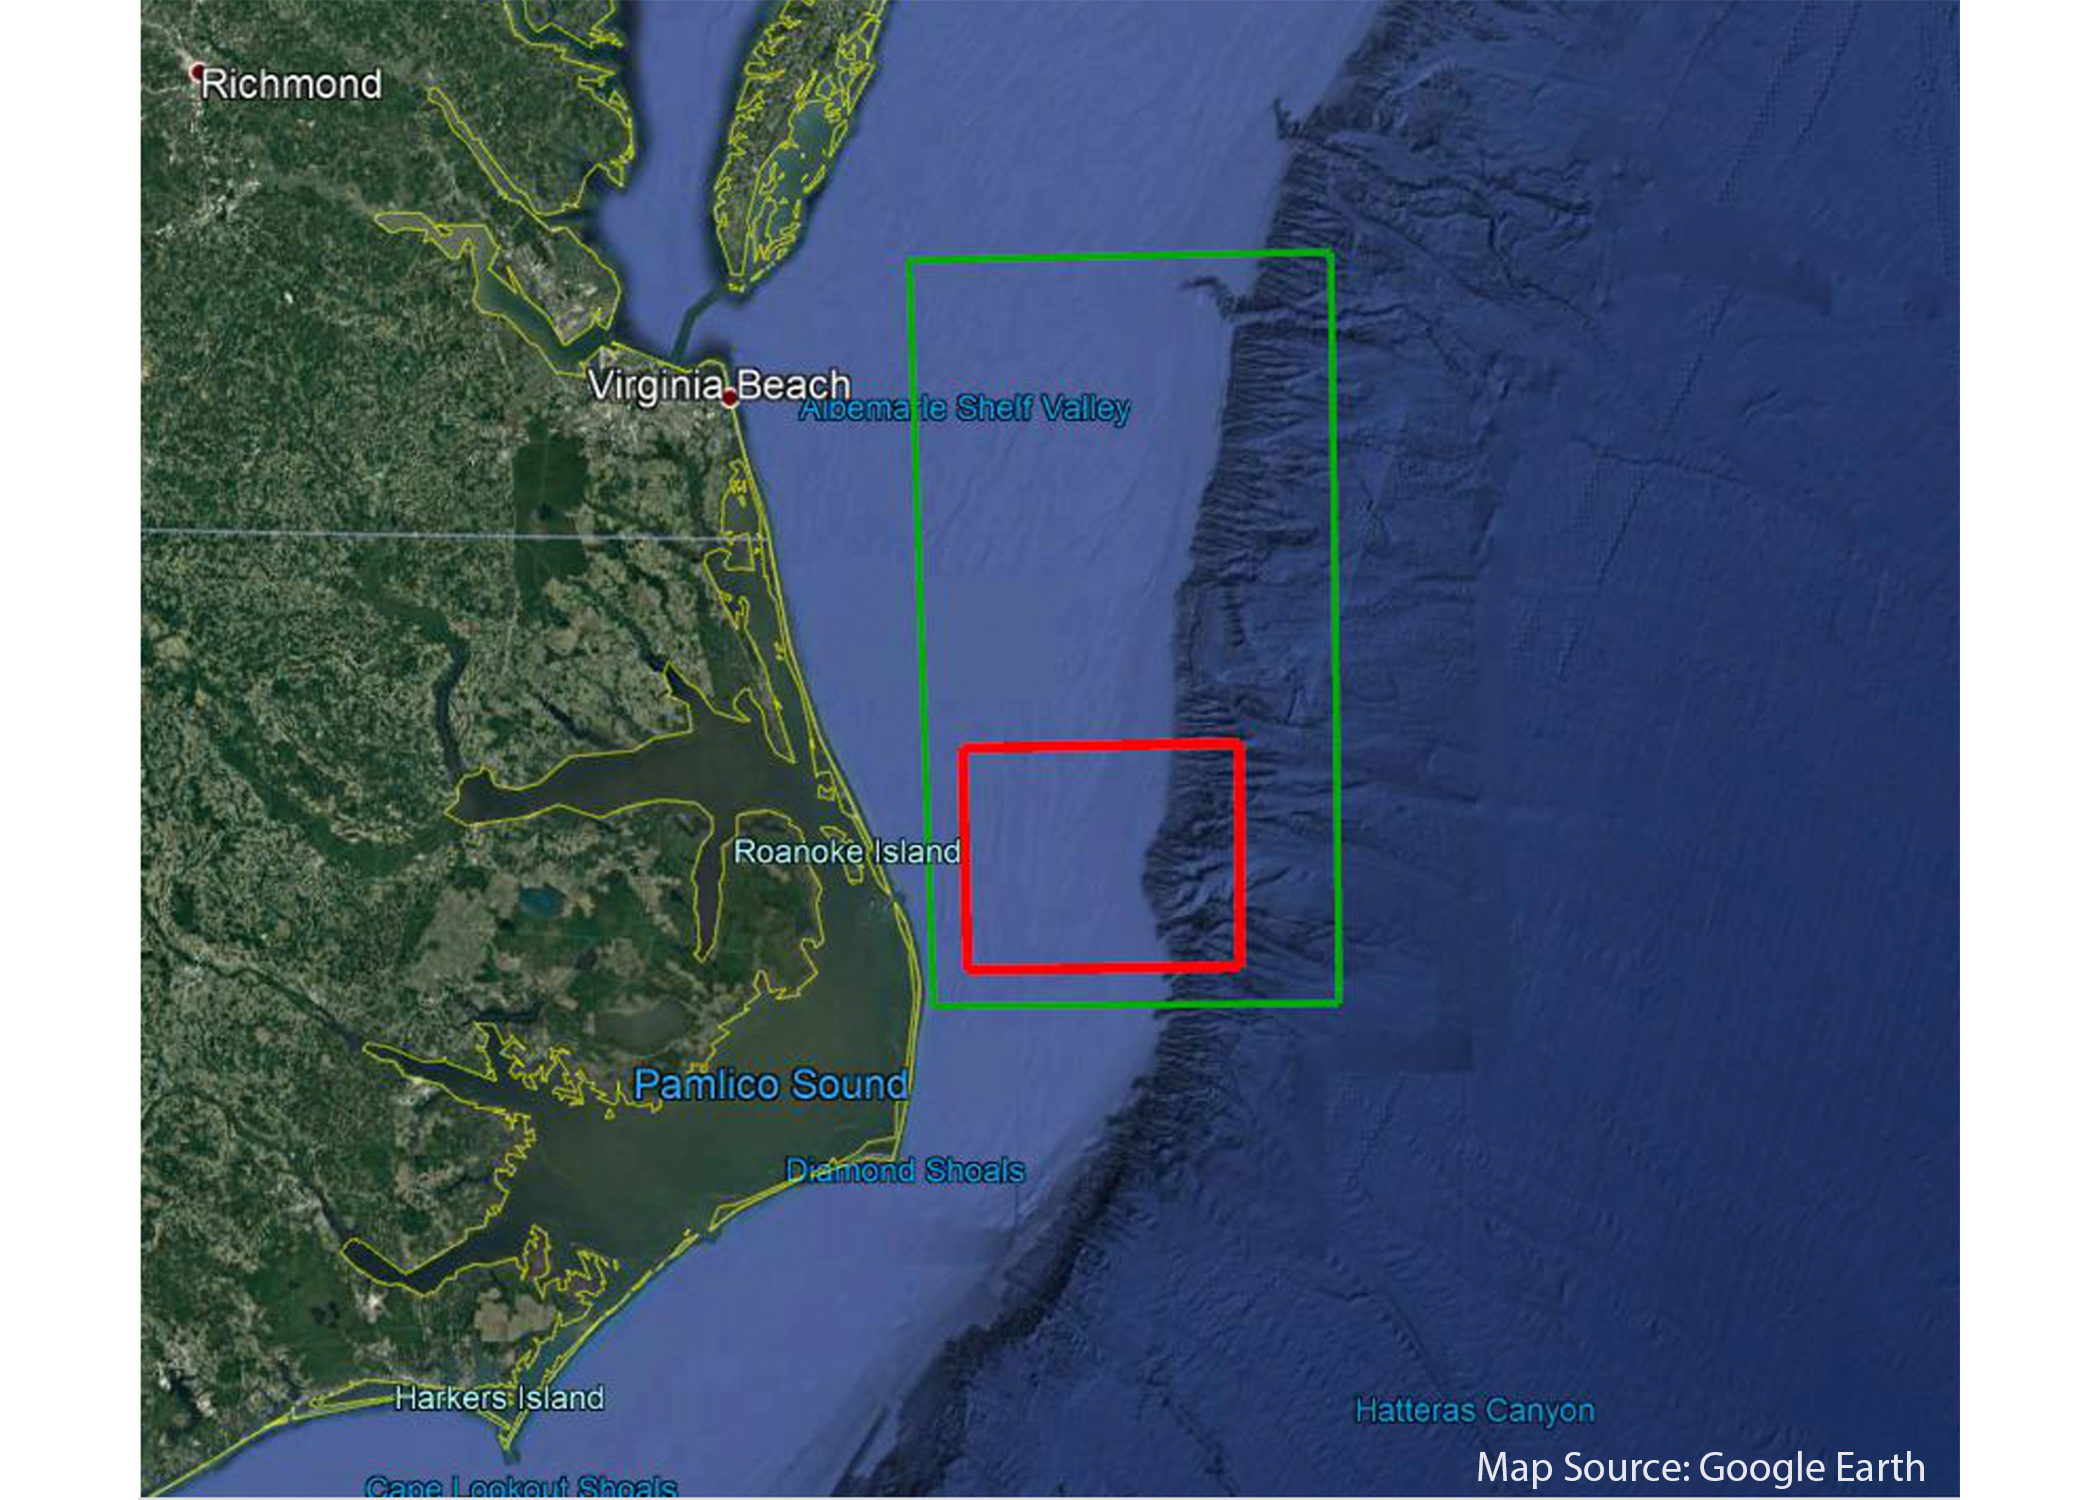
Science question topics included air-sea interactions; the influence of estuarine plumes and the Gulf Stream on cross-shelf and shelf-slope exchanges and their impacts on ocean chemistry and biology; benthic-pelagic coupling; and canyon processes. Participants converged on a general region (see boxes in Figure 1 below) that would best address the science questions.
[media-caption path="https://oceanobservatories.org/wp-content/uploads/2021/06/Google-earth-map.png" link="#"]Figure 1. Southern MAB Pioneer Array regions. The red box indicates the region where moorings would be located and the larger green box indicates the region where mobile assets (gliders and AUVs) would operate.[/media-caption]
“The Innovations Lab was very successful, and we really appreciate the community sharing their innovative ideas with us in this essential first step,” said Kendra Daly, chair of the OOIFB. “The Innovations Lab provides an excellent start to a long process of fleshing out the details to ensure that the array provides data to investigate a broad range of interdisciplinary science questions, while also being robust enough to weather the challenging environmental conditions in the Mid-Atlantic Bight.”
The OOIFB will continue to engage with the OOI community to refine the array’s design for implementation over the next two years. The Innovations Lab showed that there is strong community interest in coastal science, the potential for new partnerships, and excitement about implementing the Pioneer Array in its new location.
Read More
Eighth Turn of Station Papa Array Set for July
After 20 months in the water, the Global Station Papa Array will be turned (old moorings recovered and new ones deployed) in July for the eighth time. Normally, this array is turned every year, but last year the trip was cancelled due to constraints imposed by the COVID-19 pandemic. In early July, the OOI team will head to Seward, Alaska to begin preparations for this long-due operation.
The OOI team will arrive in Seward and load the R/V Sikuliaq with over 54 tons of equipment. Following one week of equipment mobilization and build, and a precautionary seven-day COVID isolation period, the team will depart for a 16-day cruise in the Northeast Pacific. The team will recover three Station Papa subsurface moorings and deploy three new ones. Along the way, they will also deploy two Open Ocean Gliders, recover one Profiling Glider, and conduct 11 CTD casts, which will help calibrate and validate the instruments on the array. The design of the moorings and gliders, as well as their planned locations, can be found here.
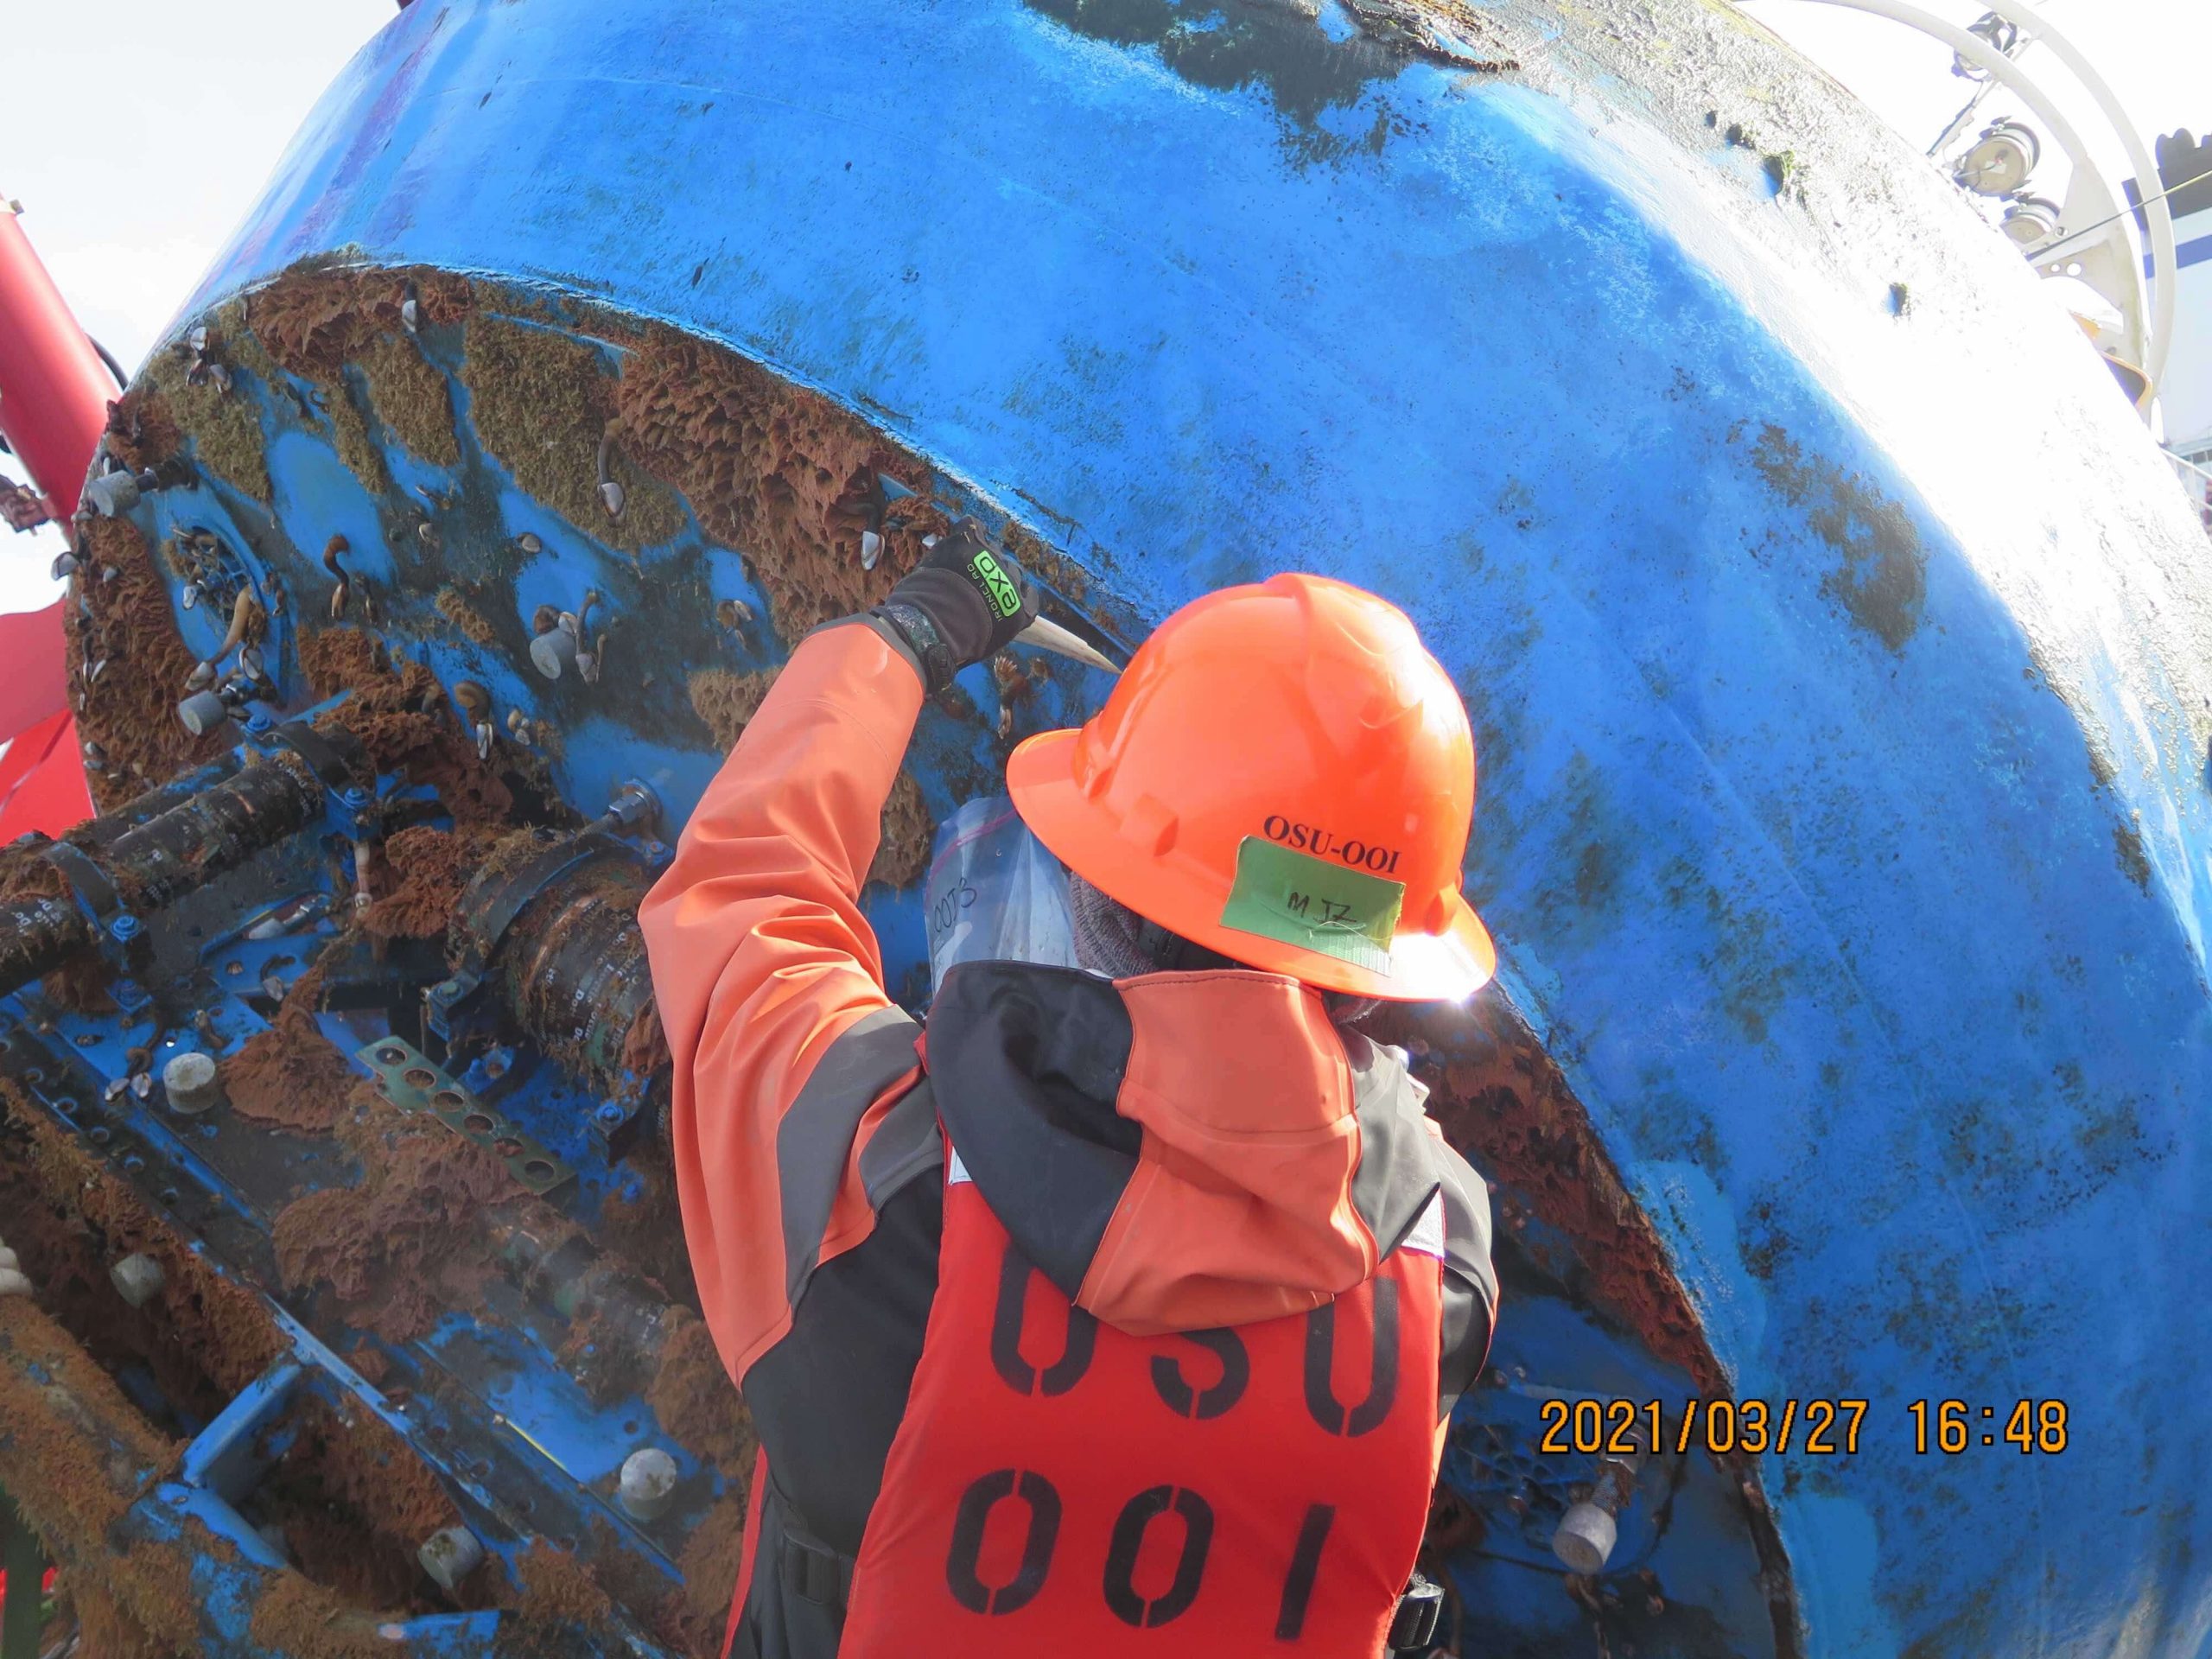
The robust array was designed for a 12-month deployment between turns, but due to COVID this interval had to be extended to 20 months. The extended duration may have affected data quality since bio-fouling on instruments accumulates over time. However, past experience with extended durations has been positive such that the team’s expectations regarding data quality is high.
“Regular maintenance is vital for keeping the arrays working and collecting data, so this cruise is an especially important one,” said Chief Scientist Kris Newhall, who leads the seven members of the Station Papa 8 team.
The moorings have several design updates, including improved controllers and new positioning beacons with GPS and flashers built into the housing. The upgrades will increase the performance of the moorings and simplify recovery operations.
The Global Station Papa Array is an important part of the OOI network, and the data it has collected is helping to shed light on the physical and biological dynamics for this region of the North Pacific.
Read More