
News
Active Protothrusts and Fluid Highways: Seismic Noise Reveals Hidden Subduction Dynamics in Cascadia
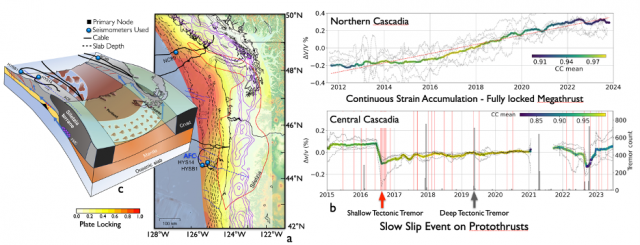
This first of a kind study by Kidiwela et al., (2026) “Active protothrusts and fluid highways: Seismic noise reveals hidden subduction dynamics in Cascadia” (1) applies ambient seismic noise interferometry to a decade of RCA broadband seismometer data at Slope Base and Southern Hydrate Ridge, and on Ocean Networks Canada >400 km to the north at Clayoquot Canyon, to resolve spatio-temporal variations in seismic velocity across the Cascadia Subduction Zone. Along-strike heterogeneity in megathrust behavior, with a strongly coupled (locked) segment in northern Cascadia is in sharp contrast to a weakly coupled central segment characterized by distributed deformation along active protothrusts with slow-slip events. Temporal velocity reductions are suggested to correlate with fluid migration along permeable structures at the plate interface and the subsidiary strike slip Alvin Canyon Fault, indicating that elevated pore-fluid pressures modulate fault mechanical properties. These “fluid highways” facilitate transient weakening and influence stress partitioning, potentially inhibiting the lateral propagation of seismic rupture.
[caption id="attachment_37564" align="alignnone" width="936"]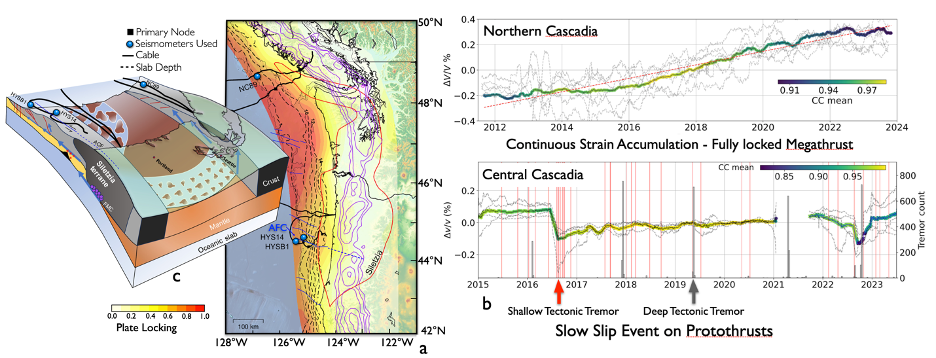 Figure 1 (after Kidiwela Figs 1-3) a) Cascadia Subduction Zone showing a model for the distribution of locking, depth to the down-going slab, strike-slip faults (blue lines) and location of Regional Cabled Array and Ocean Network Canada broadband seismometers used in this study. The Siletzia terrain, a large buried accreted basaltic body is outlined in red. b) Cross sections showing temporal changes in seismic velocities (dv/v) for the Northern and Central Caldera sites. Histograms for shallow (red) and deep (grey) tremor events shown for Central Caldera. c) The cross section shows fluid migration (blue arrows), splay faults and protothrusts (red lines) and the Alvin Canyon Fault (ACF). Down dip tremor, purple dots, match small locked proportions of the slab, Fluid transport along the décollement and the Alvin Canyon Fault are thought to modulate earthquake behavior.[/caption]
The study demonstrates that seismic noise–derived velocity changes provide a sensitive proxy for real-time monitoring of fault zone hydromechanical processes. It provides new constraints on subduction zone segmentation, coupling, and earthquake rupture dynamics and demonstrates a powerful new way to monitor offshore fault zones, ultimately improving our understanding of when and how large earthquakes might occur in Cascadia.
___________________
Reference:
1Kidiwela, M., Denolle, M.A., Wilcock, W.S.D., and Feng, K-F (2026) Active protothrusts and fluid highways: Seismic noise reveals hidden subduction dynamics in Cascadia. Science Advances, 12; https://www.science.org/doi/10.1126/sciadv.aea3684.
Read MoreAdvancing Coastal Biogeochemical Research Through the OOI Regional Cabled Array
On April 14th, researchers Deb Kelley [University of Washington (UW)] and Jonathan Sharp [Cooperative Institute for Climate, Ocean, and Ecosystem Studies (CICOES)/NOAA’s Pacific Marine Environmental Laboratory (PMEL)] received funding for a collaboration to integrate unprecedented high-resolution, long-duration ocean environmental observations from the U.S. National Science Foundation Ocean Observatories Initiative (OOI) Regional Cabled Array (RCA) into coupled machine-learning and modeling frameworks, transforming monitoring and forecasting of Pacific Northwest coastal waters.
The partnership is funded by the UW College of the Environment Collaborative Research in Earth System Science and Technology (CRESST) program, made possible through the Paul G. Allen Fund for Science and Technology (FFST).
The project will support the incorporation of publicly available, research-grade RCA data into:
- a machine-learning-based approach to construct biogeochemical data products for the California Current Ecosystem (based on the GOBAI-O2approach)
- a separate effort leveraging the LiveOcean model to improve estimates of carbonate chemistry in the Pacific Northwest and Puget Sound.
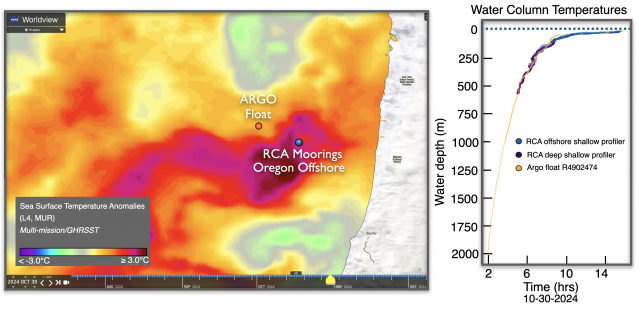
Results will include gap-filled, gridded, four-dimensional estimates of oxygen, nitrate, and carbonate chemistry for critical ecosystems along the U.S. West Coast. RCA data spanning more than a decade, from the seafloor to near-surface environments from Deep and Shallow Profiler Moorings, will be incorporated into the models, along with complementary observational data from ships, floats, gliders, and other platforms.
Analysis workflows will be provided as Jupyter notebooks to enable reproducibility and facilitate adoption by other researchers.
[caption id="attachment_37554" align="alignnone" width="3336"] Example illustration of satellite, ARGO Float, and RCA Shallow and Deep Profiler Mooring data to be incorporated into model integration tools aligning RCA observations with model outputs and satellite products. Credit: W. Ruef, University of Washington.[/caption]
Read More
Example illustration of satellite, ARGO Float, and RCA Shallow and Deep Profiler Mooring data to be incorporated into model integration tools aligning RCA observations with model outputs and satellite products. Credit: W. Ruef, University of Washington.[/caption]
Read More Call for Applications: OOI Facility Board
The U.S. National Science Foundation (NSF) Ocean Observatories Initiative Facility Board (OOIFB) is tasked with representing the science community and users of the NSF Ocean Observatories Initiative (OOI) Facility. The OOIFB works to expand scientific and public awareness of OOI, and ensure that the oceanographic community is kept informed of developments of NSF OOI.
The OOIFB is soliciting applications to fill TWO membership positions that will open as of June 1, 2026, and run through May 31, 2029. The selected individuals will then be eligible to serve additional, 3-year terms, if preferable.
Scientists, spanning water column to seafloor expertise, as well as experimentalists, engineers, and modelers, with experience using scientific observing systems, such as the NSF OOI, are encouraged to apply. Familiarity/expertise with Station Papa, the Irminger Sea Array, and/or the Regional Cabled Array are preferred, although not required. All interested applicants will be considered.
The OOIFB holds at least one in-person meeting per year and one web conference each month. The responsibilities of the OOIFB may include, but are not limited to, the following:
● Serving as the prime scientific and technical conduit between the oceanographic community and NSF regarding OOI.
● Examining the accomplishments and work flow of the NSF OOI Operator, in order to provide feedback regarding the NSF OOI Annual Work Plans (AWPs)
● Via workshops, community meetings, and/or other mechanisms, stimulate and engage the user community in order to keep the accomplishments of the NSF OOI at the cutting edge of scientific inquiry and technological innovation.
● Developing and implementing strategies to expand scientific and public awareness of the unique scientific and technological opportunities of the NSF OOI.
● Helping to identify collaborative relationships with potential governmental, industrial, educational, and international partners in the NSF OOI, where appropriate.
● Ensure fair and consistent access to the NSF OOI by all sectors of the user community.
Applications should be submitted to Holly Morin, at the OOIFB Administrative Support Office (holly@ooifb.org), and must include a letter of interest and a CV. The statement of interest should highlight the applicant’s experience using observatory data, as well their vision for how these experiences might evolve in the future.
Please note, applications cannot be accepted from individuals affiliated with the NSF OOI Program Facility institutions (Woods Hole Oceanographic Institution, Oregon State University, and the University of Washington), individuals under contract with the NSF OOI Program, and individuals from institutions already represented on the OOIFB (the current list of OOIFB members is available HERE).
Applications are due by May 22, 2026. Applications will be reviewed by the OOIFB, who will give due consideration to the qualifications of applicants, as well as the maintenance of career level, discipline, and regional balance on the OOIFB. For more information about OOIFB and its activities, please visit the website, http://ooifb.org, or contact Dax Soule, OOIFB Chair (Dax.Soule@qc.cuny.edu).
Read MoreMulti-Span Fiber Sensing Expands Reach of OOI Regional Cabled Array
From November 2025 through January 2026, scientists from the University of Washington (UW) and Nokia Bell Labs carried out a successful demonstration of a novel multi-span distributed acoustic sensing (DAS) system on the U.S. National Science Foundation (NSF) Ocean Observatories Initiative (OOI) Regional Cabled Array (RCA).
The UW investigators William Wilcock, Brad Lipovsky, Marine Denolle and Shima Abadi collaborated with Mikael Mazur, and Nicolas Fontaine at Nokia Bell Labs to test an exciting new approach that extends sensing across the full length of submarine fiber optic cables, far beyond previous limits.
“This experiment shows that we can transform existing subsea cables into powerful, large-scale sensing systems,” said William Wilcock, professor of Oceanography at the UW. “It’s a powerful new tool to observed ocean and Earth processes continuously over hundreds to thousands of kilometers.”
Extending Sensing Across the Full Cable
DAS works by measuring strain along a fiber using backscattered light, enabling detection of earthquakes, ocean waves, and marine mammals such as whales. Earlier NSF-funded RCA experiments were limited to the first cable segments, reaching about 65 km (north) and 95 km (south) offshore, due to signal loss at optical repeaters.
The Nokia Bell Labs system overcomes this barrier by using high-loss loopback couplers within the optical repeaters to extend sensing across the entire cable span. “We thought the most important function of subsea cables was transporting petabits per second of data across our oceans. In reality, it’s how we can turn these cables into an array of acoustic sensors spaced every 10 meters or so, spanning entire ocean basins,” said Nicolas Fontaine of Nokia Bell Labs.
The two RCA cables extend offshore from Pacific City, Oregon. The northern cable (~480 km) runs roughly perpendicular to shore and reaches Axial Seamount. The southern cable (~350 km) crosses the continental shelf, continues onto the Juan de Fuca Plate, and loops back toward shore off Newport Oregon.
“In the Pacific Northwest, much of the earthquake hazard is concentrated offshore, where there are still relatively few instruments,” said Zoe Krauss, a postdoctoral researcher at the UW. “This new multi-span DAS capability on the RCA could be a game changer for offshore earthquake monitoring and may ultimately improve earthquake early warning in the region.”
Deployment, Data & Access
The system was deployed on November 5, 2025, and operated continuously, alongside normal observatory functions, through January 28, 2026. Sampling rates and spatial resolution (~10–200 m) were varied throughout the test.
For comparison, a conventional DAS system from Alcatel Subsea Networks was also deployed on the first span of the southern cable.
Nonlinear optical effects and observatory signals introduced noise in portions of the data. To address this, researchers applied spatial masks starting December 2, preserving 165 km and 275 km of usable data on the northern and southern cables, respectively. Some noise and small timing offsets remain, and users are advised to interpret the data carefully as analysis continues.
Low sample rate (~8 Hz) data are now available:
For full experiment details, metadata, and documentation, visit the project page.
Datasets include 3.9 TB of Nokia multi-span DAS data from both cables and 1.2 TB of OptoDAS data from the southern cable, along with documentation and tools for access and analysis.
Looking Ahead
This experiment highlights the potential of using existing ocean infrastructure as a large-scale, distributed sensing network.
“The Regional Cabled Array was designed to support innovation, and this project is a great example of how we can expand its capabilities in new and exciting ways,” said Deb Kelley, Director of OOI’s Regional Cabled Array. “By leveraging existing infrastructure, we’re unlocking unprecedented new pathways for discovery across the ocean and seafloor.”
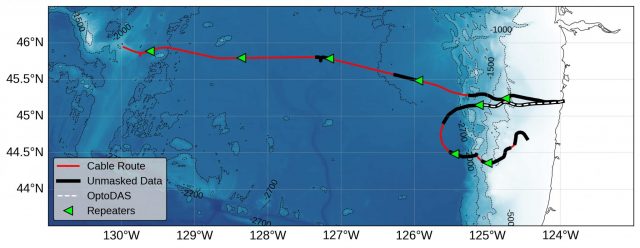
[caption id="attachment_37510" align="alignnone" width="2048"] Location of the OOI RCA cables off the Oregon coast, shown in red. The portions of the cables that were successfully interrogated with the Nokia multi-span system during the experiment are shown in black. White dashed lines overlain on the first span of the South Cable show the portion of the cable interrogated with the OptoDAS system. The locations of the optical repeaters are shown in green. Credit: Z. Krauss, University of Washington.[/caption]
A manuscript describing the experiment and its results can be found as a preprint at ESS Open Archive.
Read MoreExplore OOI Community Datasets
Did you know that the U.S. National Science Foundation Ocean Observatories Initiative (OOI) offers a growing collection of Community Datasets created by researchers using OOI data?
These datasets extend the value of OOI observations by combining data from multiple sources, applying additional processing and quality control, or building curated collections tailored to specific scientific questions. Many are also connected to peer-reviewed publications, making them a great starting point for deeper exploration and reproducible research.
Our Community Datasets page is updated regularly, so we encourage you to check back often to discover new additions: https://oceanobservatories.org/community-datasets/.
What You’ll Find
Each dataset listing includes:
- A DOI or access link directing you to full metadata and download options
- Detailed citations, including dataset creators
- Context on how the dataset was compiled or enhanced
If you have questions about a specific dataset, we recommend reaching out directly to the dataset creator(s), as listed in the citation.
Built by the Community, for the Community
These datasets are compiled and maintained by members of the research community, reflecting a wide range of scientific interests and approaches. They support cross-disciplinary work, including:
- Time-series analysis
- Model–data comparisons
- Process studies
- Integrated, multi-array investigations
Want to Contribute or Learn More?
If you have a dataset you’d like to share, or need assistance navigating available resources, the OOI HelpDesk is available to help.
You can also explore additional pathways to OOI-related data and publications, including the NSF Public Access Repository (PAR) and curated resources across OOI platforms and nodes.
Read MoreIFCB Webinar #1 Highlights: Building Community and Best Practices for Ocean Observations

The first IFCB webinar in a new community-driven series brought together researchers and operators to share knowledge, practical guidance, and future plans for Imaging FlowCytobot (IFCB) applications.
The webinar series, hosted by the Ocean Observatories Initiative Facilities Board (OOIFB), was inspired by a 2025 IFCB focus group and aims to strengthen collaboration around IFCB and Ocean Observatories Initiative (OOI) images and data products (access links here). Organizers outlined plans for future sessions, including topics such as moored IFCB deployments and applications on the OOI Pioneer Array, as well as the development of teaching resources and a community manuscript.
The focus of the first webinar was best practices for IFCB operation and deployment. The speakers emphasized that successful use begins with thorough training and hands-on experience in laboratory settings. From there, considerations expand to include water delivery systems, power and communication integration, and consistent system monitoring, especially for shore-side, shipboard, and offshore mooring deployments. Post-deployment care, including data backup, system checks, and routine maintenance, was highlighted as essential for long-term instrument performance.
Tom Fougere of McLane Research Laboratories emphasized the importance of reliable infrastructure (especially water flow, power stability, and communications) for shipboard and shore-based IFCB operations, while Dr. Sophie Clayton of the National Oceanography Centre (NOC) highlighted a best practices guide from the Operational Phytoplankton Observations Working Group addressing key challenges in phytoplankton imaging, including metadata standards, data management, uncertainty, and instrument diagnostics. Together, these perspectives reinforced that robust metadata capture, standardized workflows, and proactive maintenance are essential for producing high-quality datasets, alongside careful attention to calibration, system cleaning, and sampling strategies in low-density environments.
To learn more and view upcoming topics and dates for the next IFCB webinars, visit the OOIFB webpage.
OOI Presents a Decade of Ocean Observations at Ocean Sciences 2026
At Ocean Sciences 2026 in Glasgow, Scotland, the U.S. National Science Foundation’s Ocean Observatories Initiative (OOI) Lead Principal Investigator Jim Edson presented an overview of more than a decade of biogeochemical and physical ocean observations collected through OOI.
In his talk, Edson highlighted how sustained, research-quality observations from OOI’s global, coastal, and cabled arrays are helping scientists investigate ocean circulation, climate variability, coastal processes, and ecosystem dynamics. The observatory’s long-term time series provide a unique view of ocean conditions across diverse environments, from coastal margins to the open ocean and the seafloor. OOI’s openly available data support a wide range of research themes, including climate variability, ocean food webs and biogeochemical cycles, ocean–atmosphere exchange, coastal ocean dynamics, and geophysical and subseafloor processes. Recent advances in instrumentation and data systems are also expanding the observatory’s capabilities and enabling new approaches to ocean research, forecasting, and environmental stewardship.
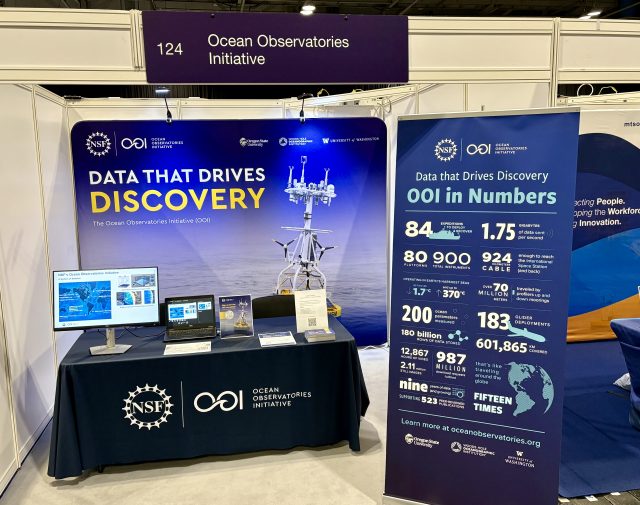
Throughout the meeting, members of the OOI team connected with conference attendees at the OOI exhibit booth. Visitors stopped by to learn more about accessing OOI’s long-term datasets, data tools, and observatory infrastructure. The booth provided an opportunity for researchers, students, and educators to ask questions and explore ways to incorporate OOI data into their work. Team members also discussed the current landscape of federal ocean observing efforts and answered questions about coordination with other government agencies and offices.
Together, the presentation and booth discussions demonstrated how OOI’s sustained observations and open-access data continue to drive new discoveries and expand opportunities for the ocean science community.
[caption id="attachment_37420" align="alignnone" width="2560"]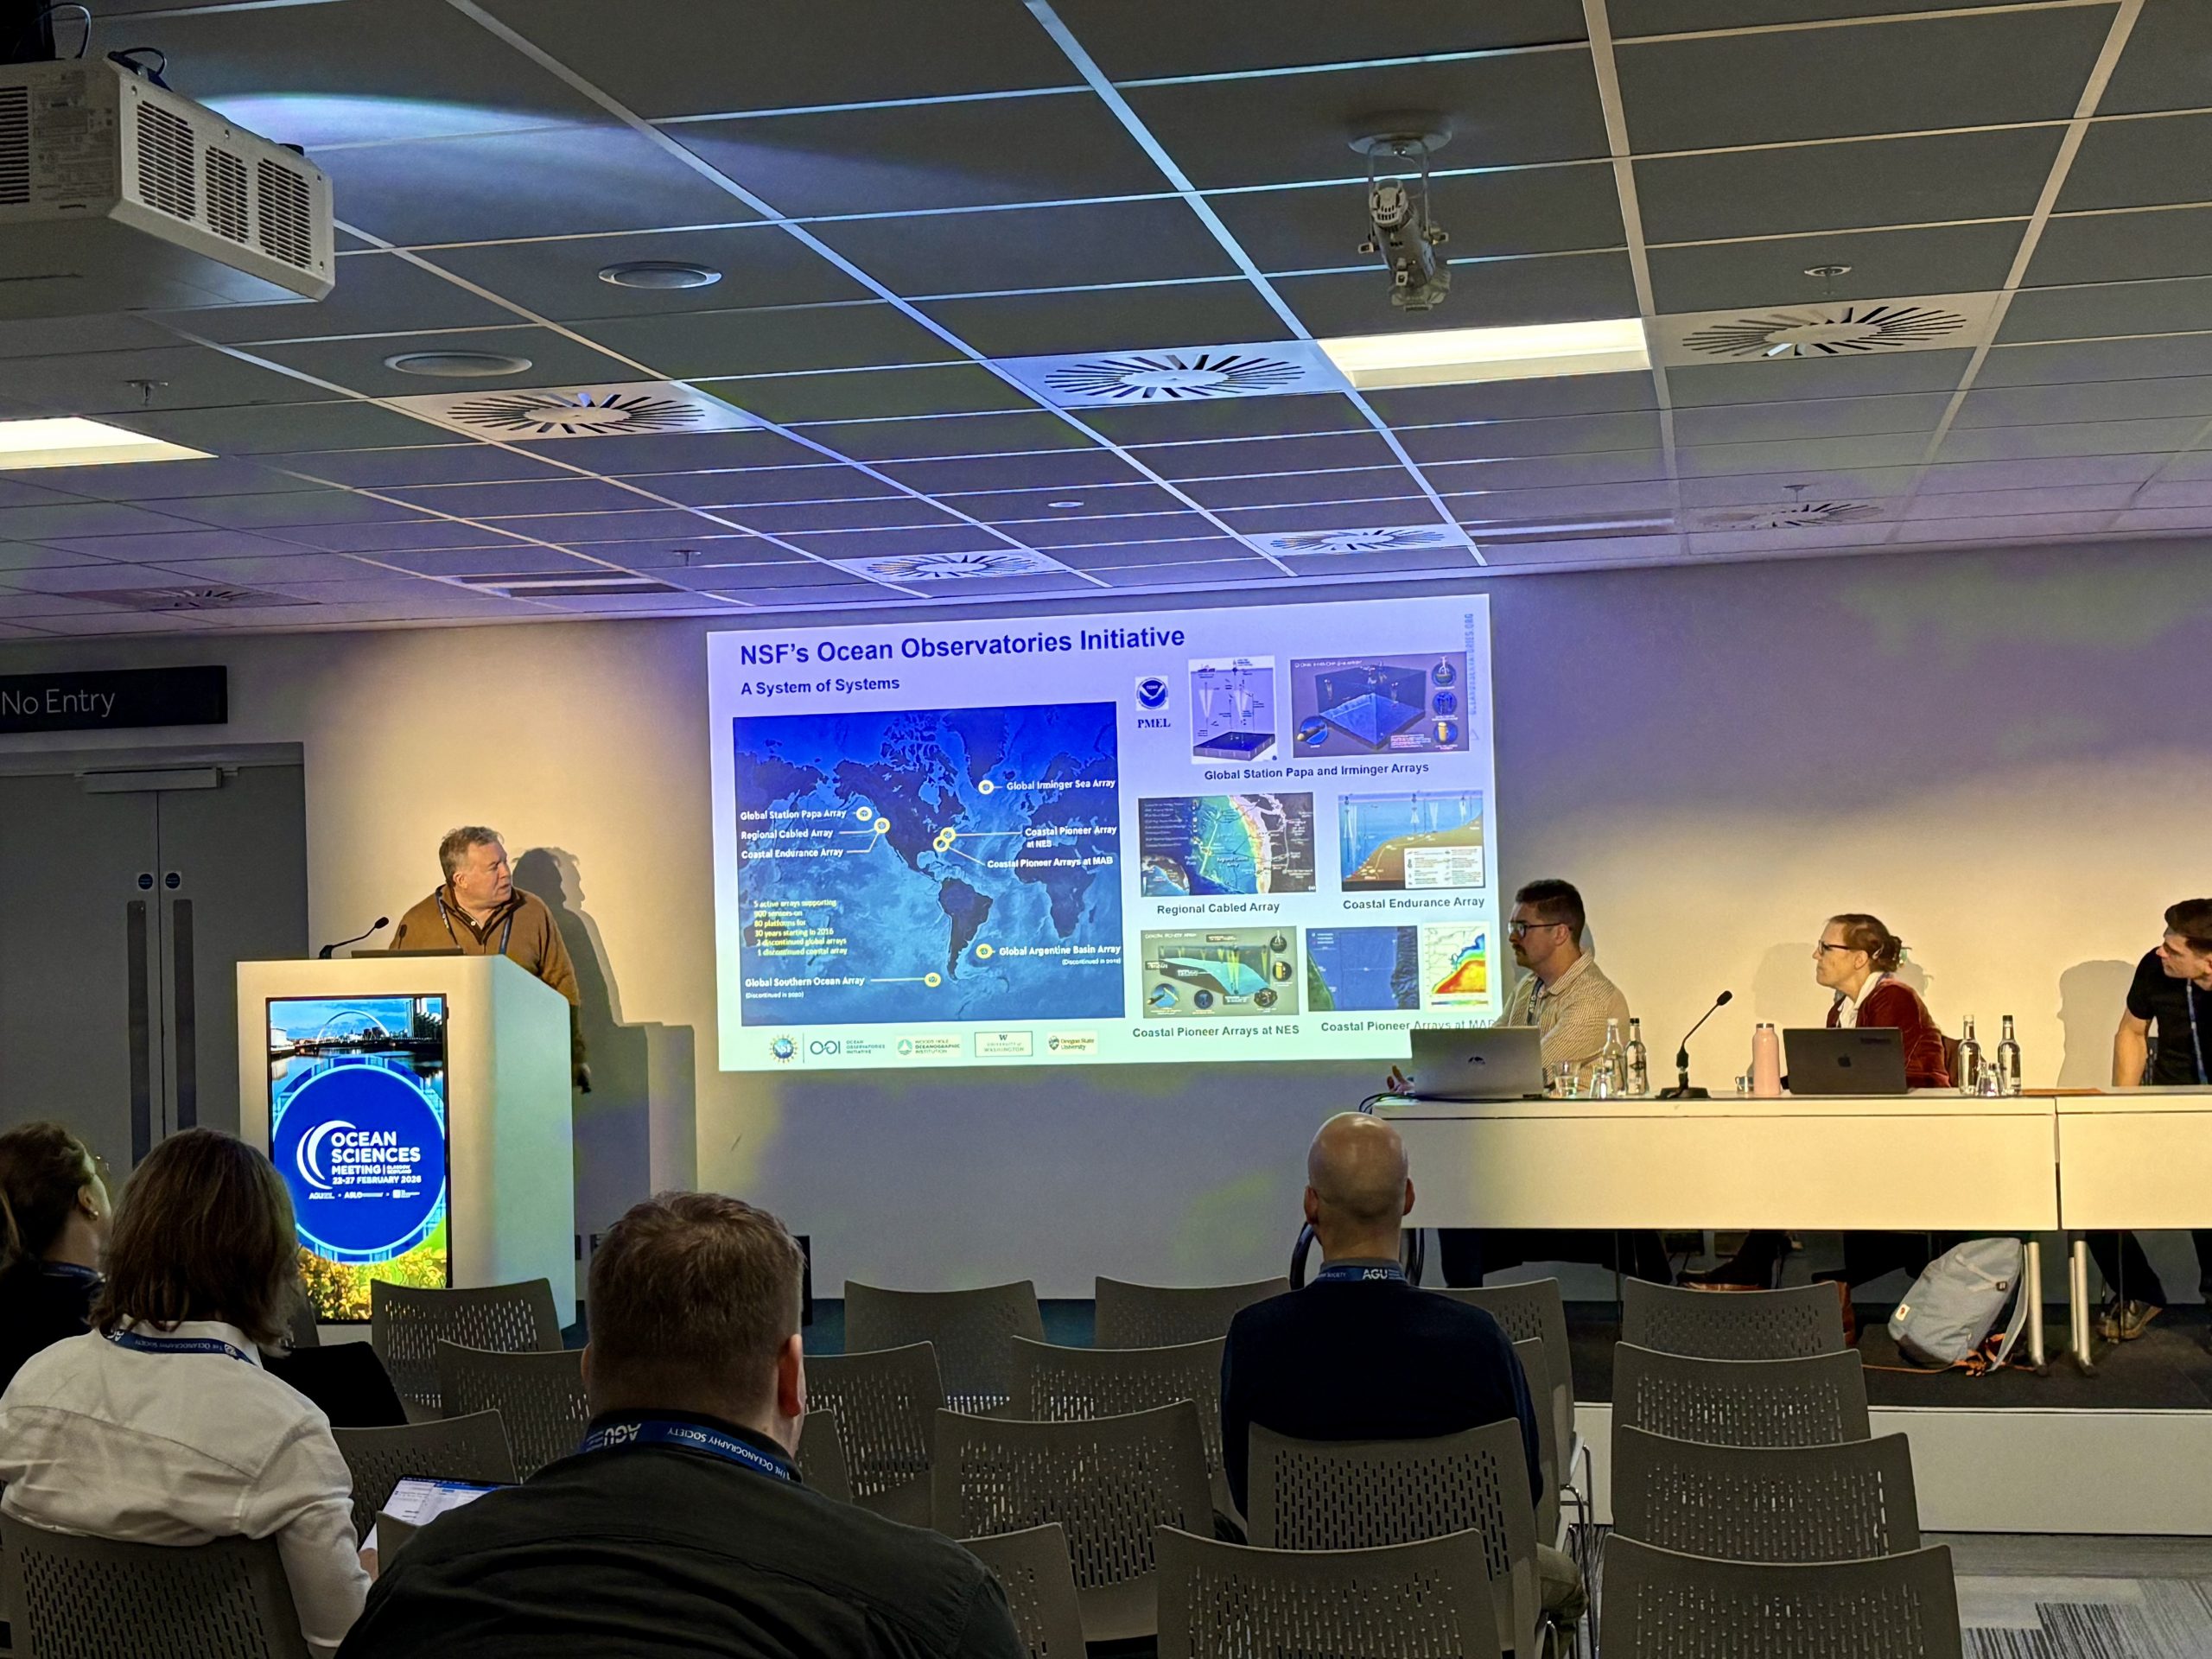 Jim Edson, Lead PI of OOI, delivers an oral presentation at Ocean Sciences 2026. (c): Amber Coogan, WHOI[/caption]
[caption id="attachment_37421" align="alignnone" width="1920"]
Jim Edson, Lead PI of OOI, delivers an oral presentation at Ocean Sciences 2026. (c): Amber Coogan, WHOI[/caption]
[caption id="attachment_37421" align="alignnone" width="1920"]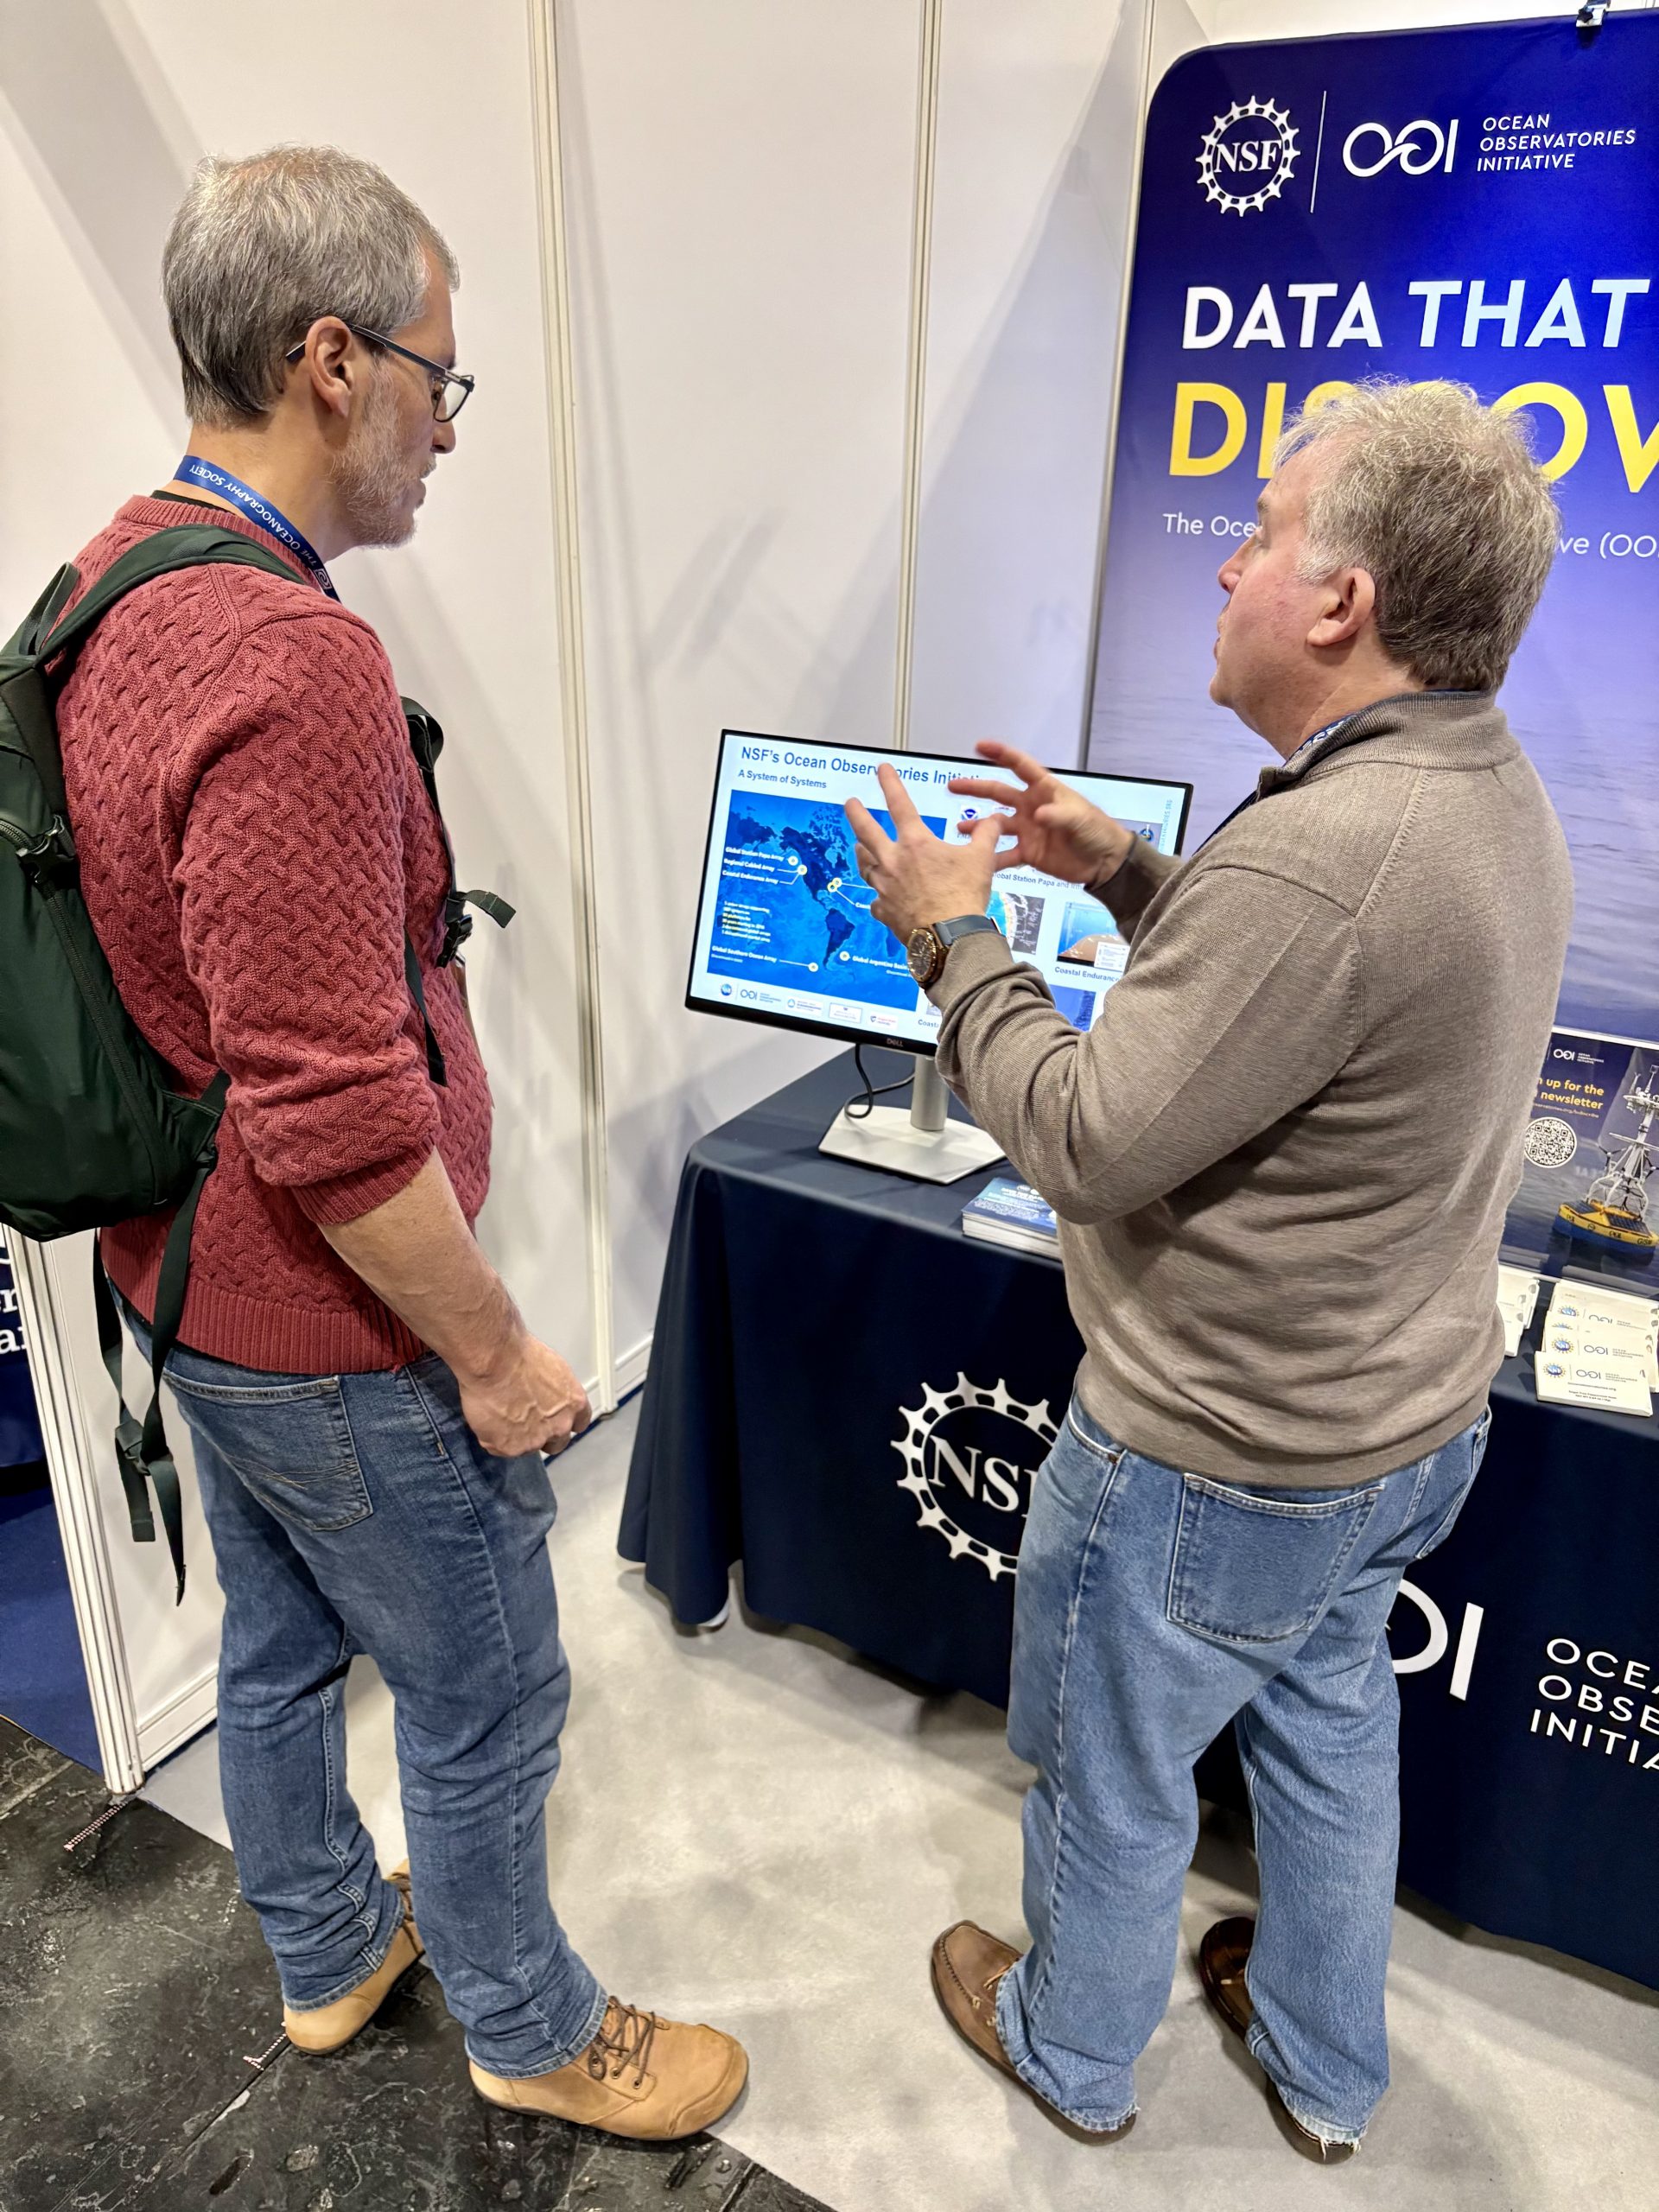 Jim Edson, Lead PI of OOI, speaks with visitors at the OOI exhibit booth during Ocean Sciences 2026. (c): Amber Coogan, WHOI[/caption]
[caption id="attachment_37422" align="alignnone" width="2560"]
Jim Edson, Lead PI of OOI, speaks with visitors at the OOI exhibit booth during Ocean Sciences 2026. (c): Amber Coogan, WHOI[/caption]
[caption id="attachment_37422" align="alignnone" width="2560"]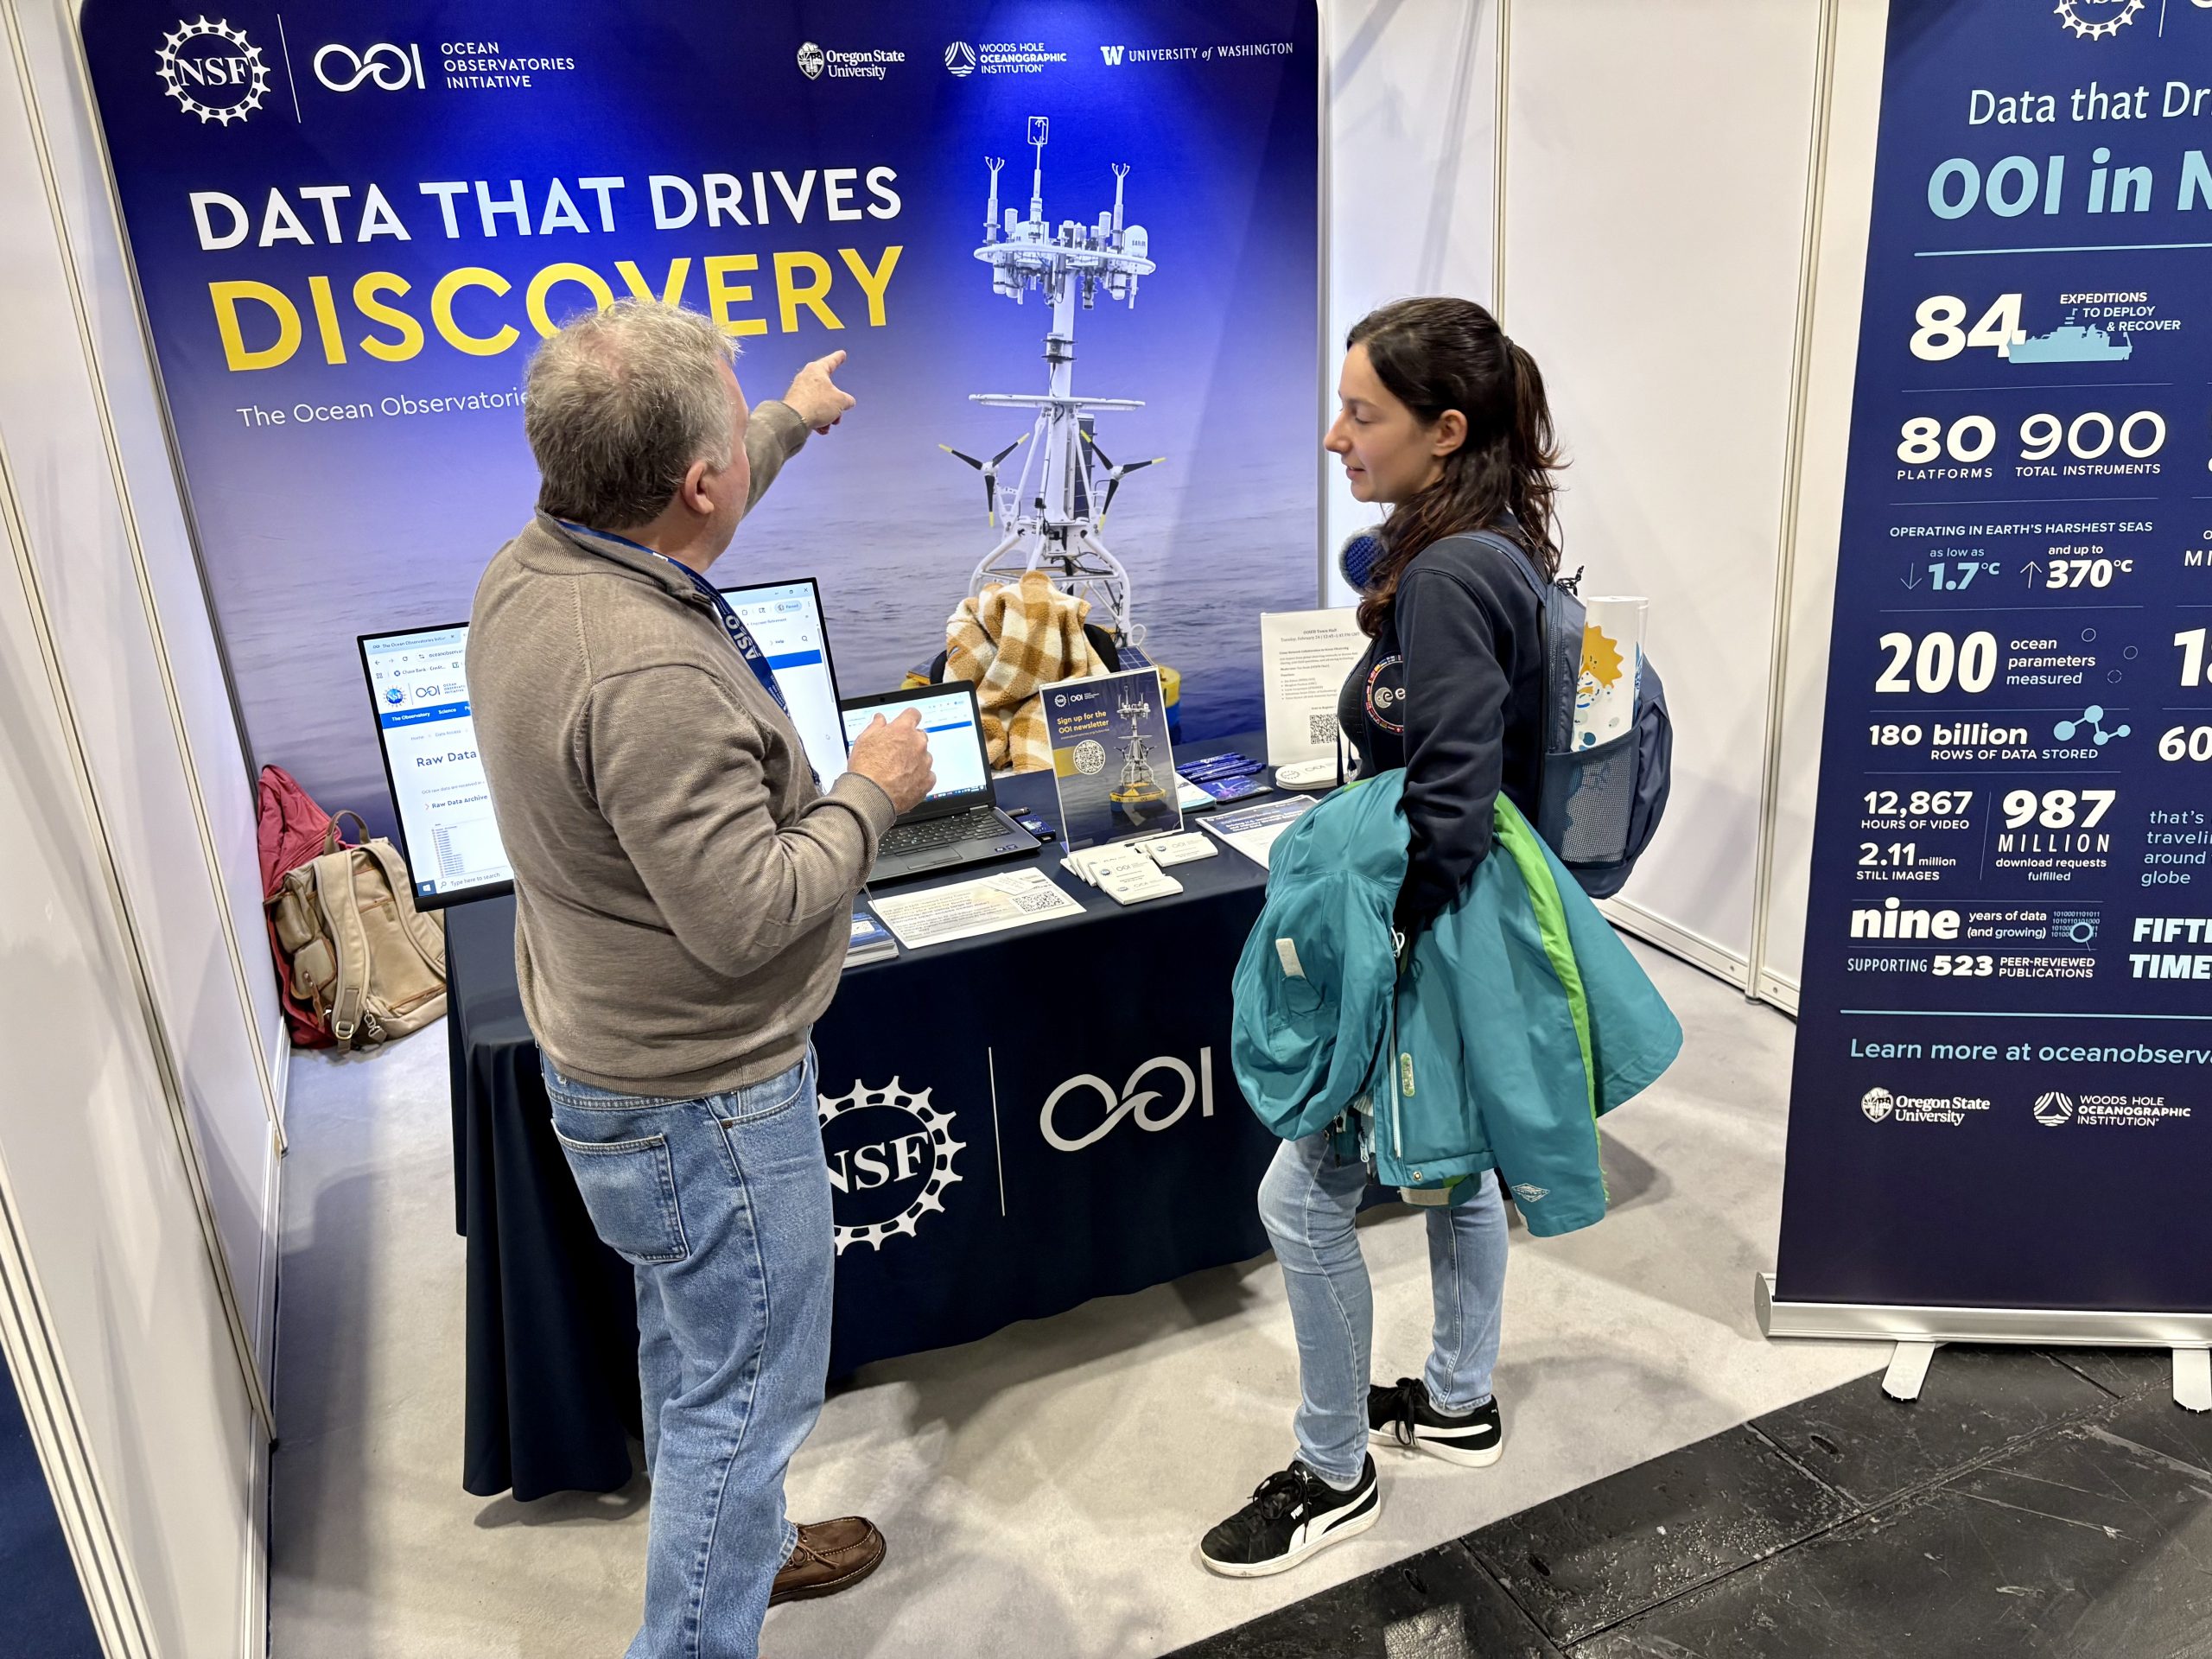 Jim Edson, Lead PI of OOI, speaks with visitors at the OOI exhibit booth during Ocean Sciences 2026. (c): Amber Coogan, WHOI[/caption]
Read More
Jim Edson, Lead PI of OOI, speaks with visitors at the OOI exhibit booth during Ocean Sciences 2026. (c): Amber Coogan, WHOI[/caption]
Read More OOIFB Town Hall Highlights the Value of Cross-Network Collaboration

At Ocean Sciences 2026 in Glasgow, Scotland, the Ocean Observatories Initiative Facility Board (OOIFB) hosted a Town Hall titled “What Questions Can We Answer Through Cross-Networking?” to explore how collaboration among global ocean observing networks can accelerate scientific discovery.
The session brought together researchers, observing system operators, and educators to discuss how partnerships across observing programs can strengthen the ocean science community. The event focused on building connections, sharing successes, and identifying ways to address common challenges related to data sharing, joint field operations, and emerging technologies.
The discussion was moderated by Dax Soule (Queens College), Chair of the OOIFB, who opened the session with a brief overview of the U.S. National Science Foundation’s Ocean Observatories Initiative and the role of the Facility Board in fostering community engagement.
A panel of experts representing major observing programs provided perspectives on collaboration across international networks:
- Jim Edson, Woods Hole Oceanographic Institution, Ocean Observatories Initiative
- Meaghan Paulson, Ocean Networks Canada
- Lucie Cocqempot, IFREMER
- Sebastiaan Swart, University of Gothenburg
- Yavor Kostov, British Antarctic Survey
Panelists emphasized the importance of improving data accessibility, coordinating field operations, and sharing technological innovations to expand the scientific impact of ocean observing systems. The conversation explored how cross-network connections can support data quality and interoperability, strengthen local community engagement, address emerging ocean observation needs, and help fill temporal and spatial gaps in ocean observations. Together, these efforts illustrate how collaboration across observing networks can enable researchers to better understand large-scale ocean processes and environmental change.
During the open Q&A session, attendees shared ideas and perspectives on strengthening connections across the observing community. The Town Hall reinforced the growing importance of collaboration in ocean observing and the role partnerships play in advancing our collective understanding of the ocean system.
[caption id="attachment_37413" align="alignnone" width="2560"]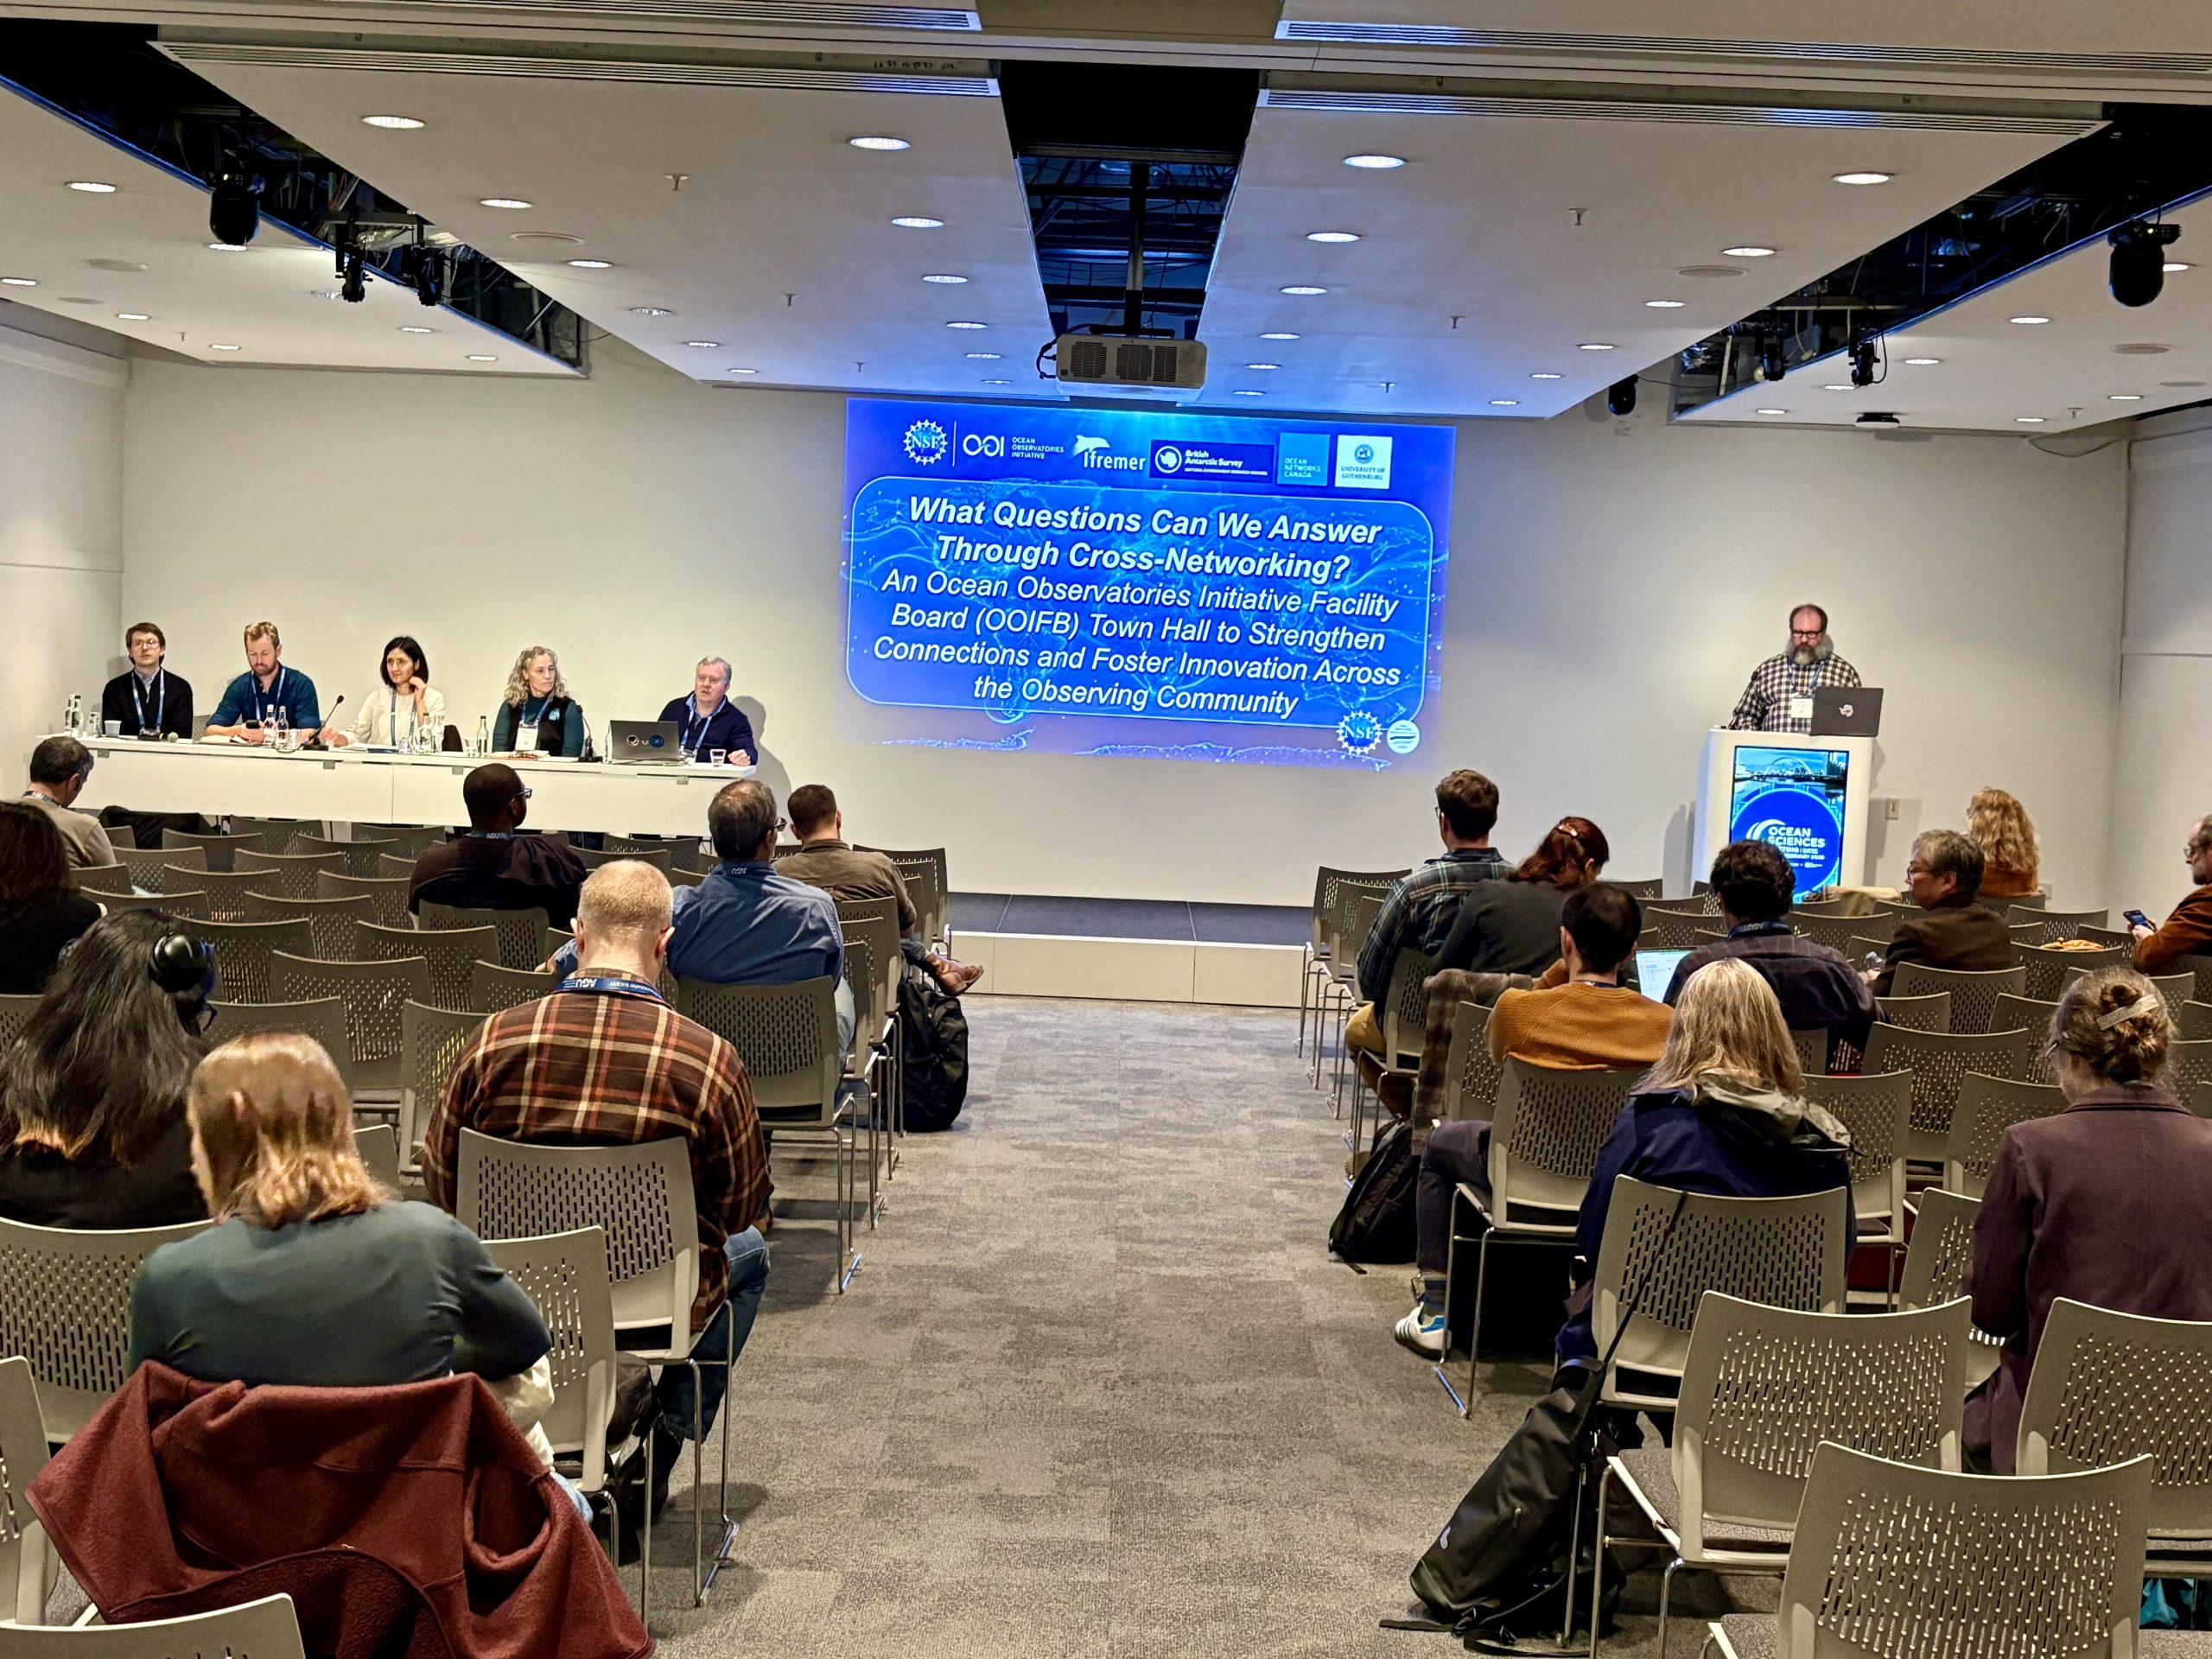 From left to right: Yavor Kostov (British Antarctic Survey); Sebastiaan Swart (University of Gothenburg); Lucie Cocqempot (IFREMER); Meaghan Paulson (Ocean Networks Canada); Jim Edson (Woods Hole Oceanographic Institution, Ocean Observatories Initiative); and Dax Soule (Queens College). (c): Amber Coogan, WHOI[/caption]
[caption id="attachment_37412" align="alignnone" width="2560"]
From left to right: Yavor Kostov (British Antarctic Survey); Sebastiaan Swart (University of Gothenburg); Lucie Cocqempot (IFREMER); Meaghan Paulson (Ocean Networks Canada); Jim Edson (Woods Hole Oceanographic Institution, Ocean Observatories Initiative); and Dax Soule (Queens College). (c): Amber Coogan, WHOI[/caption]
[caption id="attachment_37412" align="alignnone" width="2560"]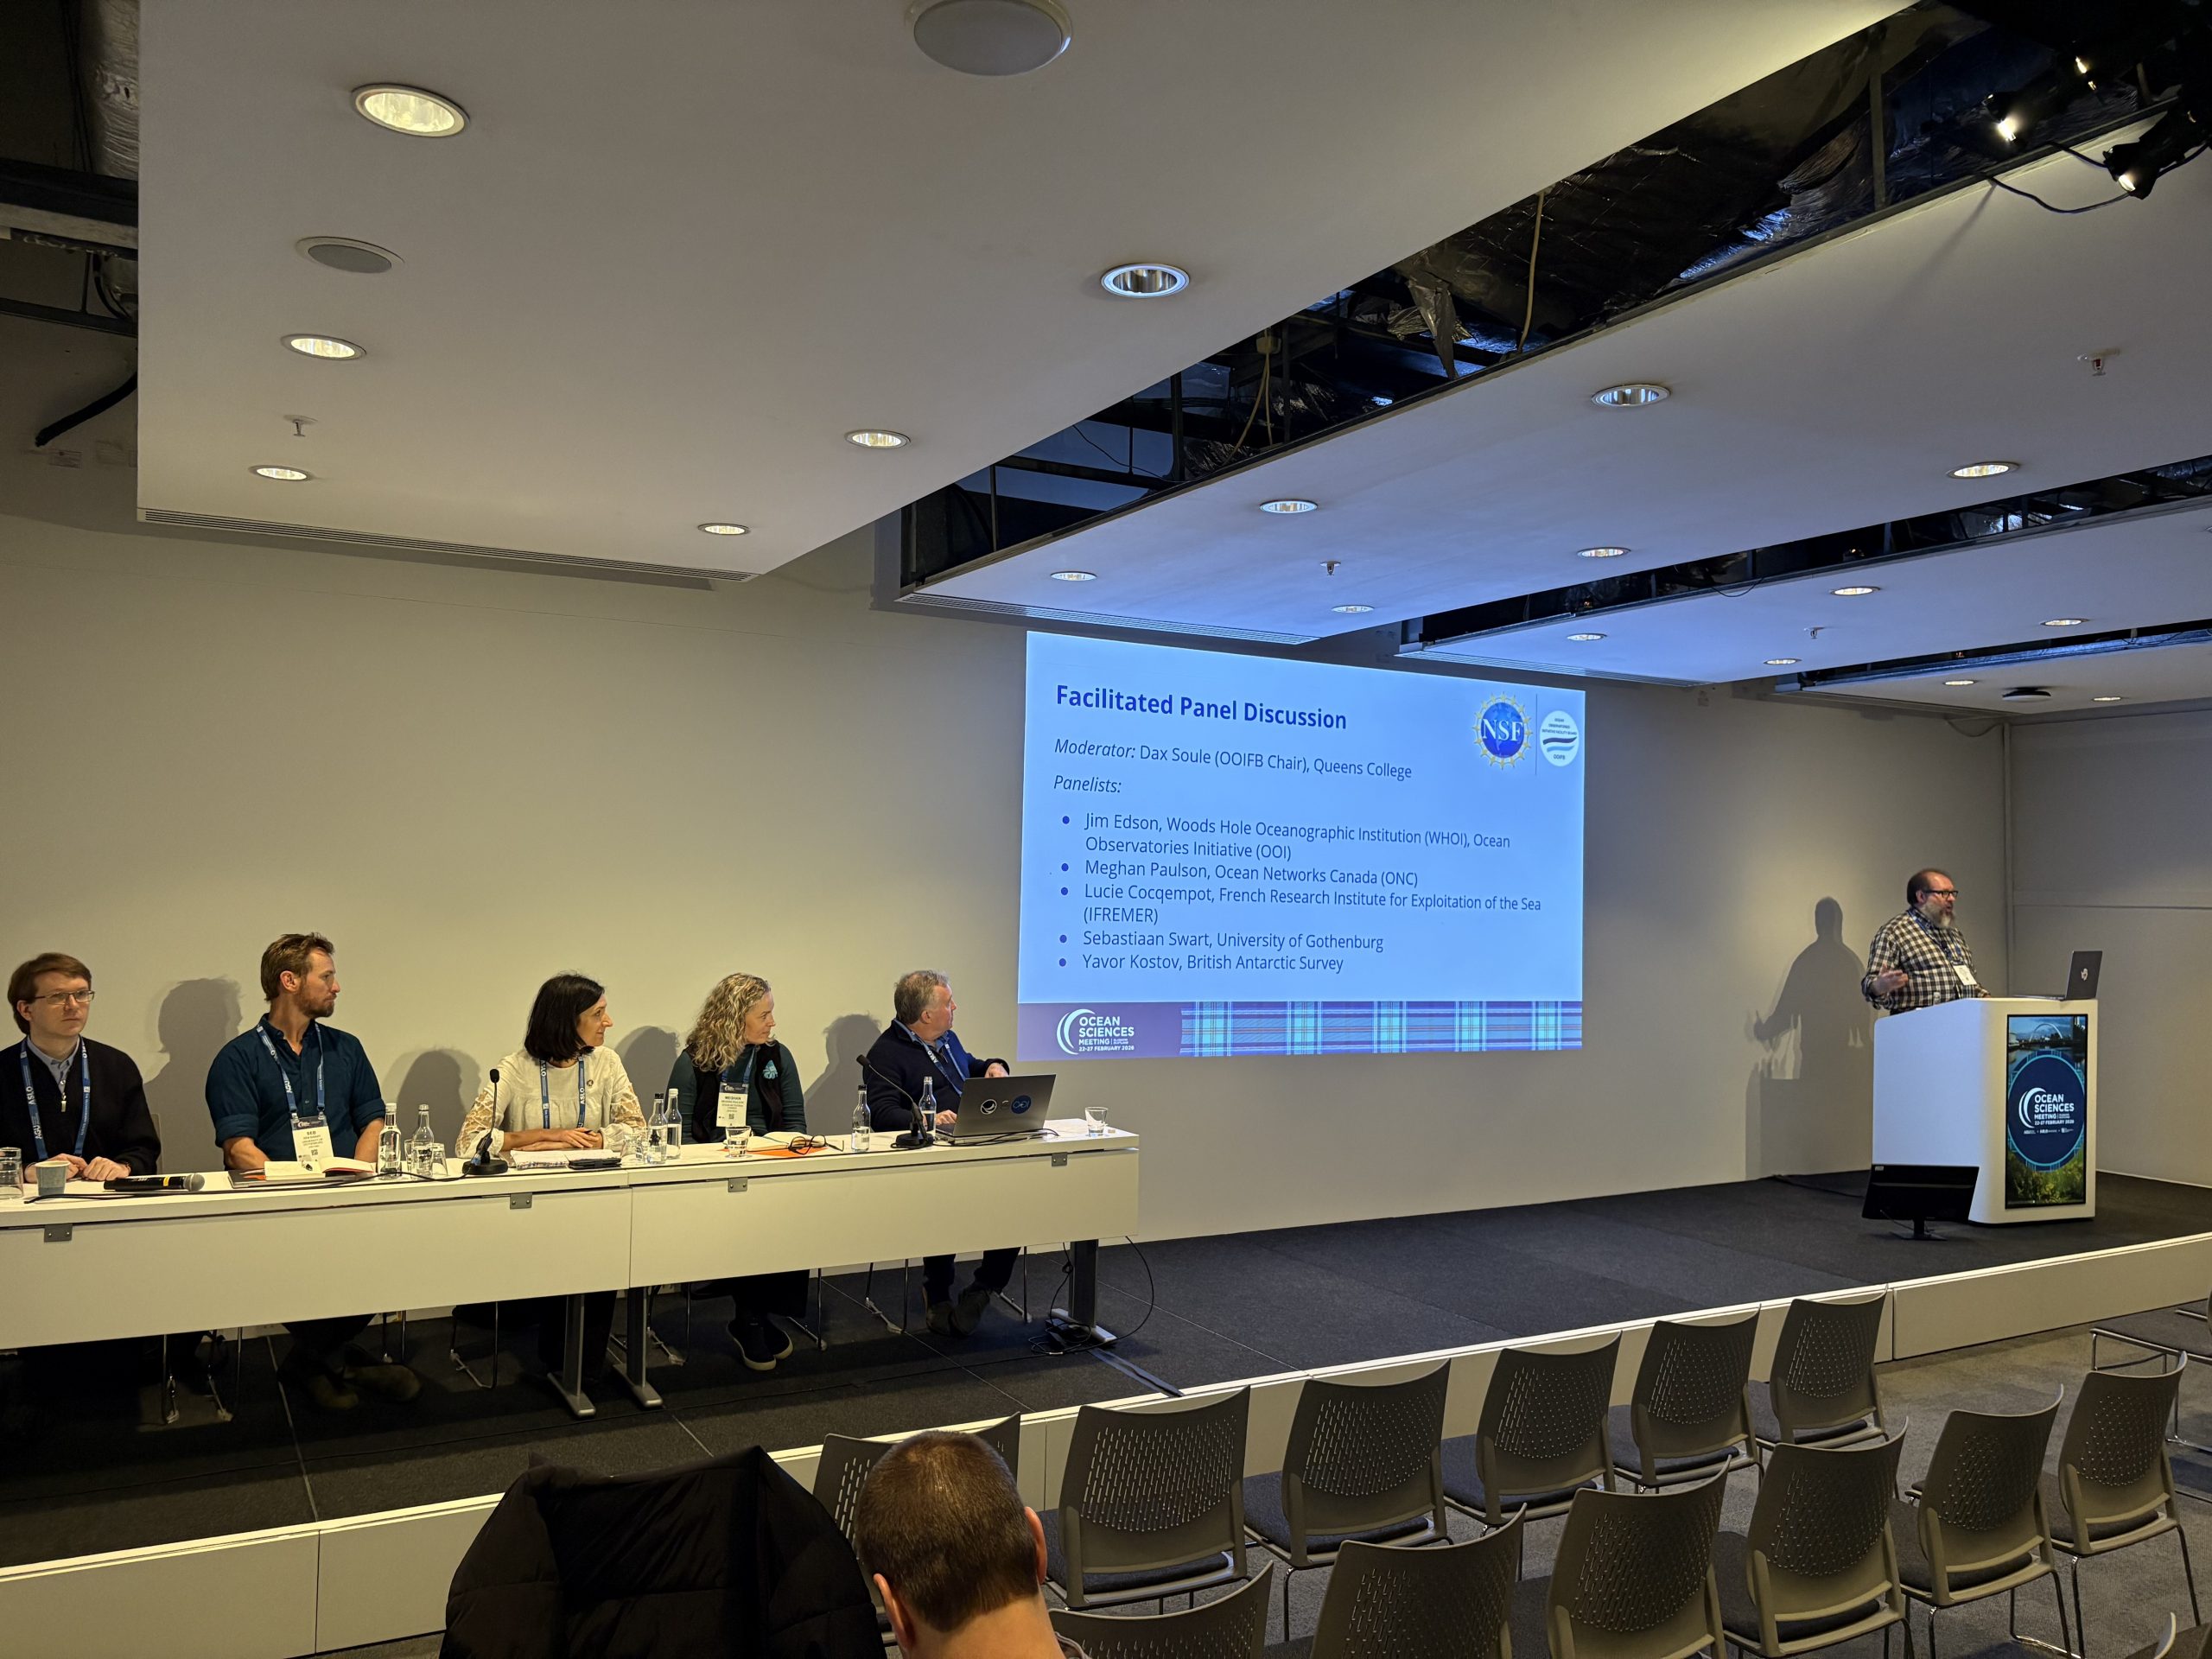 Panel discussion during the OOIFB Town Hall at Ocean Sciences 2026. (c): Amber Coogan, WHOI[/caption]
[caption id="attachment_37411" align="alignnone" width="2560"]
Panel discussion during the OOIFB Town Hall at Ocean Sciences 2026. (c): Amber Coogan, WHOI[/caption]
[caption id="attachment_37411" align="alignnone" width="2560"]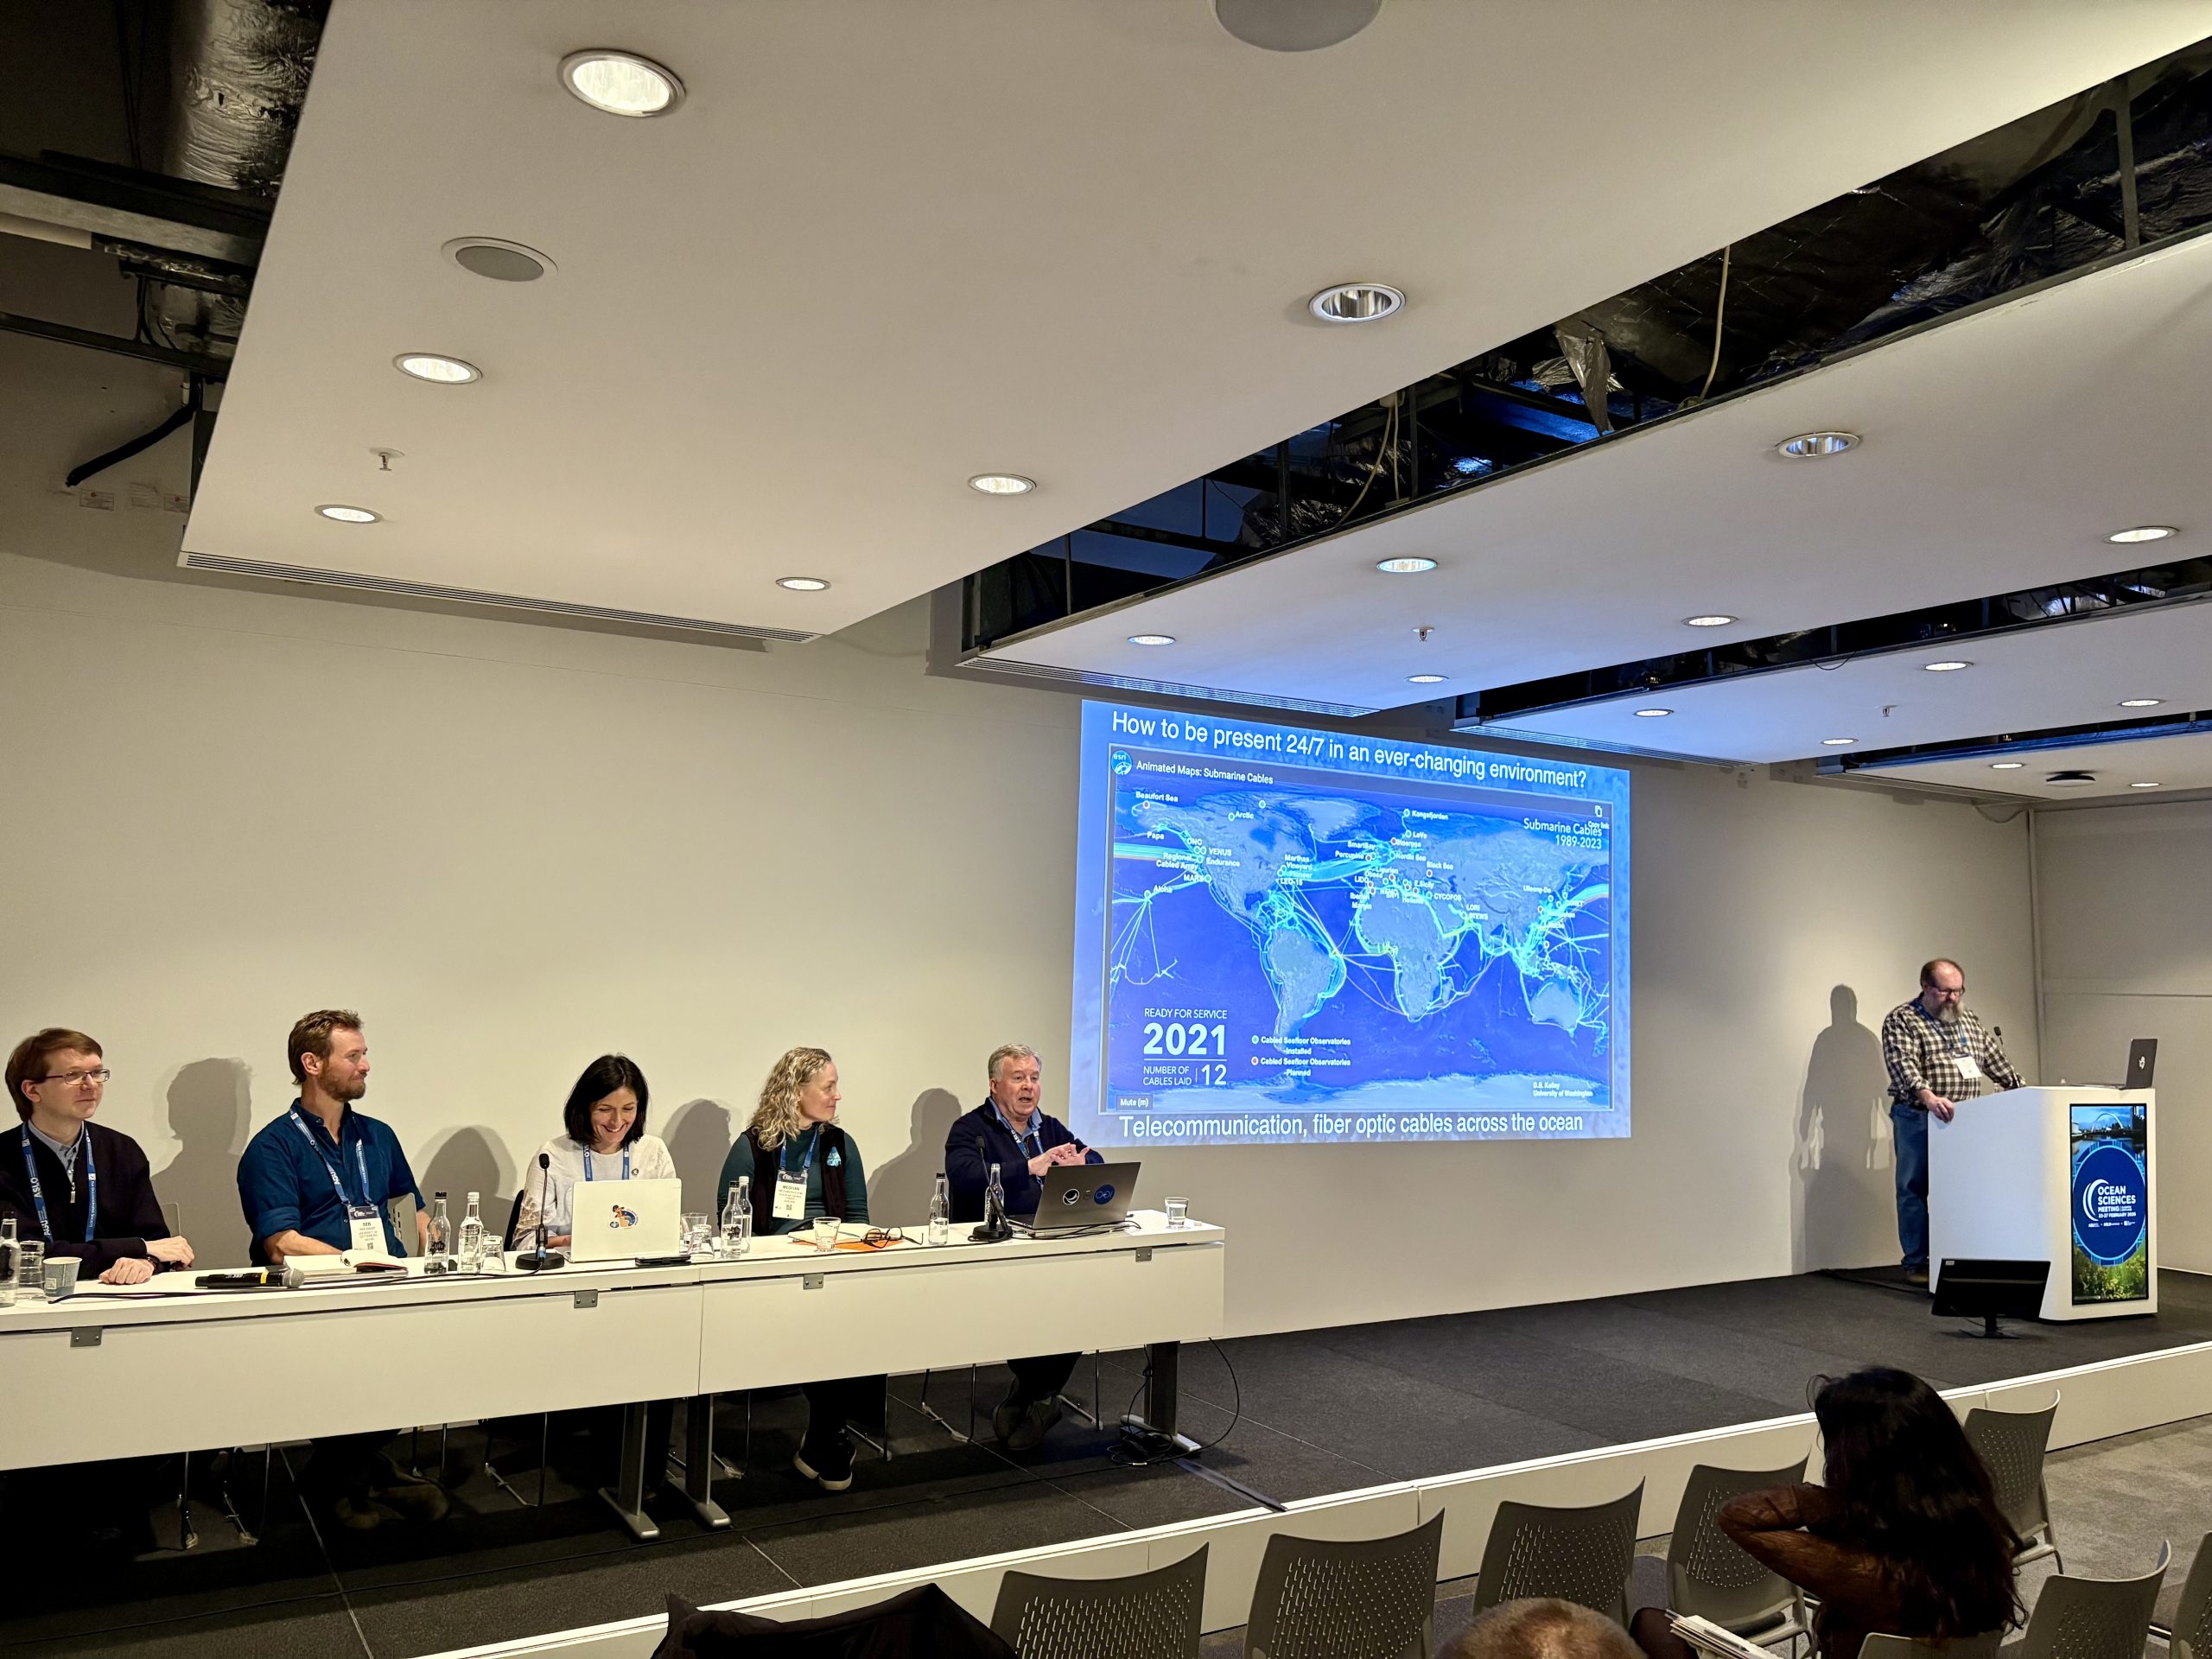 Panel discussion during the OOIFB Town Hall at Ocean Sciences 2026. (c): Amber Coogan, WHOI[/caption]
Read More
Panel discussion during the OOIFB Town Hall at Ocean Sciences 2026. (c): Amber Coogan, WHOI[/caption]
Read More OOI Regional Cabled Array Director Deb Kelley Receives 2026 Wallace S. Broecker Medal
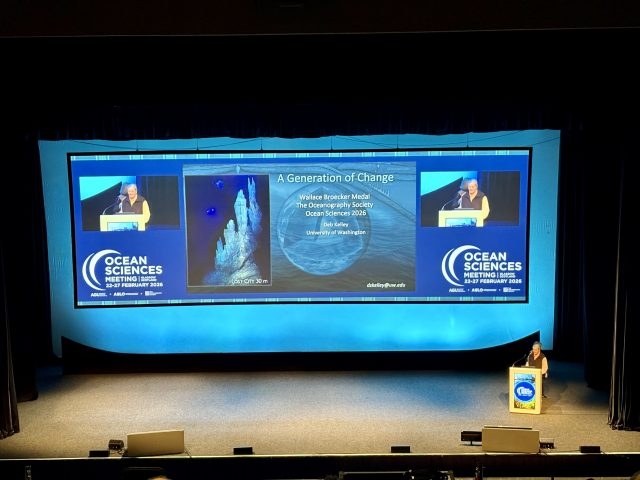
At Ocean Sciences 2026 in Glasgow, Scotland, Dr. Deb Kelley, professor of oceanography at the University of Washington and director of the U.S. National Science Foundation’s Ocean Observatories Initiative (OOI) Regional Cabled Array, was awarded the 2026 Wallace S. Broecker Medal by The Oceanography Society. The honor recognizes her significant contributions to marine geoscience and chemical oceanography, leadership in interdisciplinary and collaborative research, and her commitment to education and mentorship.
During the Ocean Sciences Awards Plenary, Kelley reflected on discoveries and experiences that have shaped her career, including the discovery of the Lost City Hydrothermal Field and transformative observations at Axial Seamount. She highlighted how real-time, open-access observations from OOI’s Regional Cabled Array have advanced understanding of subseafloor processes, hydrothermal systems, microbial life, and submarine volcanism.
Kelley also discussed the importance of community-accessible observing infrastructure and the role of experiential learning programs, such as the VISIONS expedition program, in engaging students and inspiring the next generation of ocean scientists.
Her recognition at the plenary celebrates a career dedicated to advancing ocean discovery, interdisciplinary collaboration, and education within the ocean science community.
[caption id="attachment_37428" align="alignnone" width="2560"]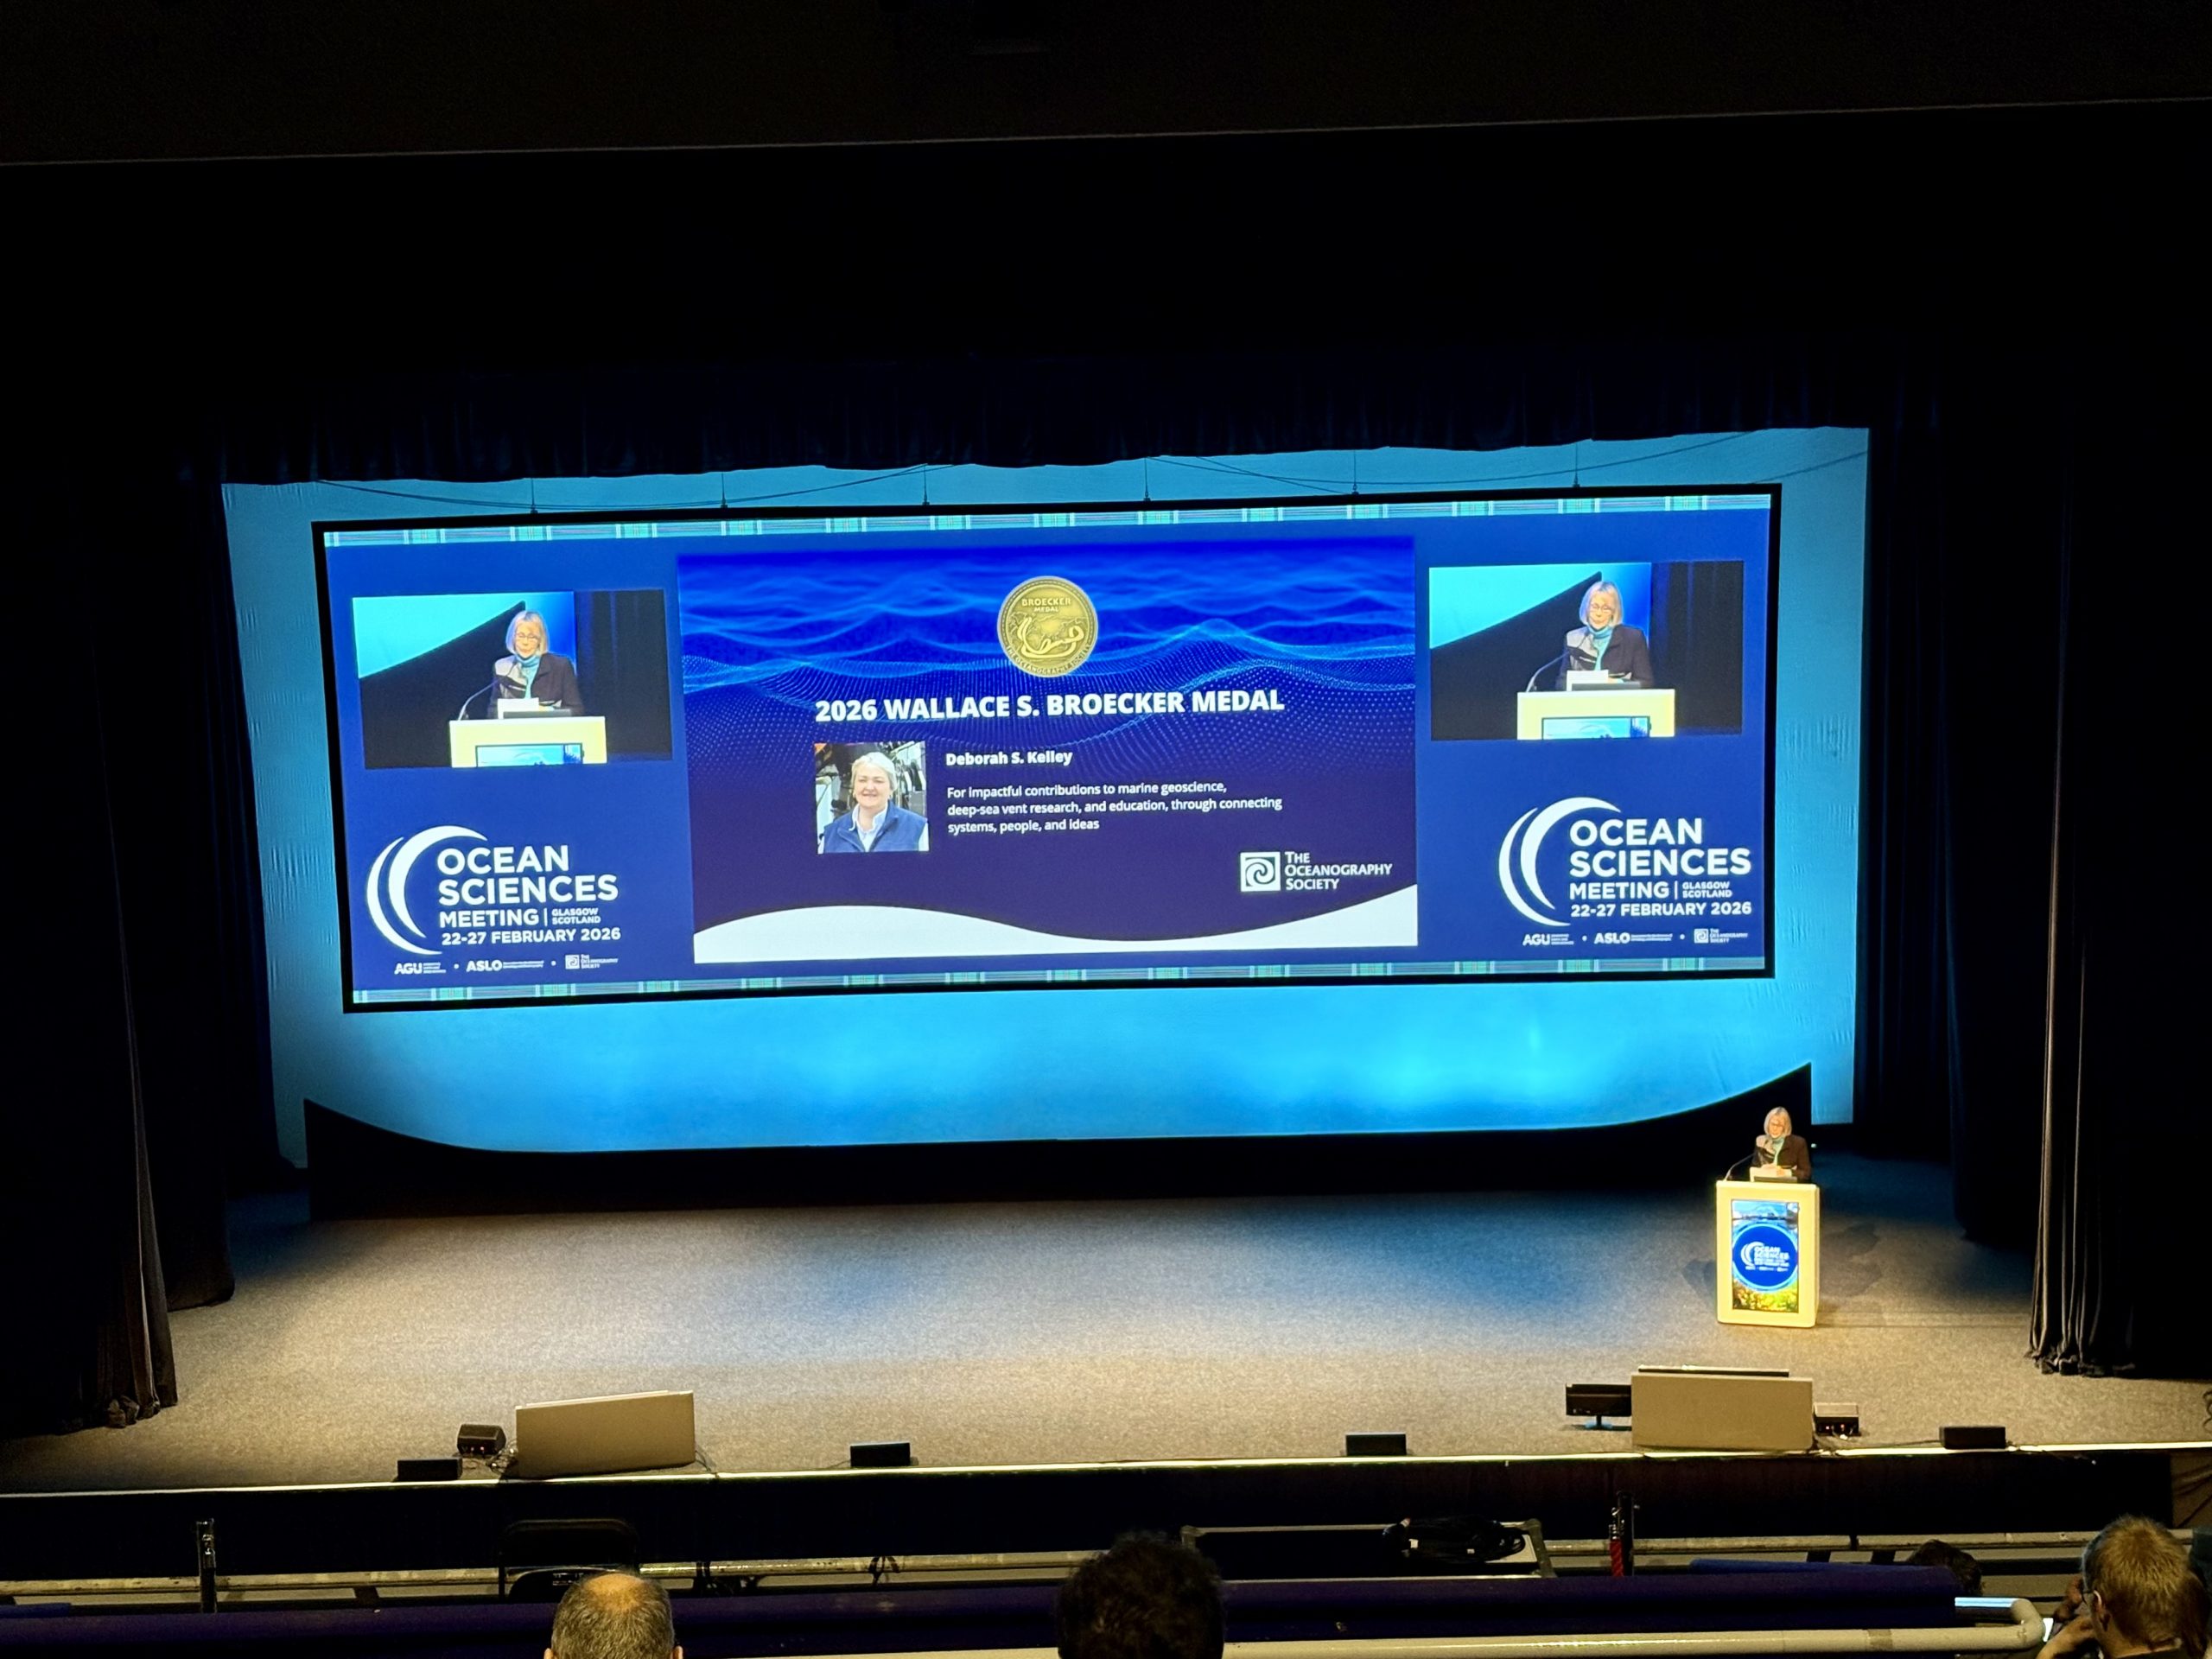 Dr. Deb Kelley, Director of OOI’s Regional Cabled Array, receives the 2026 Wallace S. Broecker Medal at Ocean Sciences 2026.[/caption]
[caption id="attachment_37429" align="alignnone" width="2560"]
Dr. Deb Kelley, Director of OOI’s Regional Cabled Array, receives the 2026 Wallace S. Broecker Medal at Ocean Sciences 2026.[/caption]
[caption id="attachment_37429" align="alignnone" width="2560"]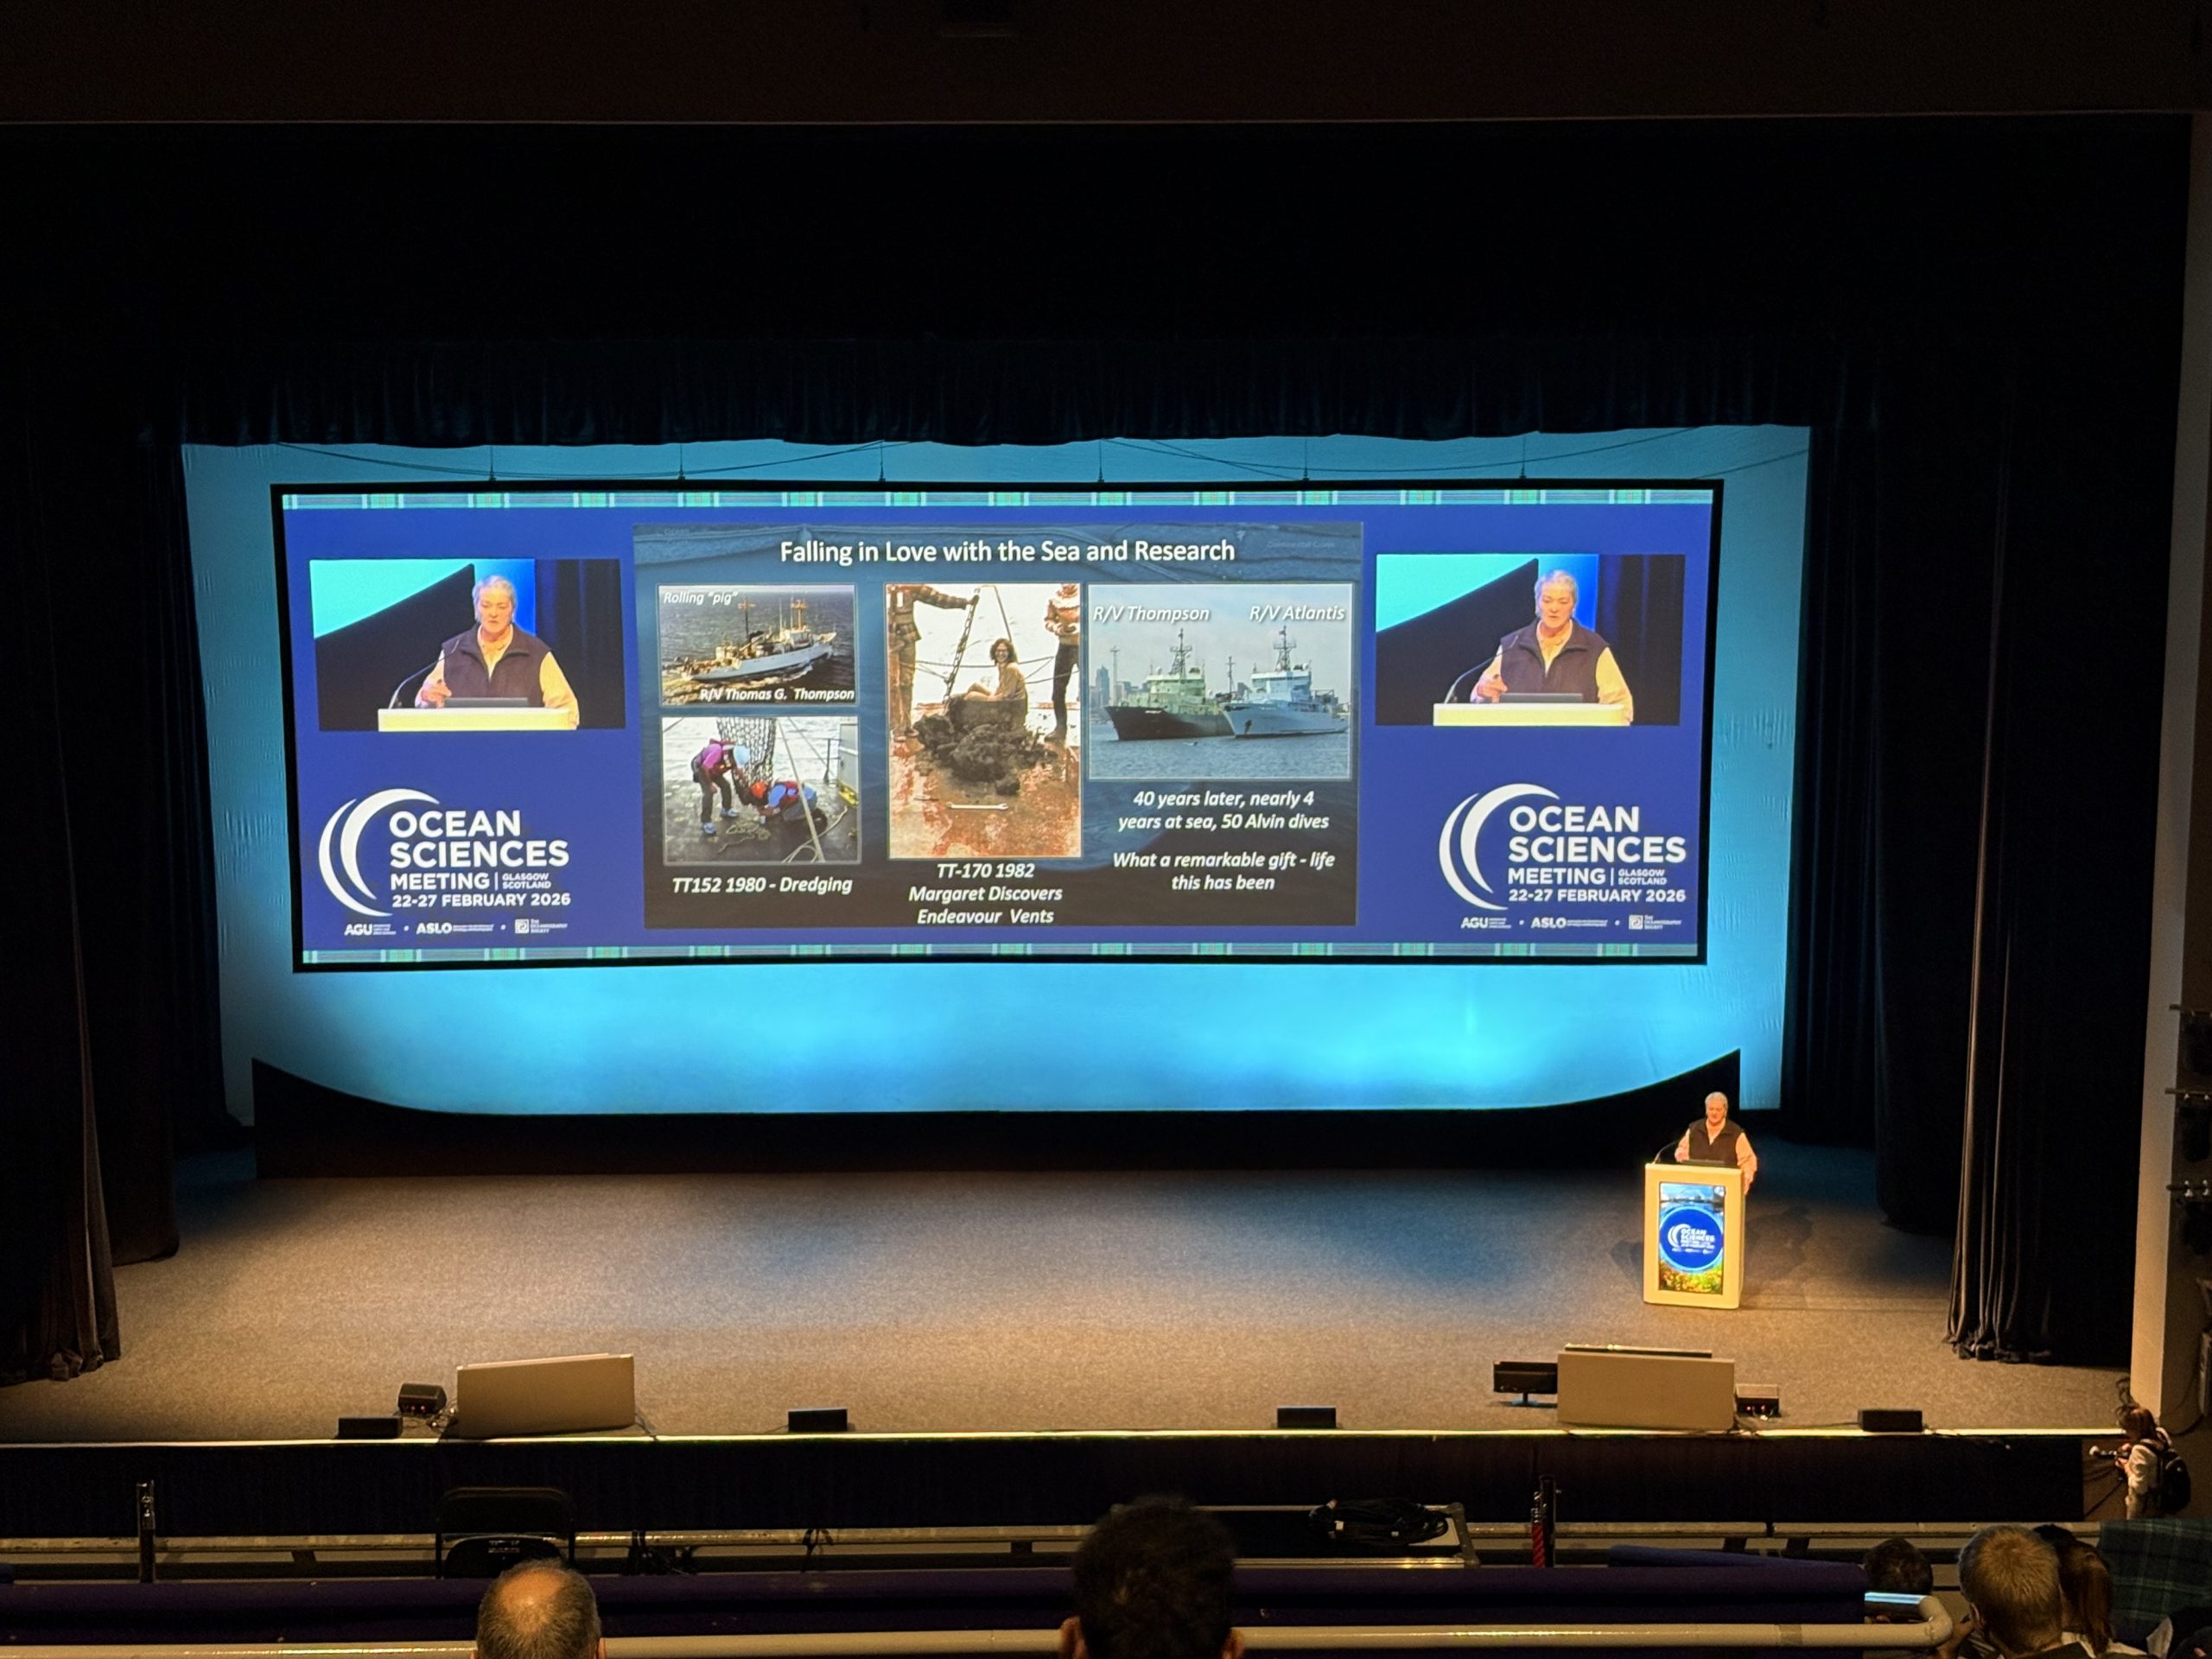 Dr. Deb Kelley presents during the Ocean Sciences Awards Plenary, reflecting on the experiences that shaped her career in ocean science.[/caption]
Read More
Dr. Deb Kelley presents during the Ocean Sciences Awards Plenary, reflecting on the experiences that shaped her career in ocean science.[/caption]
Read More OOI Community Status Update
Dear OOI Community,
We want to share an update on the operating status of the Ocean Observatories Initiative (OOI) for the current project year. The FY2026 federal appropriations process remains ongoing. Earlier this winter we worked with NSF and the array Principal Investigators to implement an adjusted operating plan, documented through an Annual Work Plan Addendum, that preserves key scientific capability within available funding.
Since its inception, the OOI has been a sustained ocean observing facility designed to provide long term, open access measurements and infrastructure for the research community. Now in its second decade, the OOI has grown into an important community resource that supports discovery, advances research, facilitates technology development, and fosters collaboration across the ocean community. Our priority is to protect the integrity of the long-term data record and ensure continued access to core observing capabilities during this period of fiscal constraint.
Under the updated operating plan, OOI will maintain core capabilities and community access to observations:
- Continued delivery and distribution of data from all active instruments, including real time data where available, along with the full historical data record maintained by the Data Center.
- Continued operation of the Regional Cabled Array to provide persistent seafloor access with a maintenance cruise scheduled for the summer of 2026.
- Continued operation of the Pioneer Mid Atlantic Bight Array with two service cruises in the late spring and fall of 2026 with refurbished infrastructure.
- Continued subsurface observations at Station Papa, with servicing and sampling schedules adjusted to extend asset lifetime while maintaining the time series. This will include continued collaboration with NOAA/PMEL and their surface buoy.
- Continued observations at the Irminger Sea Array, with a limited maintenance cruise in spring to early summer of 2026, and sampling schedules adjusted to extend asset lifetime while maintaining the time series.
- Limited Endurance Array capability, including retention and maintenance of a surface mooring on the Oregon shelf and targeted glider operations to preserve cross shelf observations. Short maintenance cruises are scheduled for last spring and fall of 2026.
- Targeted glider and AUV missions where they provide the highest scientific return.
- Continued investment in Data Services, including Data Explorer improvements, data processing tools and research ready data sets.
- Ongoing permitting, reporting, and cybersecurity compliance activities.
These priorities reflect choices to safeguard time series continuity and community data services while operating within constrained resources.
As a result of the constrained budget, some activities are reduced in cadence or scope relative to prior years. These adjustments are designed to extend asset life and preserve scientific value while minimizing long-term impacts to the observing system. We recognize this may affect studies that depend on dense sampling, rapid turnaround field operations, certain regional coverage, near real-time data, cross-shelf observations, and sustained time series. We are working closely with NSF and the implementing organizations to manage these impacts strategically and maintain flexibility should funding conditions continue to improve.
Even within these constraints, OOI remains fully operational as a national observing facility. Our focus is continuity, reliability, and service to the community.
In closing, we encourage you to partner with us in demonstrating the value and impact of OOI by including it in your proposals, publications, presentations, and conversations with colleagues. Your engagement is vital to demonstrate the scientific impact and wide-ranging applications enabled by the OOI, underscoring its importance as a resource for the oceanographic community.
For any questions related to the OOI, please reach out to the Leadership Team at ooi@whoi.edu.
Sincerely,
The OOI Team
Disclaimer: Any opinions, findings and conclusions or recommendations expressed in this material are those of the authors and do not necessarily reflect the views of the National Science Foundation.
Read More