
News
OOI Contributions Featured at 2025 Slocum Glider User’s Conference & Sentinel Launch

The global oceanographic community gathered in Woods Hole October 7–9 for the 2025 Slocum Glider User’s Conference. The meeting convened users, scientists, engineers, and mission planners to advance next-generation autonomous ocean observing.
For OOI, the event provided a timely forum to share nearly a decade of experience integrating Slocum gliders into sustained, basin-scale observing. OOI has deployed Slocums to collect high-resolution profiles of temperature, salinity, oxygen, chlorophyll, nitrate, optical properties, and currents across energetic and climatically sensitive regions. These long records (gathered in all seasons and weather) have supported research on boundary currents, carbon cycling, marine heatwaves, ecosystem change, and storm-ocean interaction.
The OOI Team presented two posters at the conference, one documenting eight years of glider operations at the OOI Pioneer New England Shelf Array and the other describing the operational approach and initial outcomes from the Pioneer Mid-Atlantic Bight Array, which was started in April 2004. Diana Wickman presented a talk on “Tips, Tricks and Best Practices” for long-duration glider missions, an area where OOI has unique expertise.
The conference week concluded with the October 10 launch of the Sentinel Mission, the first attempt to autonomously circumnavigate the globe by AUV, using REDWING, a Slocum Sentinel Glider.
[caption id="attachment_37105" align="alignnone" width="2560"] Diana Wickman (WHOI) gives a tour of the Glider Lab at LOSOS. © Andy Robinson / WHOI[/caption]
[caption id="attachment_37106" align="alignnone" width="2560"] Tour of the Glider Lab at LOSOS. © Andy Robinson / WHOI[/caption]
[caption id="attachment_37101" align="alignnone" width="1920"]
Diana Wickman (WHOI) gives a tour of the Glider Lab at LOSOS. © Andy Robinson / WHOI[/caption]
[caption id="attachment_37106" align="alignnone" width="2560"] Tour of the Glider Lab at LOSOS. © Andy Robinson / WHOI[/caption]
[caption id="attachment_37101" align="alignnone" width="1920"] Peter de Menocal (WHOI) speaks at Sentinel Mission Launch event. © Amber Coogan / WHOI[/caption]
![]()
![]()
PAMPortal Highlights OOI Acoustic Data

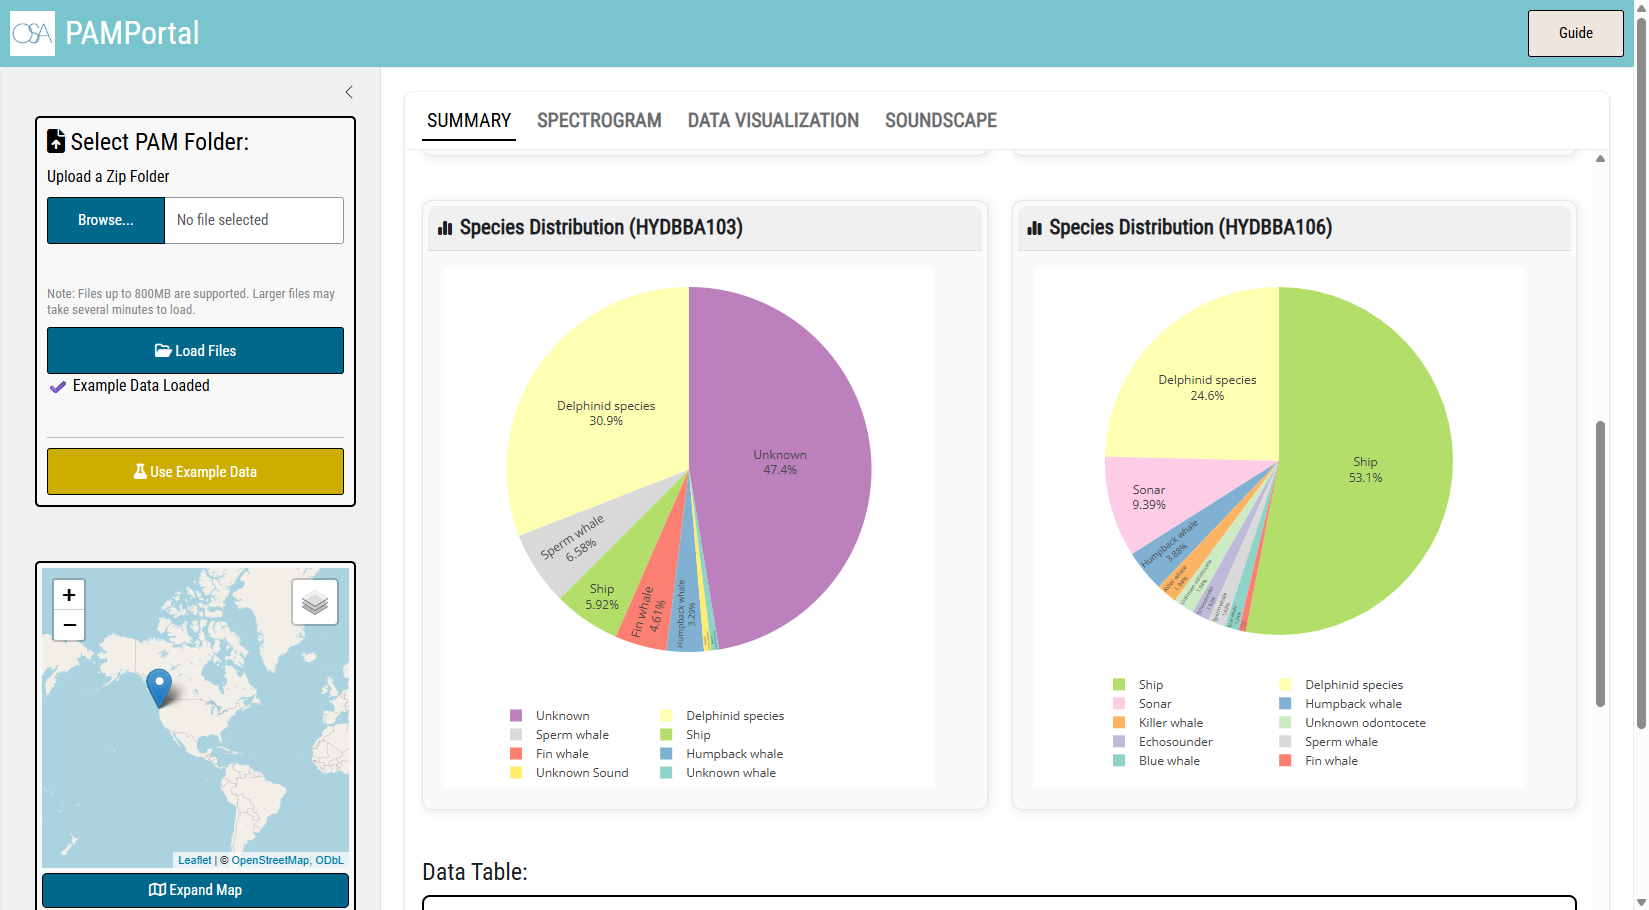
OOI data are now featured in PAMPortal, a new cloud-based tool that makes it easier for researchers to explore acoustic detections and soundscape metrics. PAMPortal integrates the passive acoustic analysis workflow using PAMGuard and PAMpal as part of its internal processing services (rather than as general public support tool for independent PAMGuard or PAMpal processing). This setup allows users to engage directly with marine mammal detection products and acoustic summaries.
For the OOI community, this connection is especially exciting. The tool’s built-in example dataset is drawn from OOI acoustic data. By selecting “Use Example Data,” users will see an informational card that acknowledges OOI and links to additional resources, providing a clear entry point into OOI’s rich acoustic archive.
By presenting OOI data in an accessible, interactive format, PAMPortal aims to make it easier to work with complex acoustic datasets and encourages broader use of OOI resources in research and discovery.
Wave Energy Converter Project Moves Toward At-Sea Testing

OOI, in partnership with the U.S. Department of Energy’s (DOE’s) Water Power Technologies Office (WPTO) is preparing to deploy a wave energy converter (WEC) device on the Pioneer MAB central surface mooring. The project aims to demonstrate how wave energy can provide reliable, renewable power for sustained ocean observation.
A recent visit brought together the team, which is comprised of experts from OOI, WPTO, Sandia National Laboratories, the National Renewable Energy Laboratory (NREL), Evergreen Innovations, Johns Hopkins University, East Carolina University, and Woods Hole Oceanographic Institution (WHOI) to focus on engineering validation for the Pioneer WEC, a critical step before at-sea testing later in the fall.
During the visit, the team carried out subsystem testing, integrated the WEC with the buoy, assembled the full system, and tested it under varied scenarios. This rigorous preparation is crucial for de-risking the upcoming deployment.
This project represents an important step toward persistent ocean observing systems. By reducing reliance on ship-based servicing and enabling longer-term autonomous operation, wave energy has the potential to transform how sustained ocean science is conducted.
[caption id="attachment_37035" align="alignnone" width="1813"]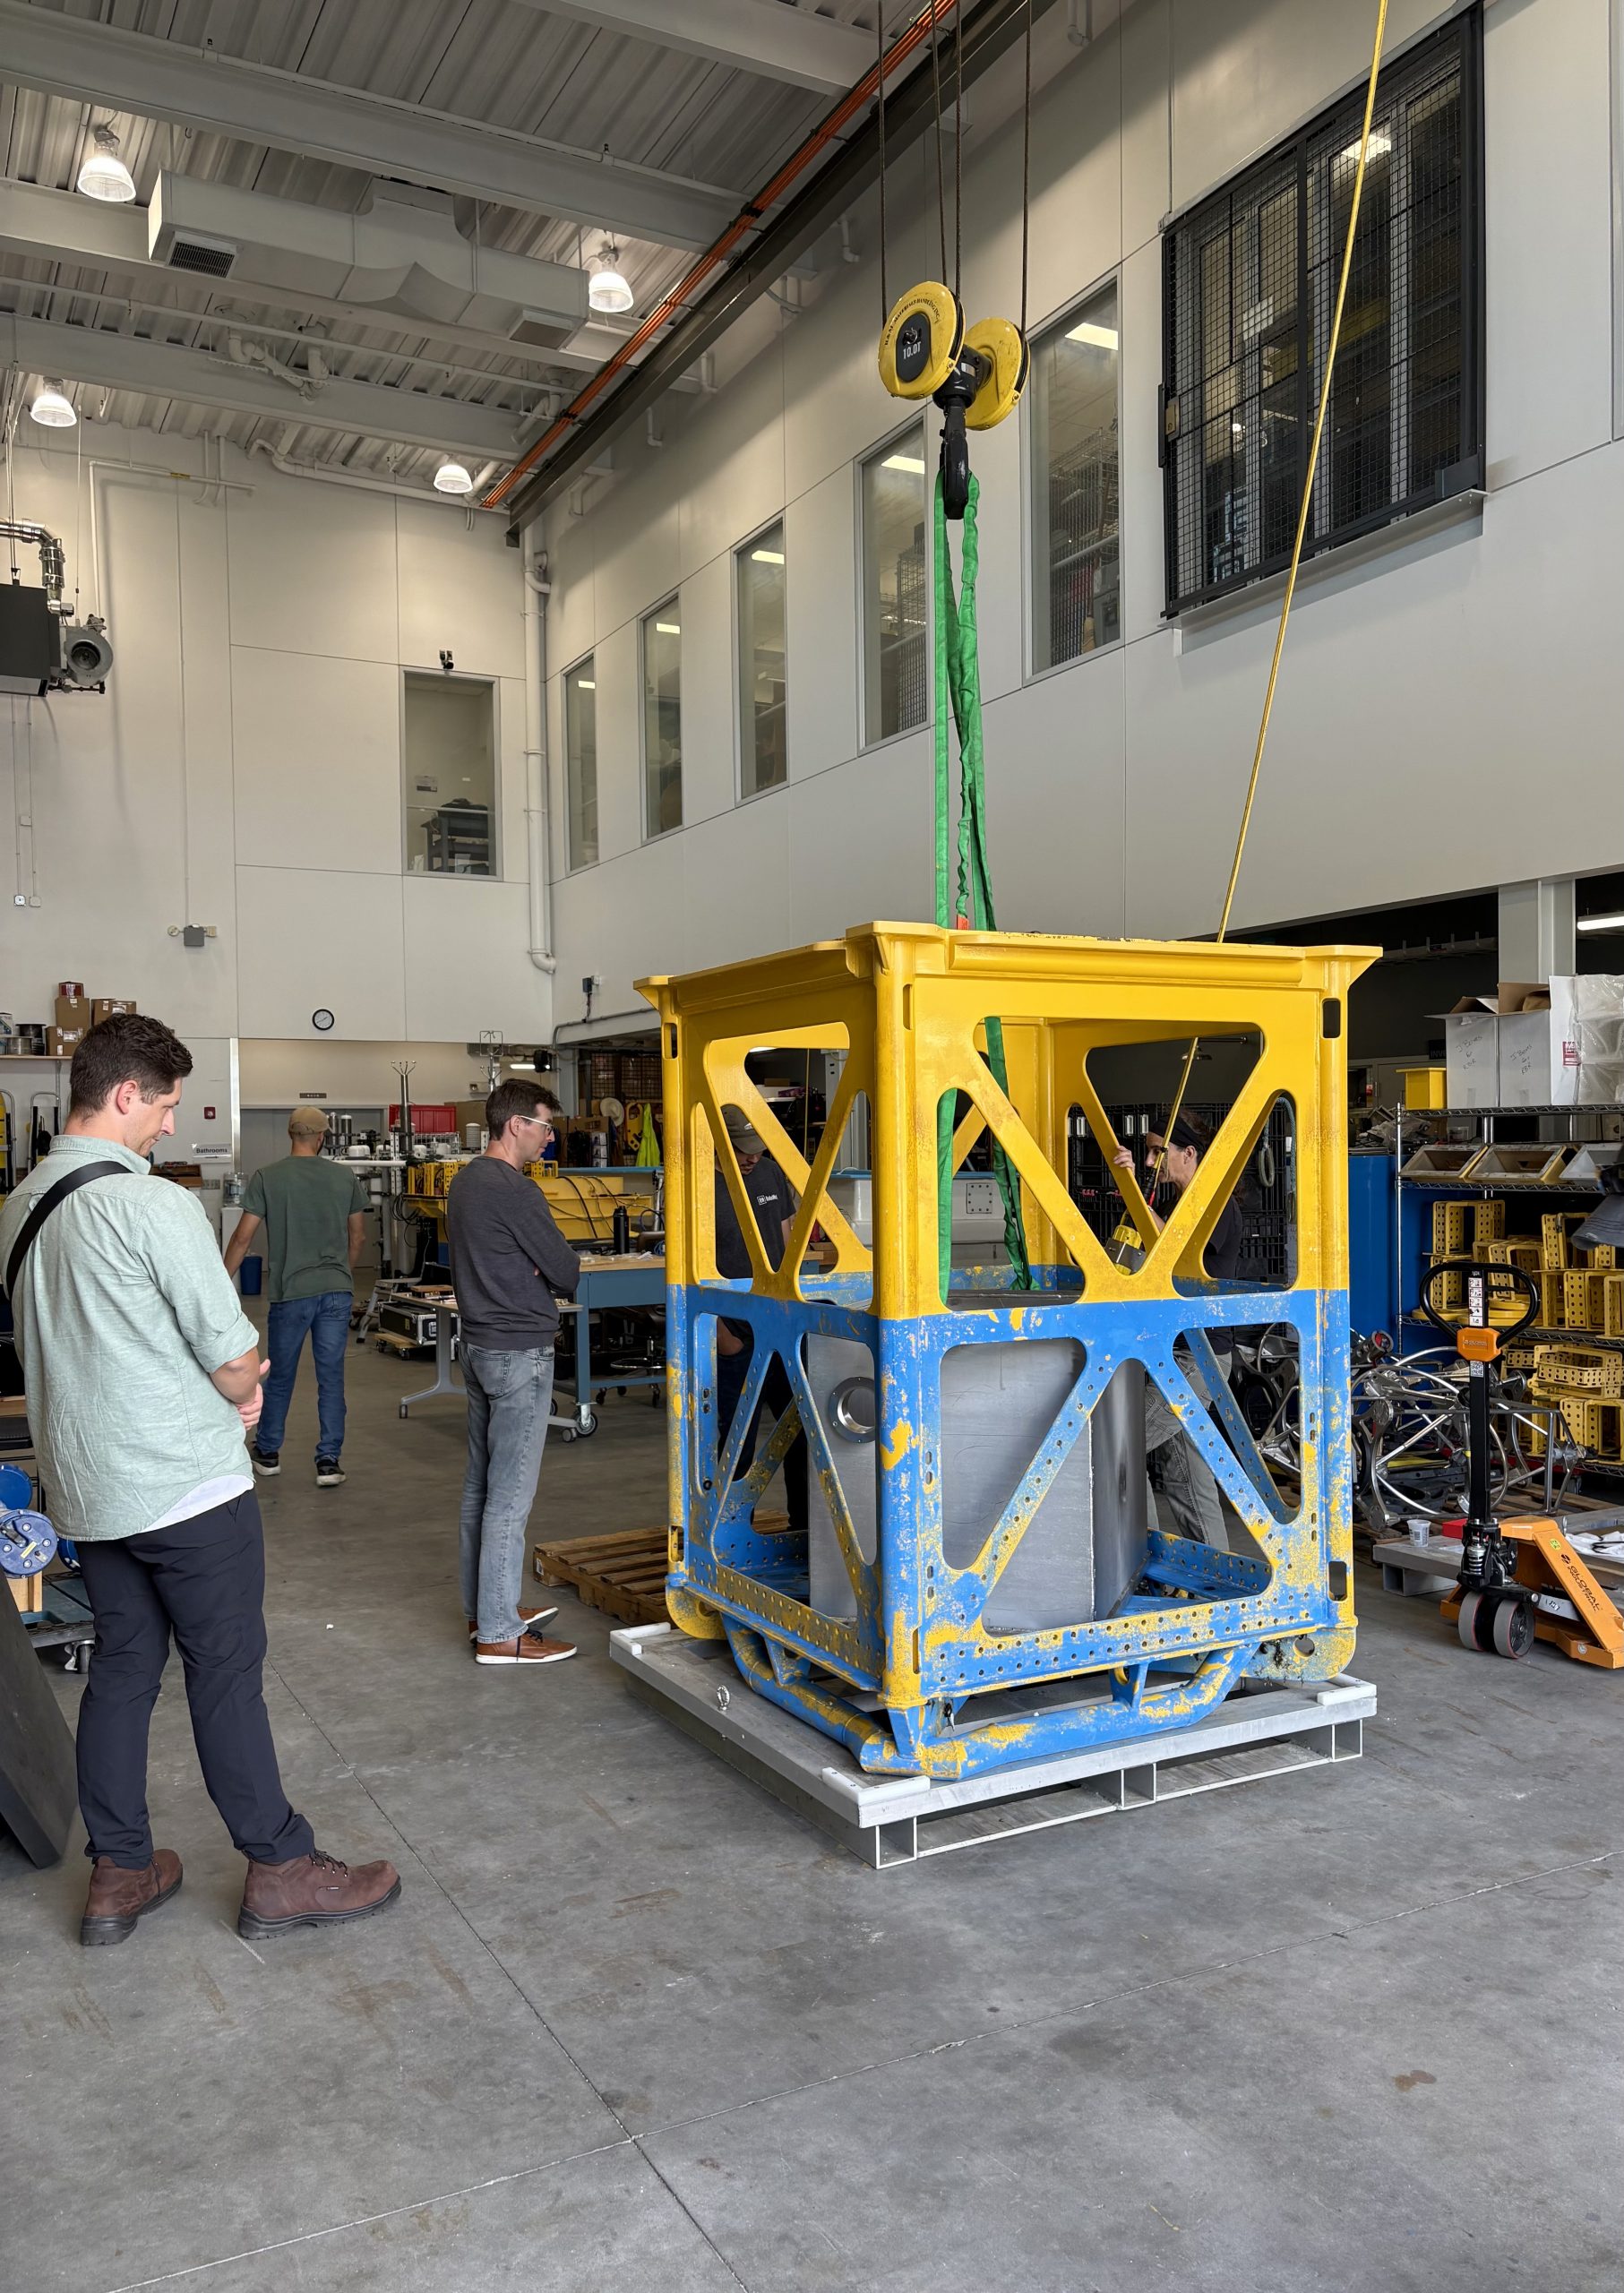 Taylor Mankle, NREL, and Johannes Spinneken, Evergreen Innovations, inspect the WEC housing installed in the buoy base. © Amber Coogan, WHOI[/caption]
[caption id="attachment_37037" align="alignnone" width="2560"]
Taylor Mankle, NREL, and Johannes Spinneken, Evergreen Innovations, inspect the WEC housing installed in the buoy base. © Amber Coogan, WHOI[/caption]
[caption id="attachment_37037" align="alignnone" width="2560"]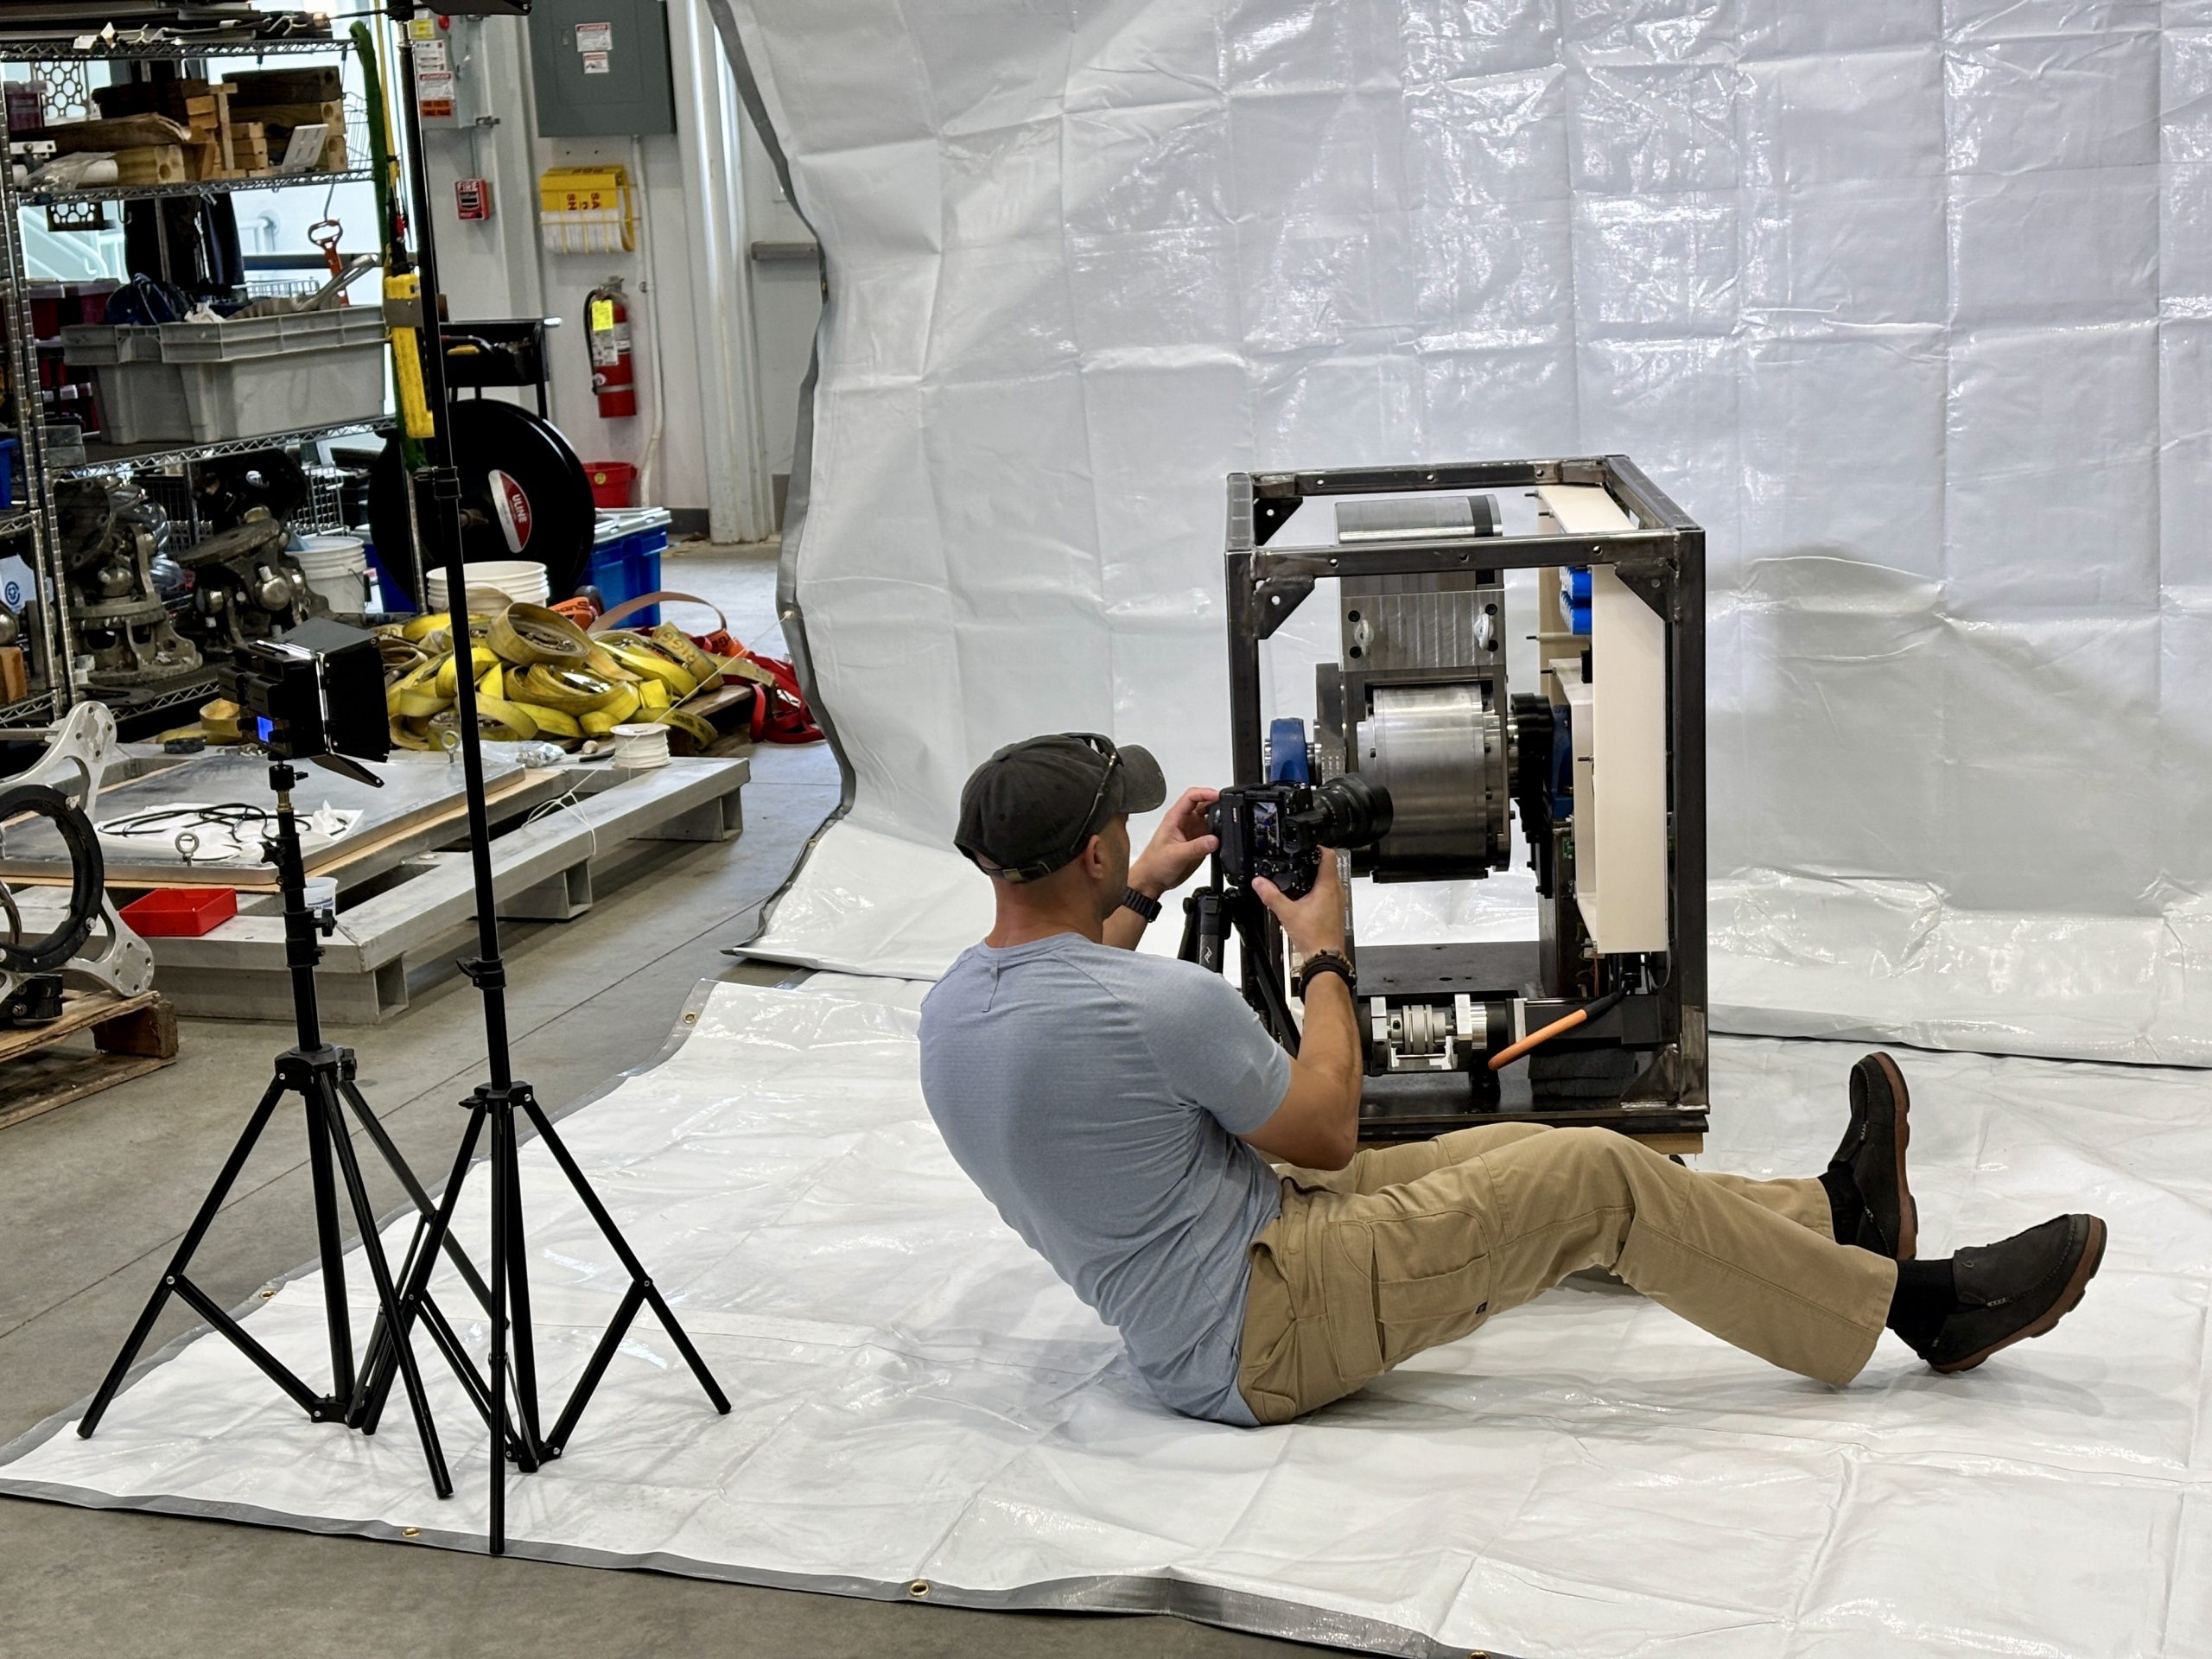 Joshua Bauer, NREL, captures still images for a 360° photographic reconstruction of WEC. © Ken Kostel, WHOI[/caption]
[caption id="attachment_37038" align="alignnone" width="2560"]
Joshua Bauer, NREL, captures still images for a 360° photographic reconstruction of WEC. © Ken Kostel, WHOI[/caption]
[caption id="attachment_37038" align="alignnone" width="2560"]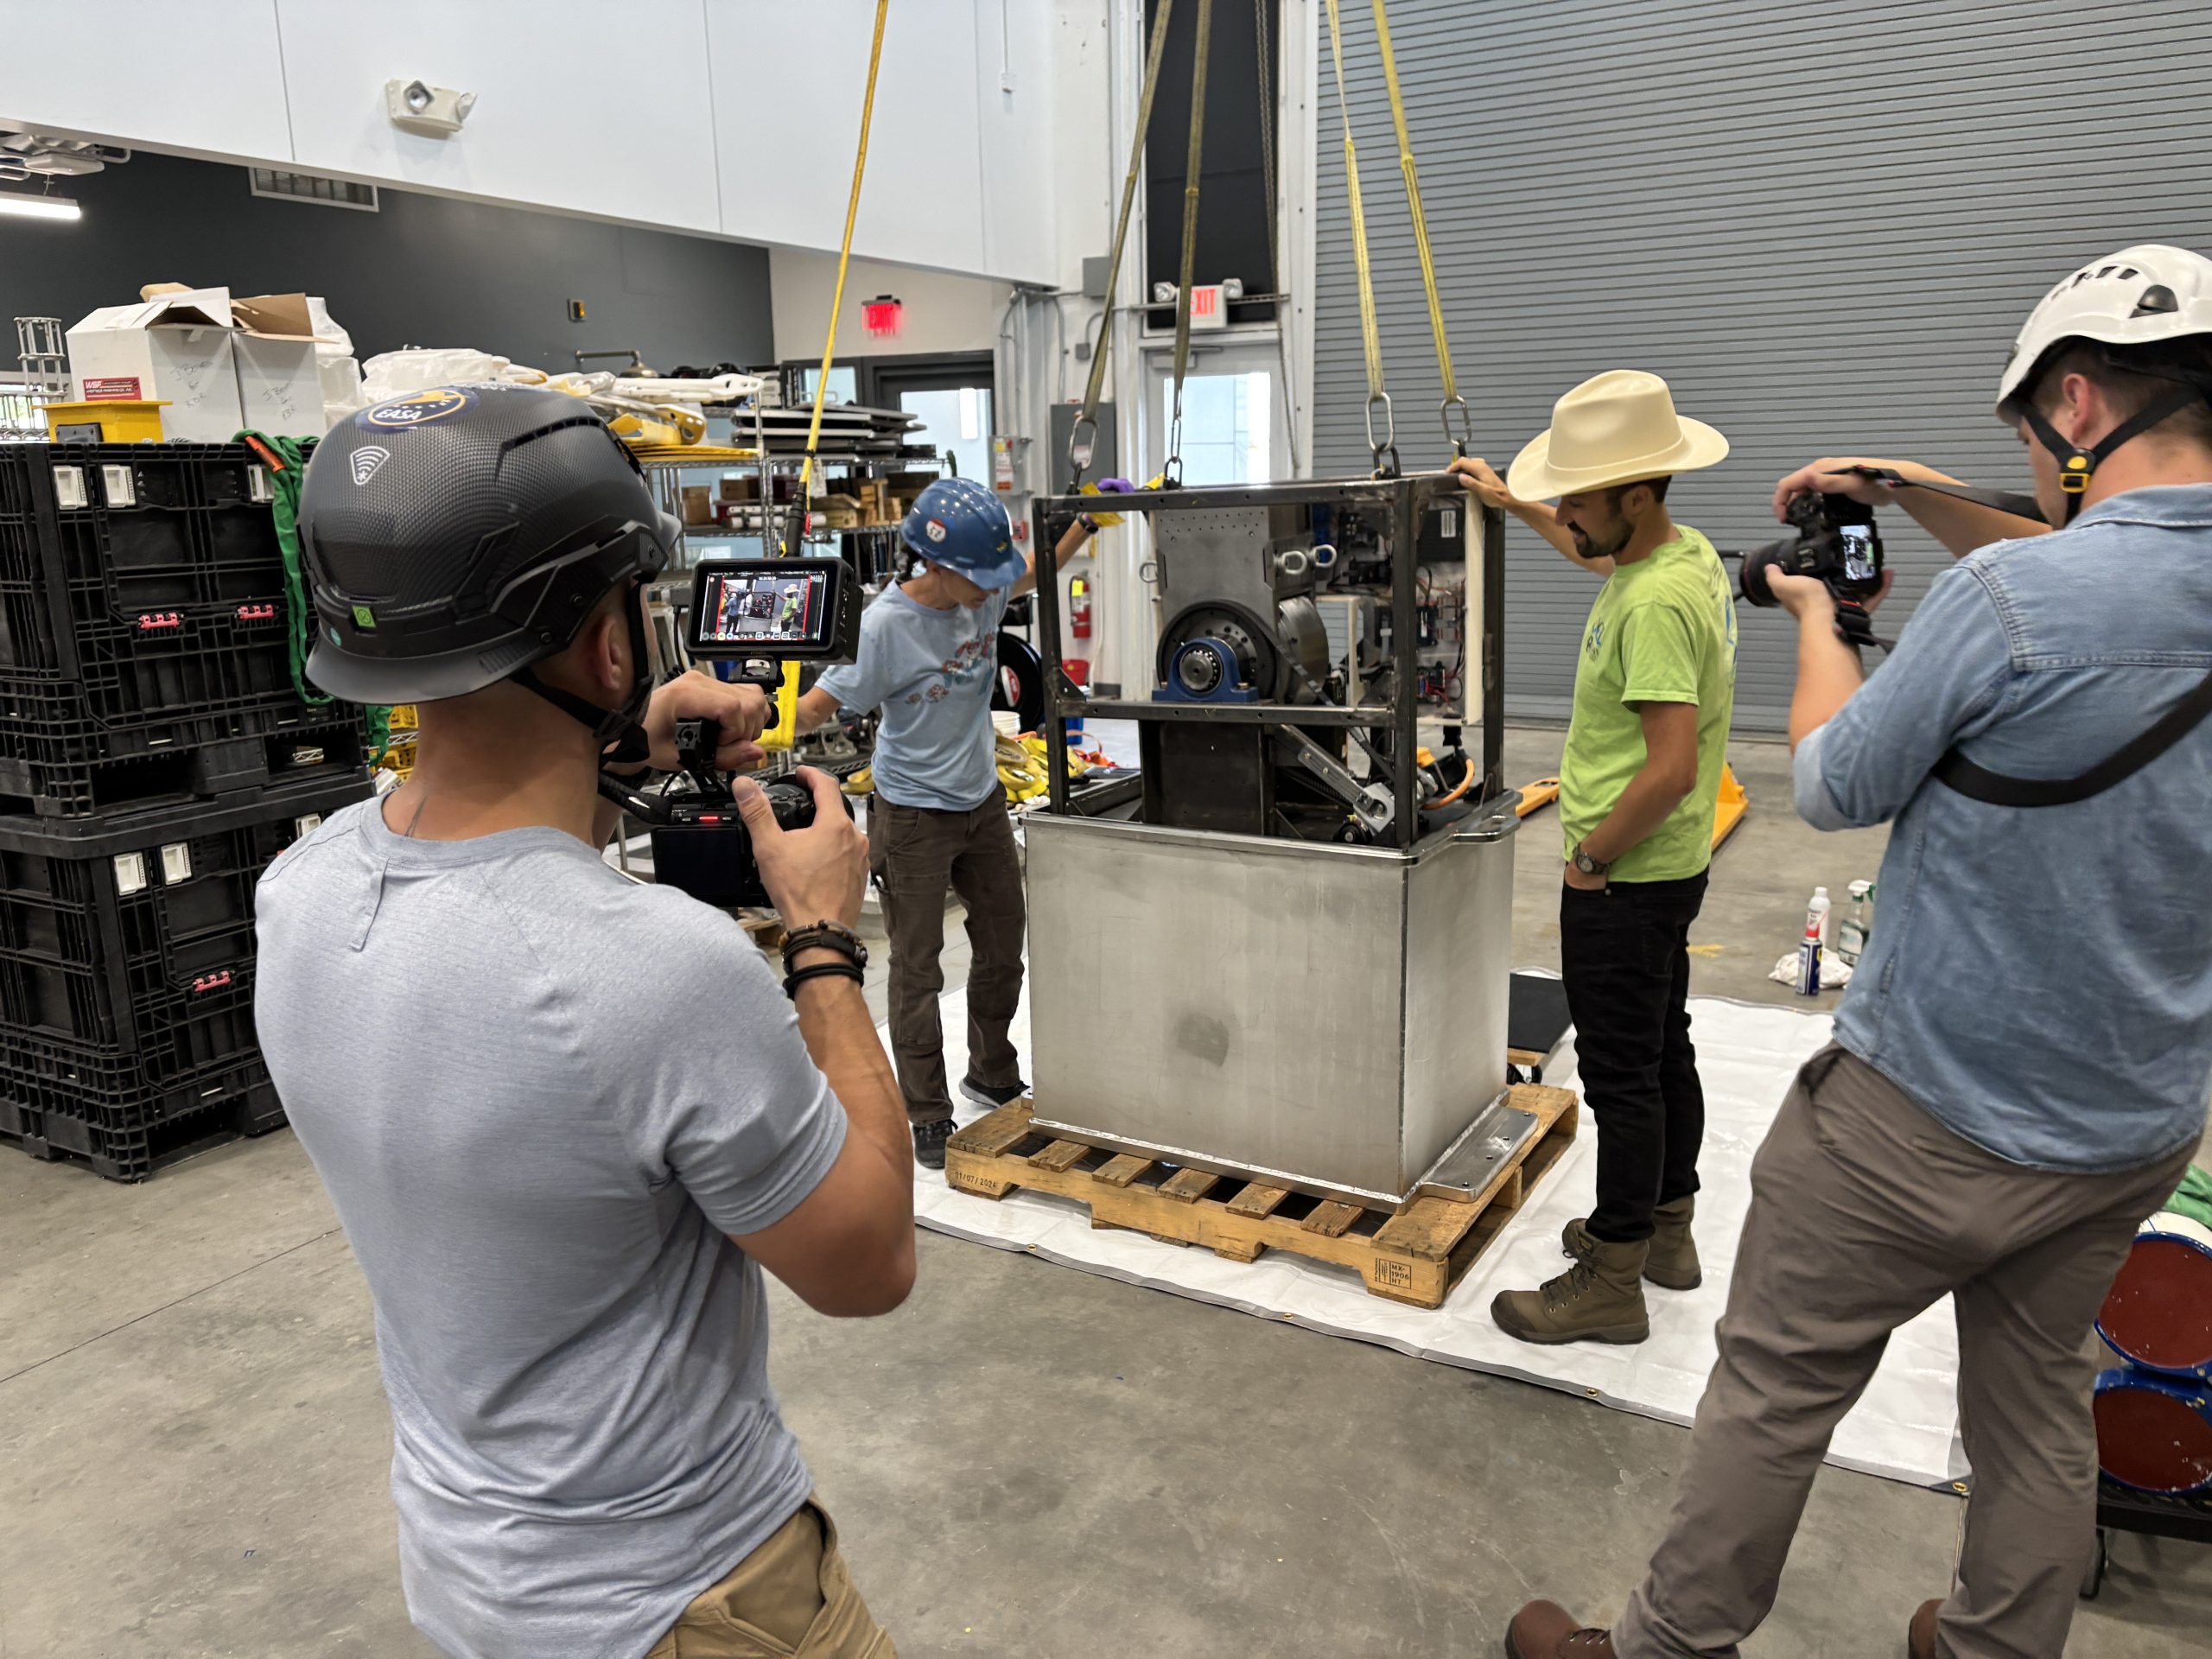 Joshua Bauer, NREL; Taylor Mankle, NREL; Meghan Donohue, WHOI; and Alex Franks, WHOI, install the WEC system into its watertight housing. © Ken Kostel, WHOI[/caption]
Read More
Joshua Bauer, NREL; Taylor Mankle, NREL; Meghan Donohue, WHOI; and Alex Franks, WHOI, install the WEC system into its watertight housing. © Ken Kostel, WHOI[/caption]
Read More Miniboat Hesperia Deployed from R/V Atlantis During OOI RCA Cruise
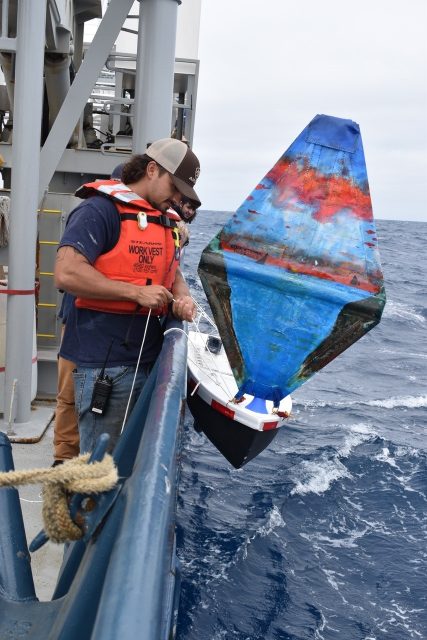
On August 24, 2025, during the 2025 Regional Cabled Array (RCA) Operations and Maintenance cruise, a small miniboat named M/B Hesperia was launched into the Pacific. About two hours after departing Axial Seamount, the boat was carefully deployed by hand off the starboard side of the R/V Atlantis.
The deployment was conducted at 15:31 PDT by Bosun Ed Popowitz and Able-Bodied Seaman Esteban Mogollon at coordinates 45.809950° N, 129.575011° W. The launch was met with enthusiasm and excitement from the crew, who gathered to watch Hesperia set sail.
This effort supports the Educational Passages Program and the Oregon Coast STEM Hub, part of Oregon Sea Grant, helping connect students and communities with ocean science through hands-on exploration.
You can follow the journey of M/B Hesperia in real time here: Track the boat.
[caption id="attachment_36992" align="alignnone" width="1280"]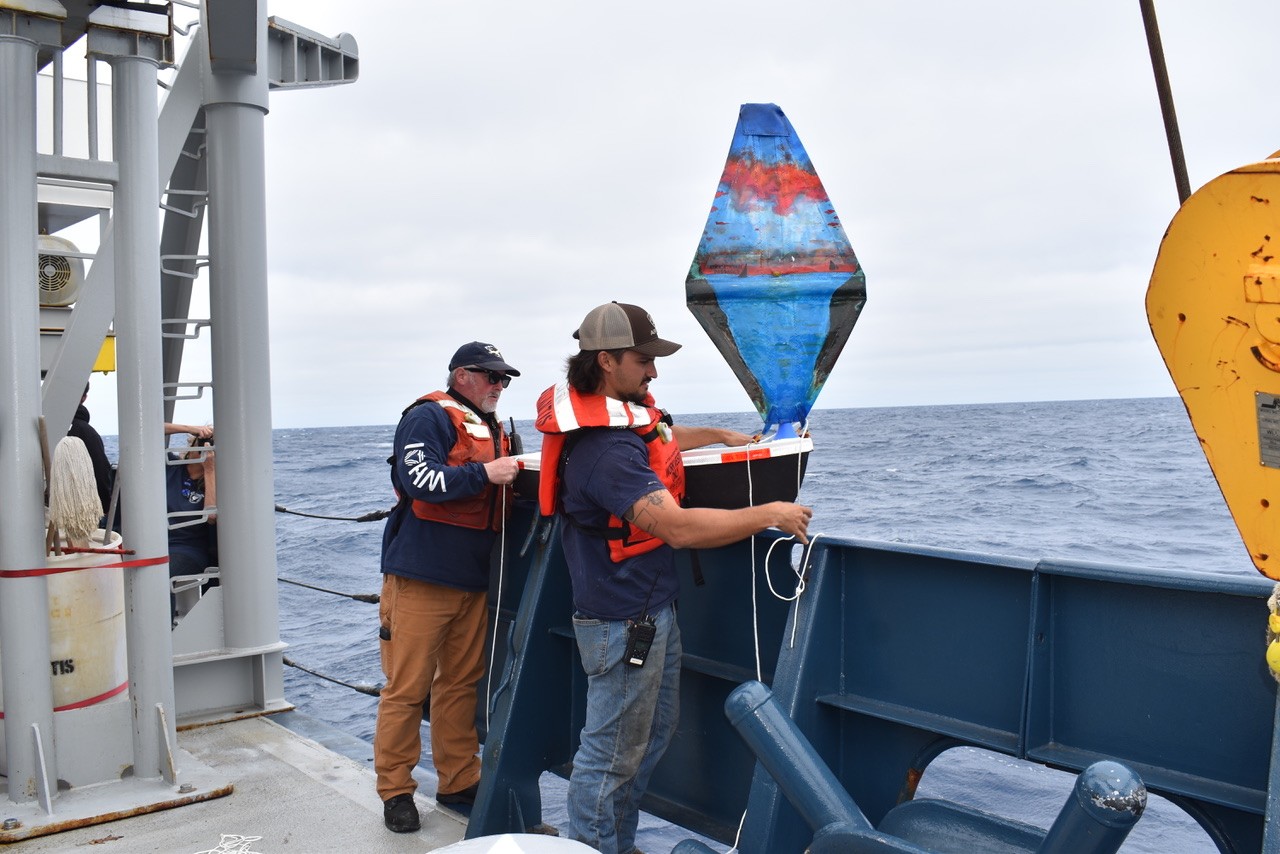 M. Elend, University of Washington, V25[/caption]
[caption id="attachment_36994" align="alignnone" width="1280"]
M. Elend, University of Washington, V25[/caption]
[caption id="attachment_36994" align="alignnone" width="1280"]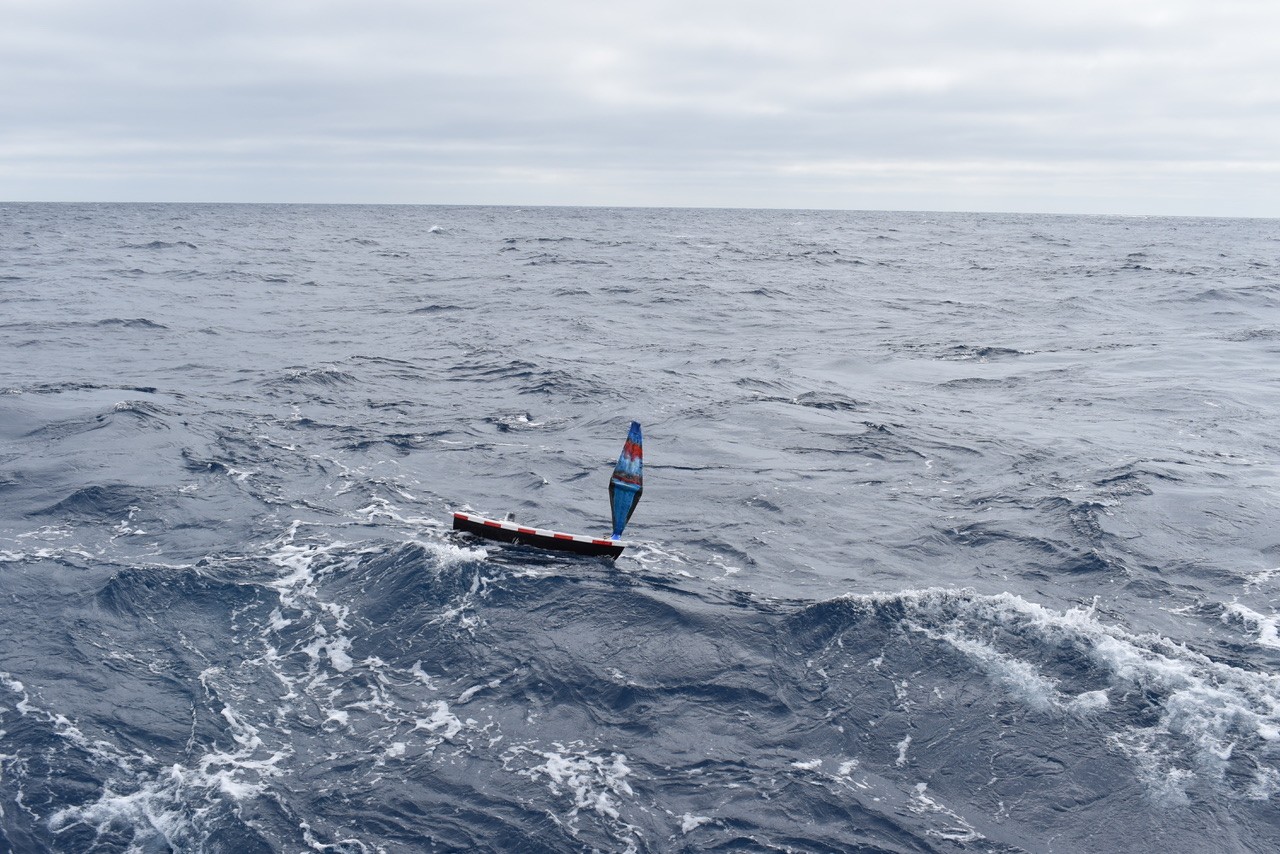 M. Elend, University of Washington, V25[/caption]
[caption id="attachment_36995" align="alignnone" width="1280"]
M. Elend, University of Washington, V25[/caption]
[caption id="attachment_36995" align="alignnone" width="1280"]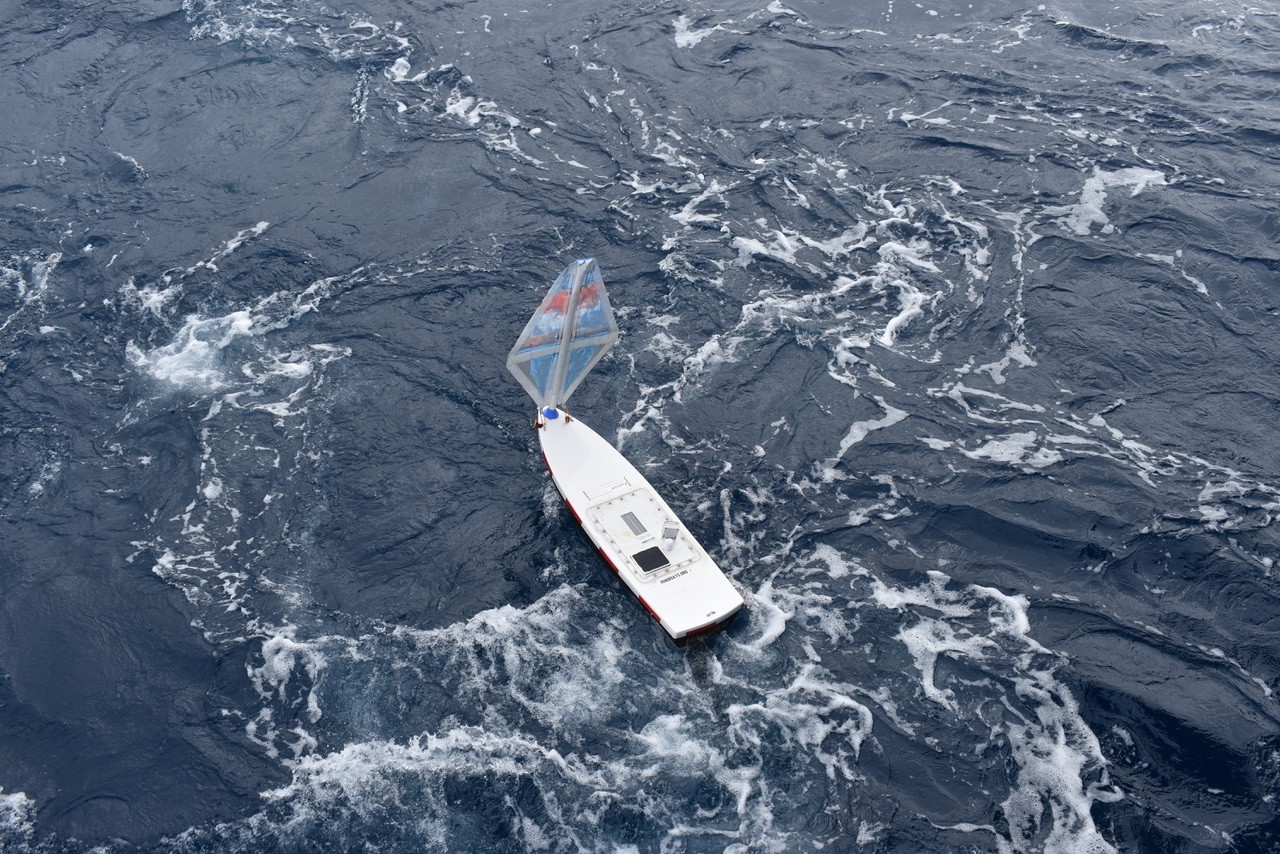 M. Elend, University of Washington, V25[/caption]
Read More
M. Elend, University of Washington, V25[/caption]
Read More CI Compass Interns Showcase Innovative Summer Research with OOI
The CI Compass Fellowship Program (CICF), funded by the U.S. National Science Foundation (NSF), prepares undergraduate students for careers in cyberinfrastructure through both training and applied research opportunities. The program begins with a 12-week virtual Spring Program, where students are introduced to skills essential for cyberinfrastructure careers at NSF Major or Mid-scale Facilities. Following the spring training, students may apply for the Summer Program, which places a limited number of Fellows in hands-on projects at collaborating NSF facilities.
Through this pathway, CI Compass Fellows Ejay Aguirre and Dylan Hermosillo earned internships with OOI this summer, where they applied their training to advance projects at the intersection of ocean science, cyberinfrastructure, and data analysis.
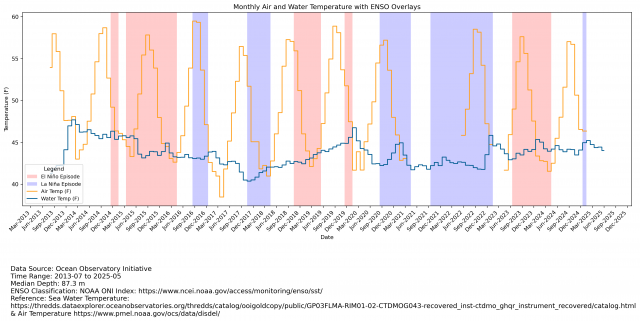
One project focused on connecting large-scale climate phenomena with accessible environmental data. Ejay Aguirre, an undergraduate at the University of Utah, integrated datasets from OOI, Ocean Networks Canada (ONC), and the National Ecological Observatory Network (NEON) to investigate how the El Niño Southern Oscillation (ENSO) is reflected across different monitoring sites. Using Python and Jupyter Notebook, he built a workflow for retrieving, cleaning, and comparing data across infrastructures. The analysis revealed that site characteristics, particularly latitude, influence the visibility of ENSO signals, with higher-latitude sites exhibiting weaker short-term patterns. Future work includes expanding the study to additional sites for broader spatial coverage, incorporating other climate indicators such as the Pacific Decadal Oscillation (PDO) and North Pacific Gyre Oscillation (NPGO), and publishing a publicly accessible, fully documented Jupyter Notebook to support reusability within the research community.
The second project addressed the challenge of monitoring ice conditions in the North Atlantic. Dylan Hermosillo, who will begin a PhD program in Bioinformatics at North Carolina State University, developed a convolutional neural network for ice detection using images collected by cameras mounted on a surface buoy at the OOI Irminger Array. The project stemmed from anomalies in buoy sensor data caused by iced-over instruments, which prompted the addition of cameras as supplementary monitoring tools. He worked with approximately 256,000 images, applying preprocessing steps such as pixel normalization and consistency checks. Tools like Dyno v2 and Facebook AI’s image similarity search were used to sort and filter the dataset. While challenges remained with image resolution and varying camera perspectives, the project demonstrated the feasibility of using buoy-mounted cameras to detect ice flows. Future directions include applying similar methods to cloud separation studies and exploring the integration of instruments such as solar meters to enhance atmospheric observations.
Reflecting on their progress, Jeffrey Glatstein, Senior Manager of Cyberinfrastructure at OOI noted, “Both Ejay and Dylan demonstrated how student researchers can make meaningful contributions when given the opportunity, providing fresh perspectives and impactful solutions that help advance OOI’s mission.”
As the CI Compass Fellowship Program continues to grow, it provides an important opportunity for developing the next generation of scientists and researchers engaged in cyberinfrastructure and data-intensive science.
Learn more about the CI Compass Fellowship Program by visiting the CI Compass website.
For those interested in the application process of the program, please visit the CI Compass Fellowship Program’s application process webpage.
[caption id="attachment_36916" align="alignnone" width="4801"] Air and water temperature plot generated from OOI data.[/caption]
Read More
Air and water temperature plot generated from OOI data.[/caption]
Read More 2025 OOIFB Summer School on Acoustics
From July 14-18, 2025, the U.S. National Science Founded funded OOI Facility Board (OOIFB) hosted an immersive summer school at the University of Washington in Seattle, bringing together early-career ocean scientists to explore the science and applications of underwater acoustics using Ocean Observatories Initiative (OOI) data.
Co-chaired by Dr. Wu-Jung Lee and Dr. Shima Abadi of the University of Washington, the program combined targeted lectures, hands-on tutorials, and real-world exercises to build participant expertise in accessing, processing, and interpreting both active and passive acoustic datasets including those from echosounders, hydrophones, and bioacoustic sonars available through the OOI network.
Over five days, participants gained:
- Core knowledge on underwater sound propagation and the main factors influencing it.
- Familiarity with the range of acoustic instruments deployed in the OOI network.
- Practical skills in navigating OOI data portals to access and download acoustic and complementary oceanographic datasets.
- Experience working with OOI datasets in JupyterHub, building Python skills and reinforcing coding as a core part of the program.
- Insights into scientific questions that can be addressed using OOI data.
- Connections with a community of researchers using OOI data in their work.
Participants
This year’s program welcomed 23 advanced graduate students, postdoctoral fellows, and early-career scientists from diverse research backgrounds. While geared toward those with an interest in underwater acoustics, the school was designed to be accessible, with no prior deep expertise required and high-level primers on underwater acoustics provided.
Looking Ahead
Archived materials, including the full agenda and select summer school resources, will be made available in the coming months for the broader research community.
The OOIFB Summer School on Acoustics exemplifies how targeted training can build a knowledge base in ocean acoustics research and broaden the use of OOI data in science and education.
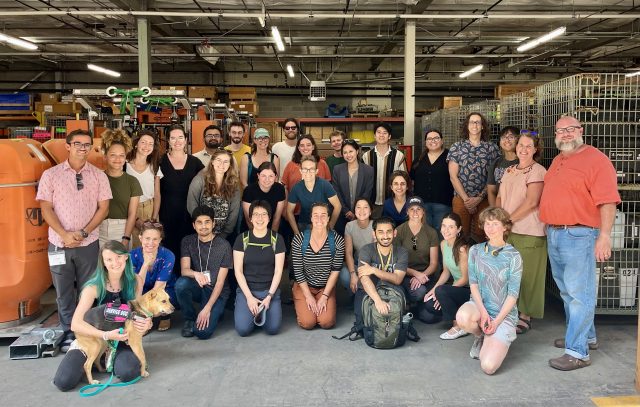
[caption id="attachment_36880" align="alignnone" width="2560"] The 2025 OOIFB Summer School on Acoustics cohort at the OOI-RCA Sand Point Facility.
 [/caption]
[caption id="attachment_36895" align="alignnone" width="2560"]
[/caption]
[caption id="attachment_36895" align="alignnone" width="2560"]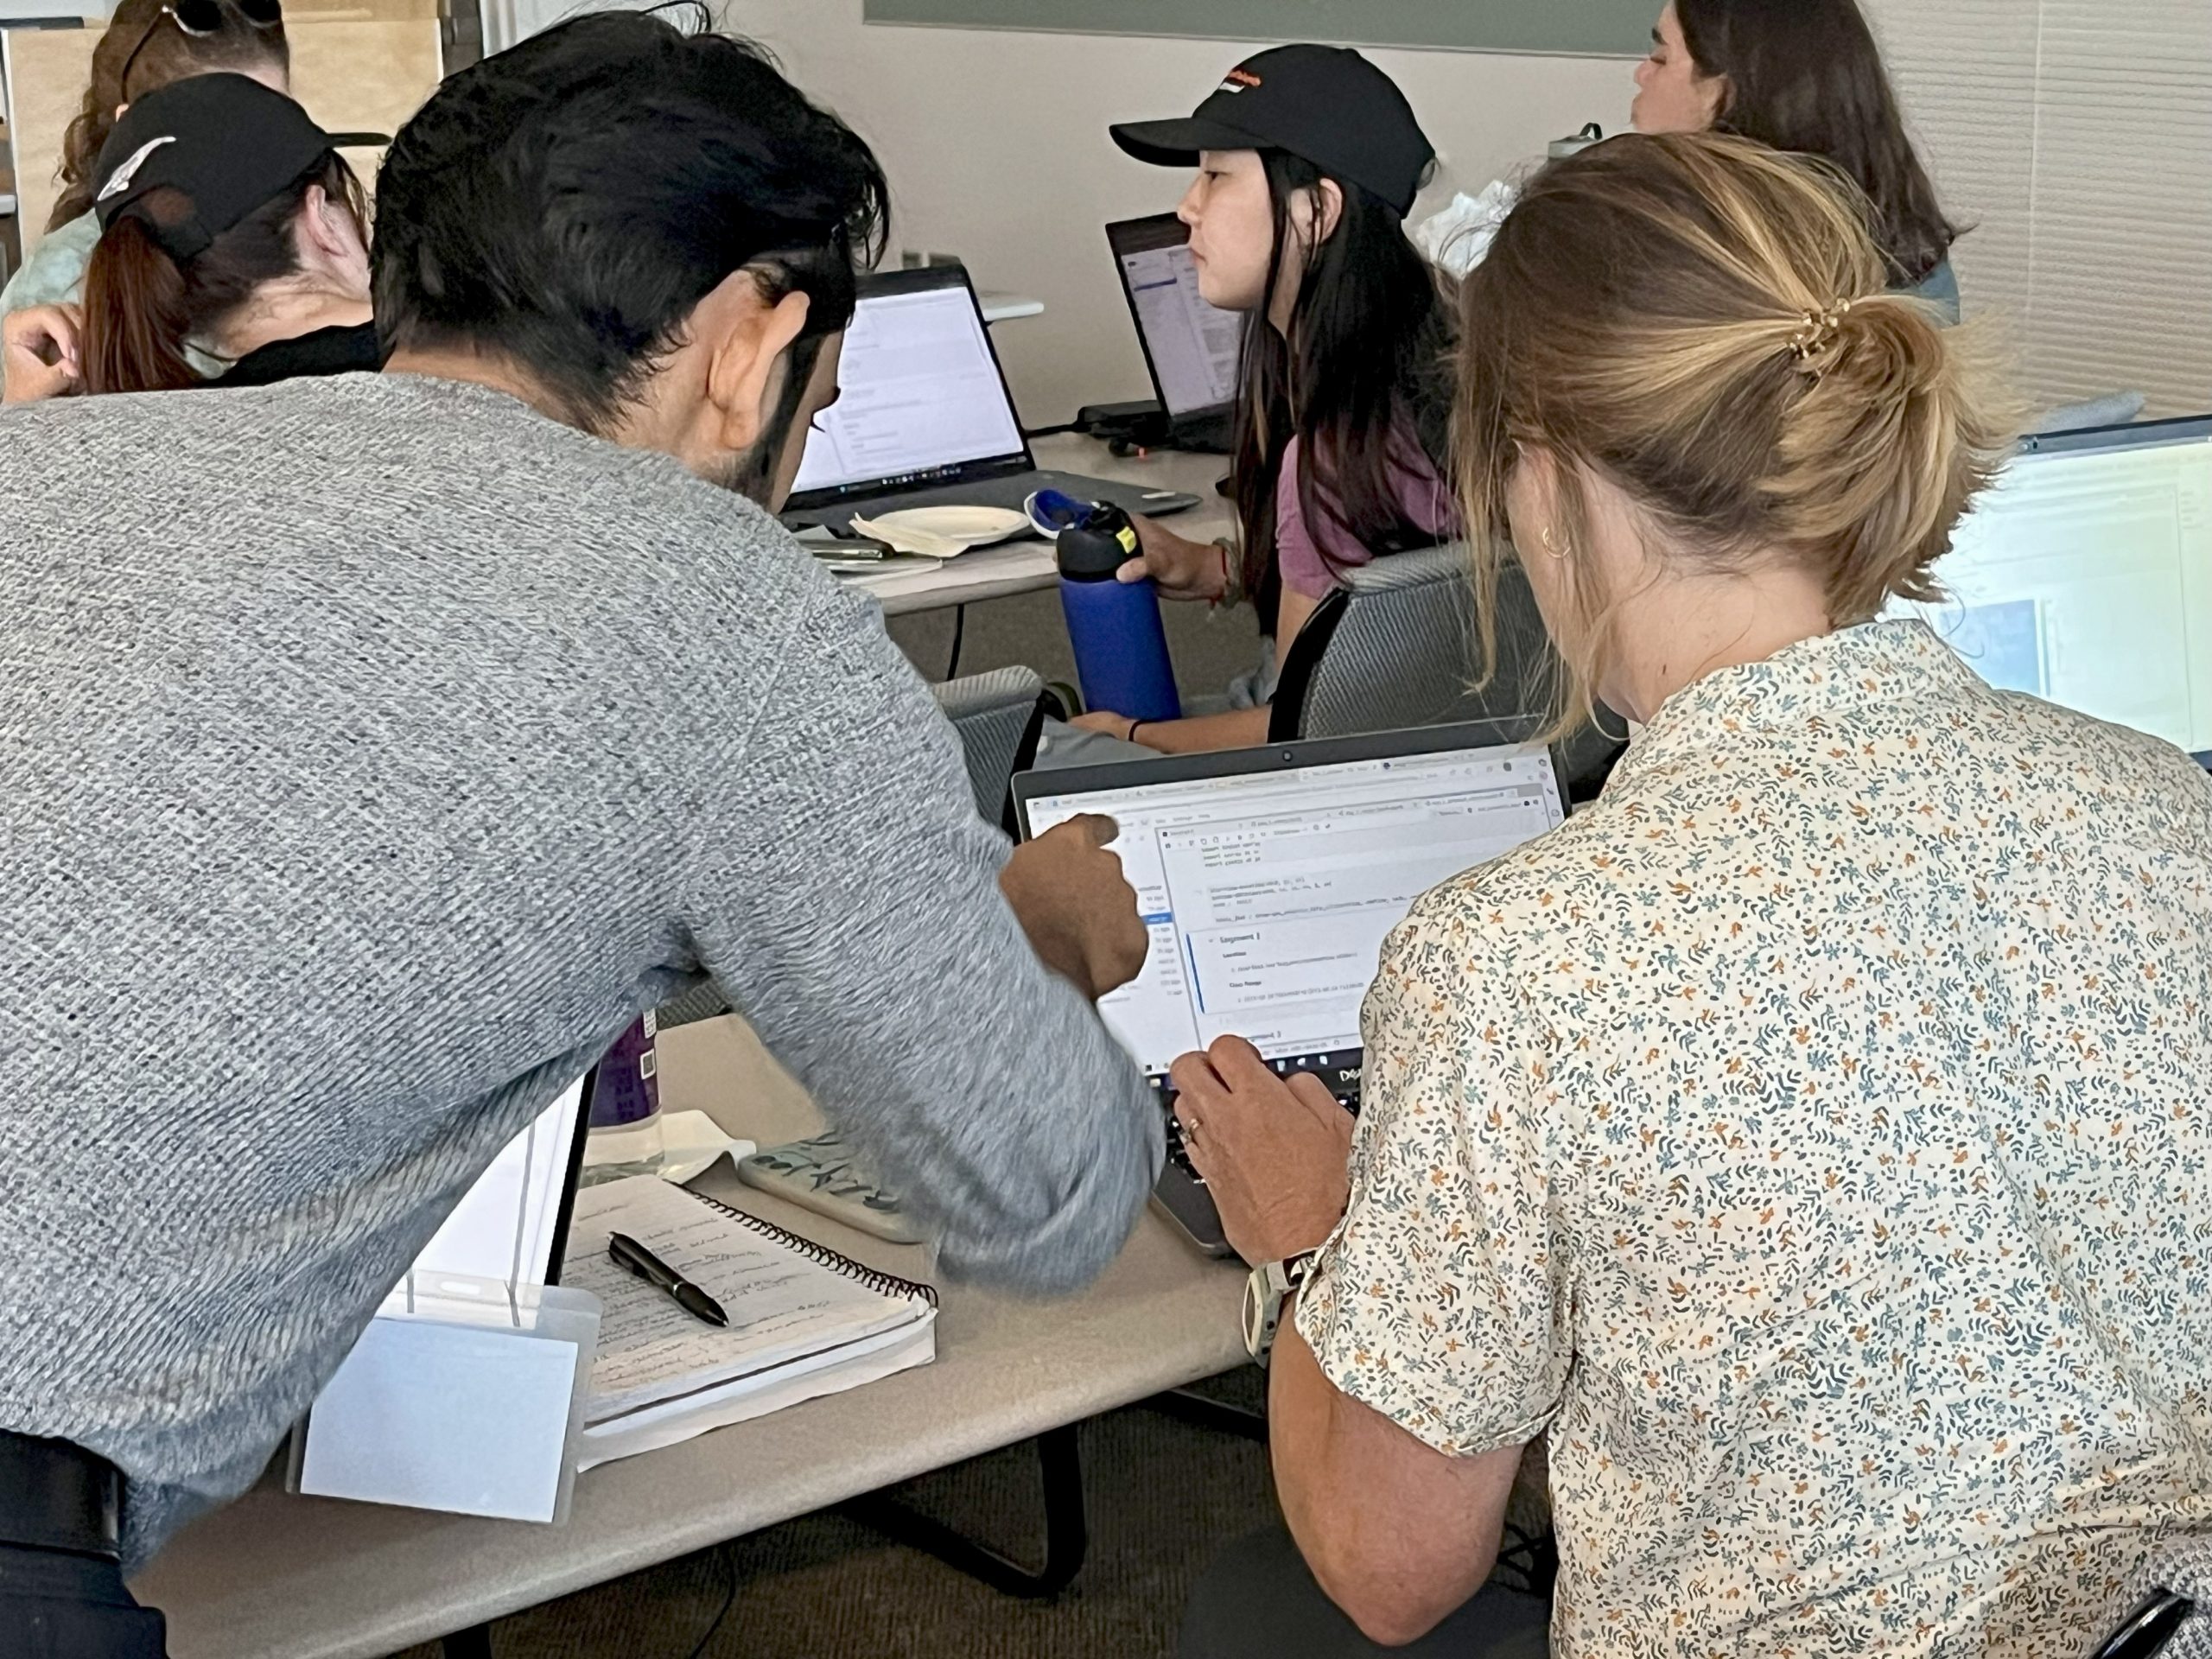 Students working through data exercises in the OOI JupyterHub environment. Credit: Holly Morin, OOIFB[/caption]
[caption id="attachment_36896" align="alignnone" width="2560"]
Students working through data exercises in the OOI JupyterHub environment. Credit: Holly Morin, OOIFB[/caption]
[caption id="attachment_36896" align="alignnone" width="2560"]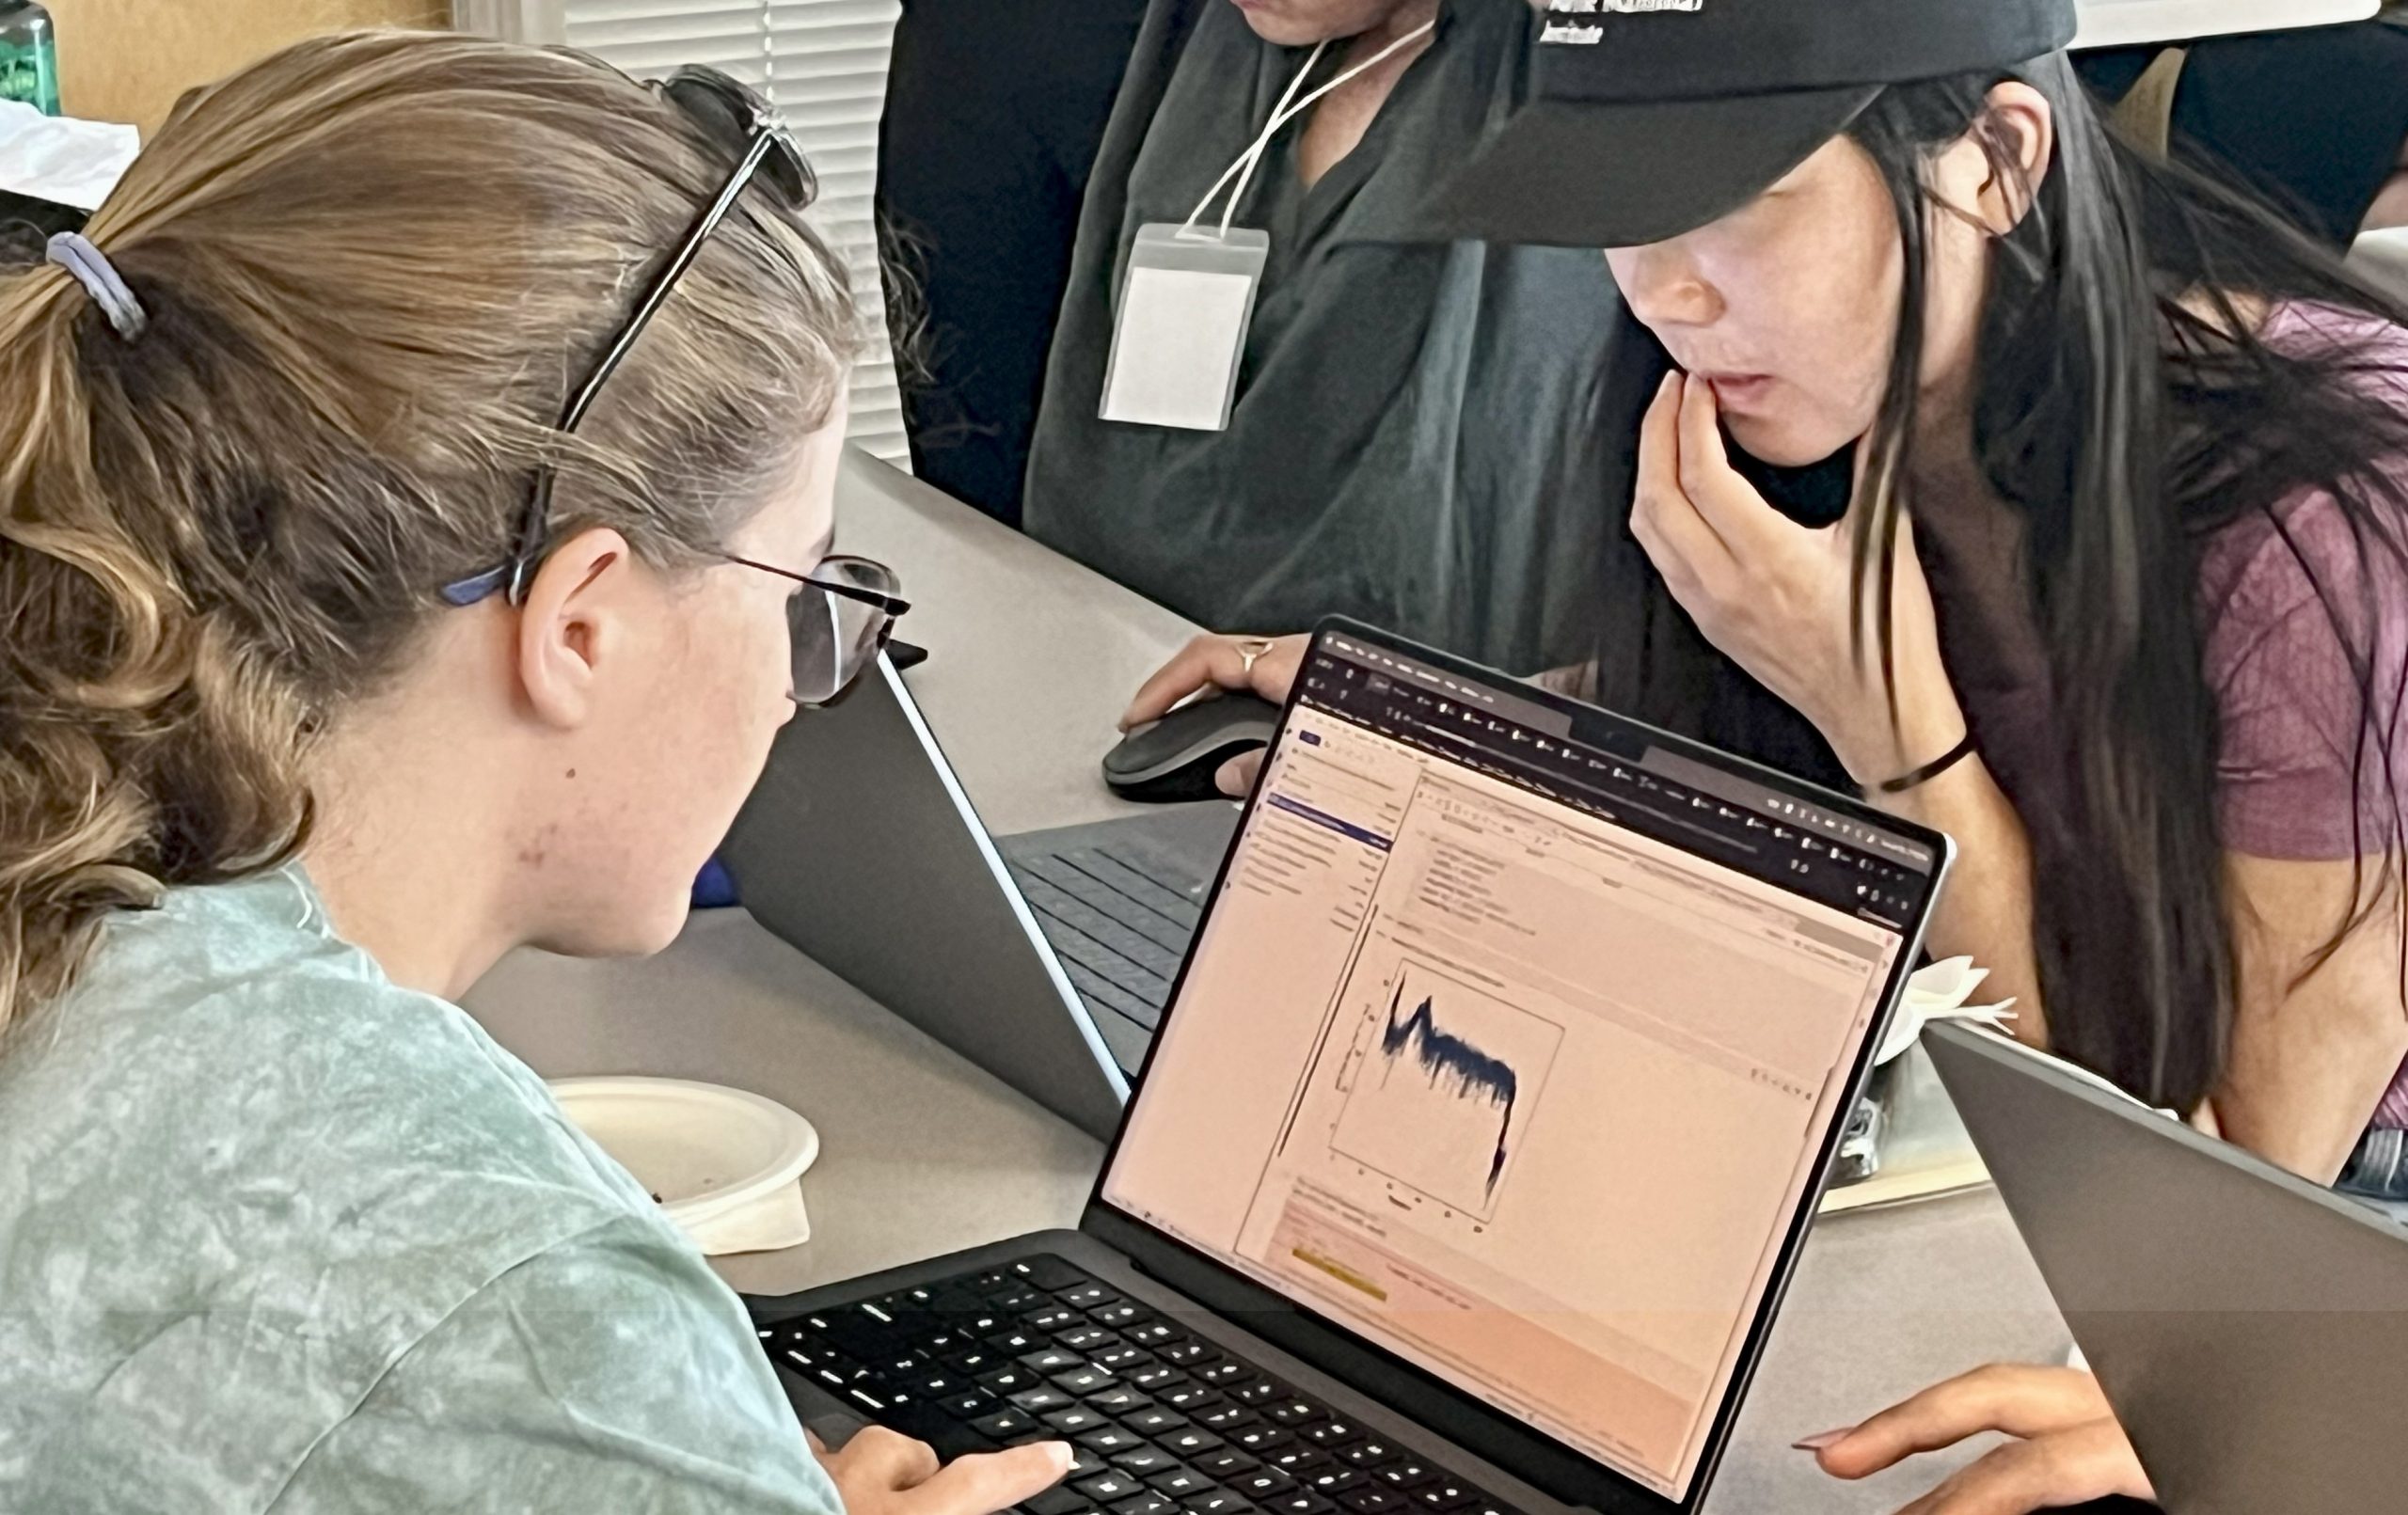 Students working through data exercises in the OOI JupyterHub environment. Credit: Holly Morin, OOIFB[/caption]
[caption id="attachment_36897" align="alignnone" width="2560"]
Students working through data exercises in the OOI JupyterHub environment. Credit: Holly Morin, OOIFB[/caption]
[caption id="attachment_36897" align="alignnone" width="2560"]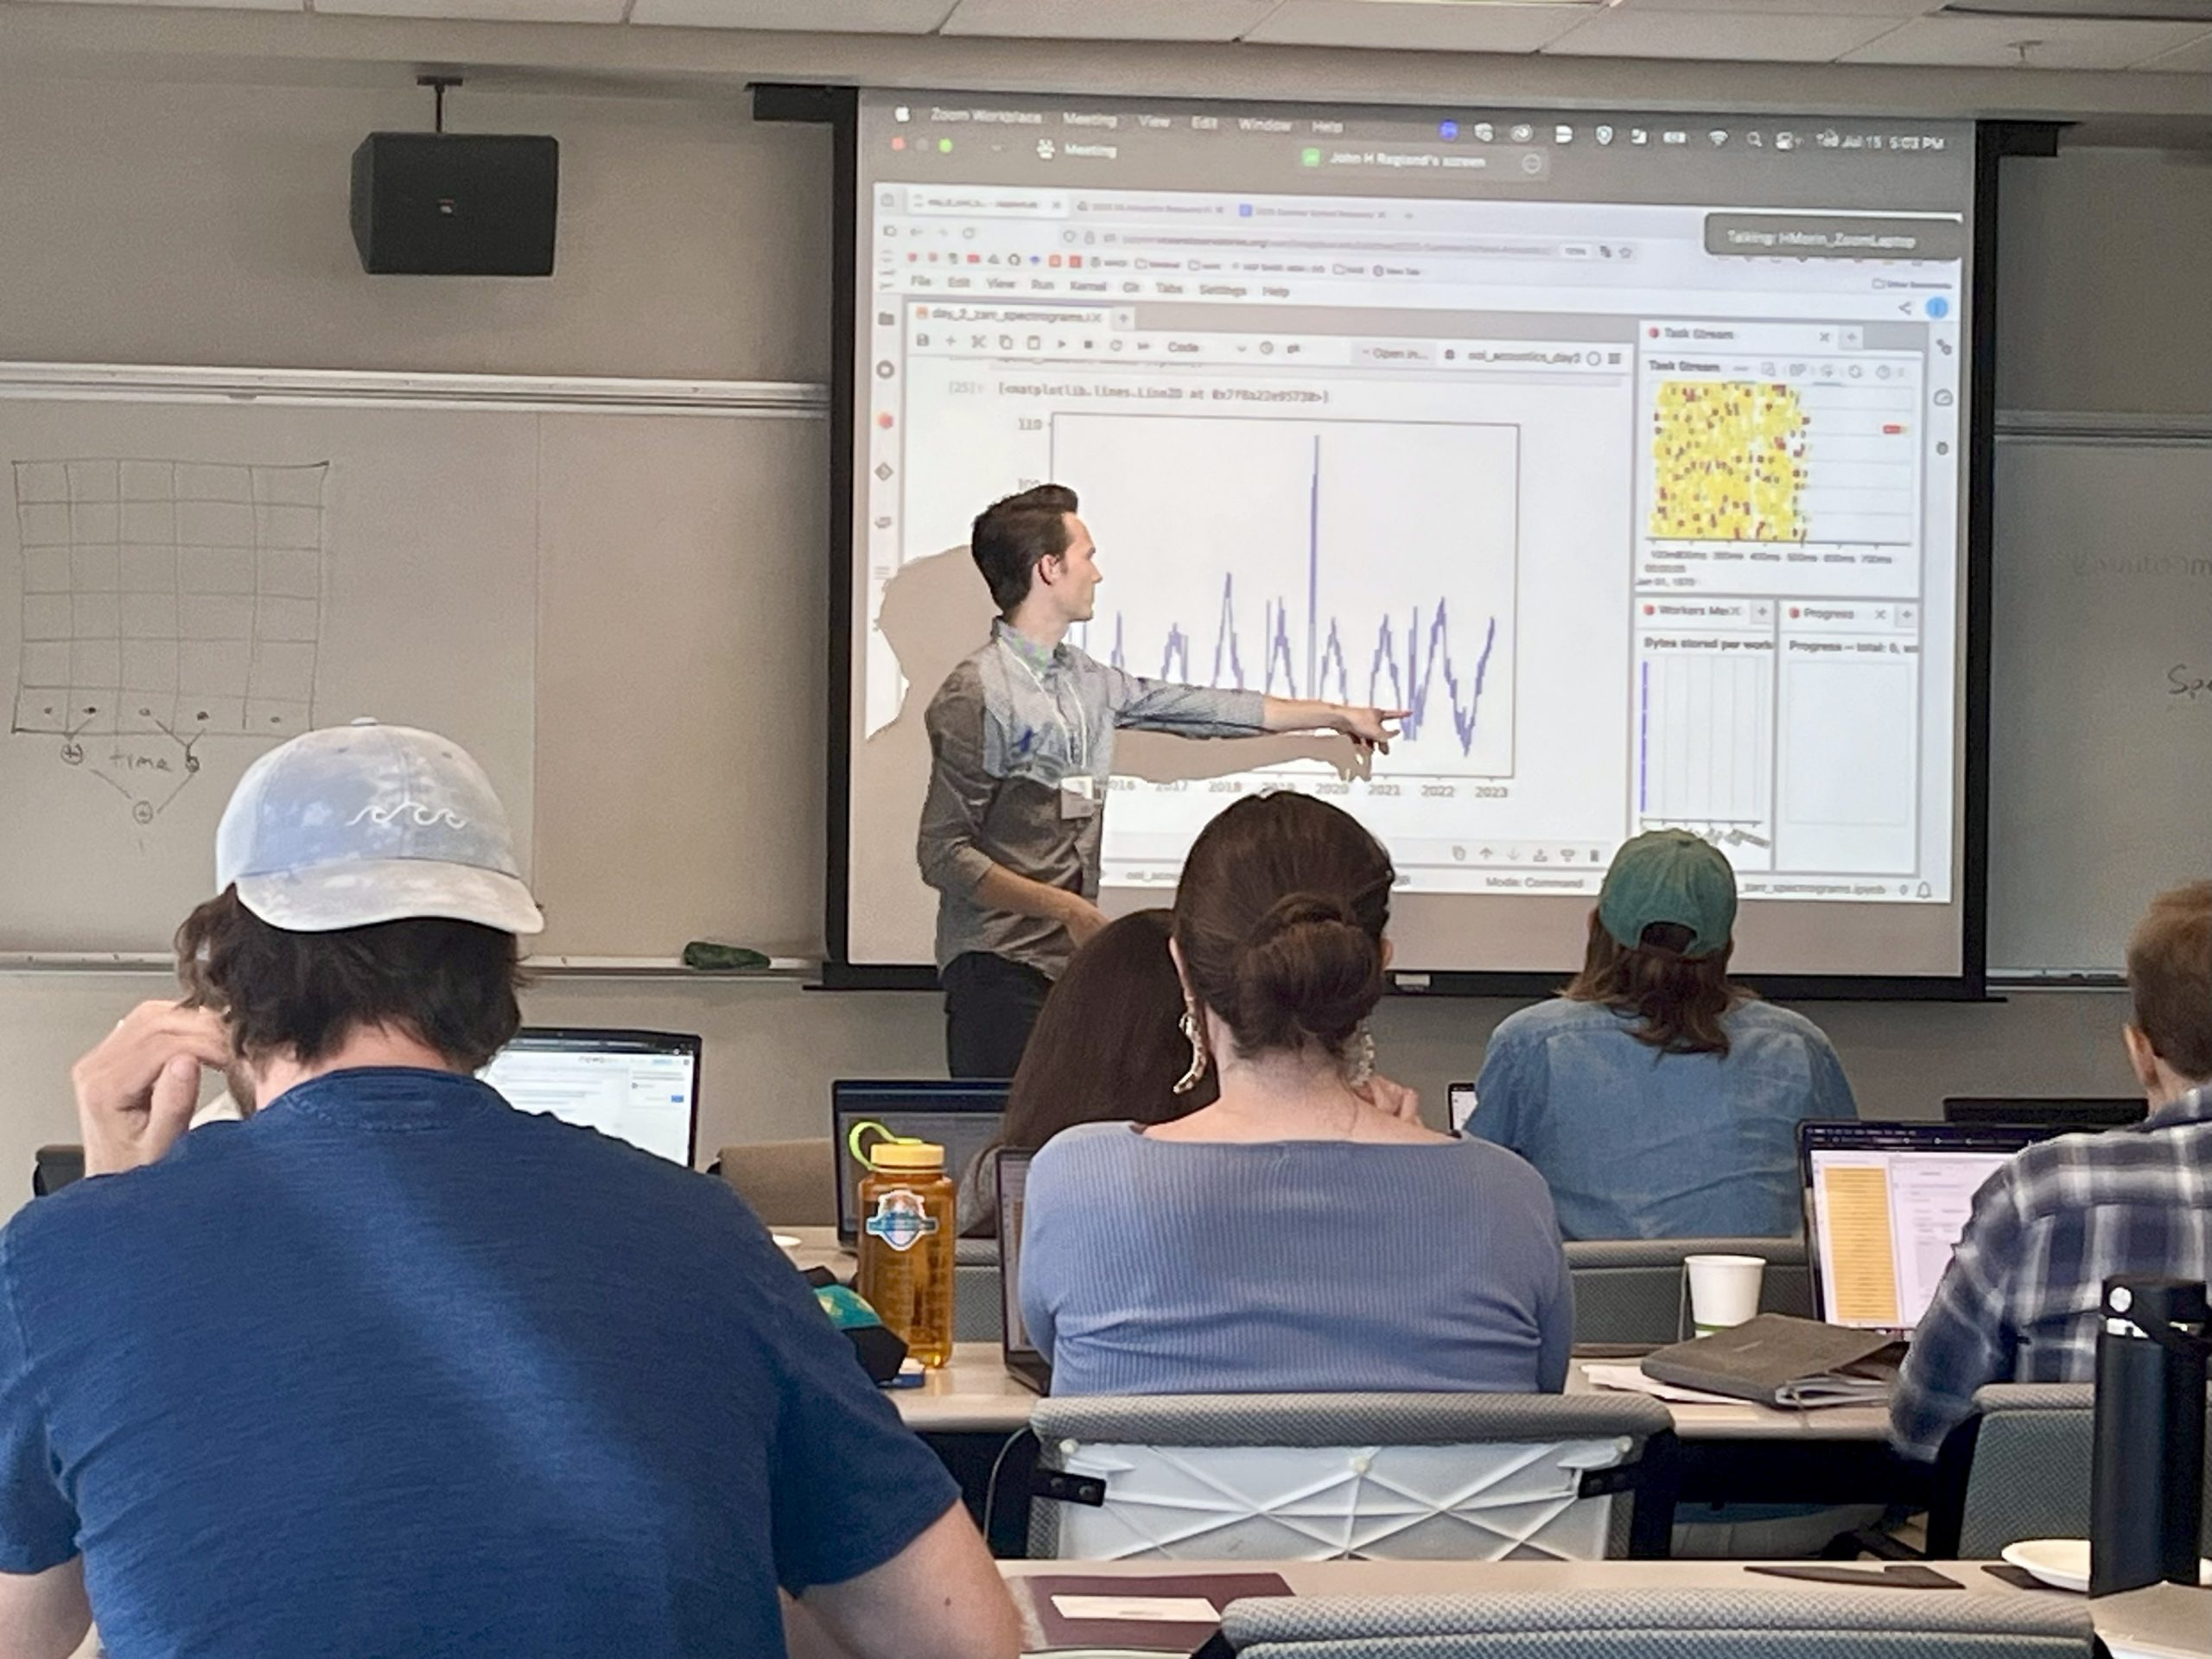 Dr. John Ragland works with participants to interpret outputs from a passive acoustic dataset. Credit: Holly Morin, OOIFB[/caption]
[caption id="attachment_36898" align="alignnone" width="2560"]
Dr. John Ragland works with participants to interpret outputs from a passive acoustic dataset. Credit: Holly Morin, OOIFB[/caption]
[caption id="attachment_36898" align="alignnone" width="2560"]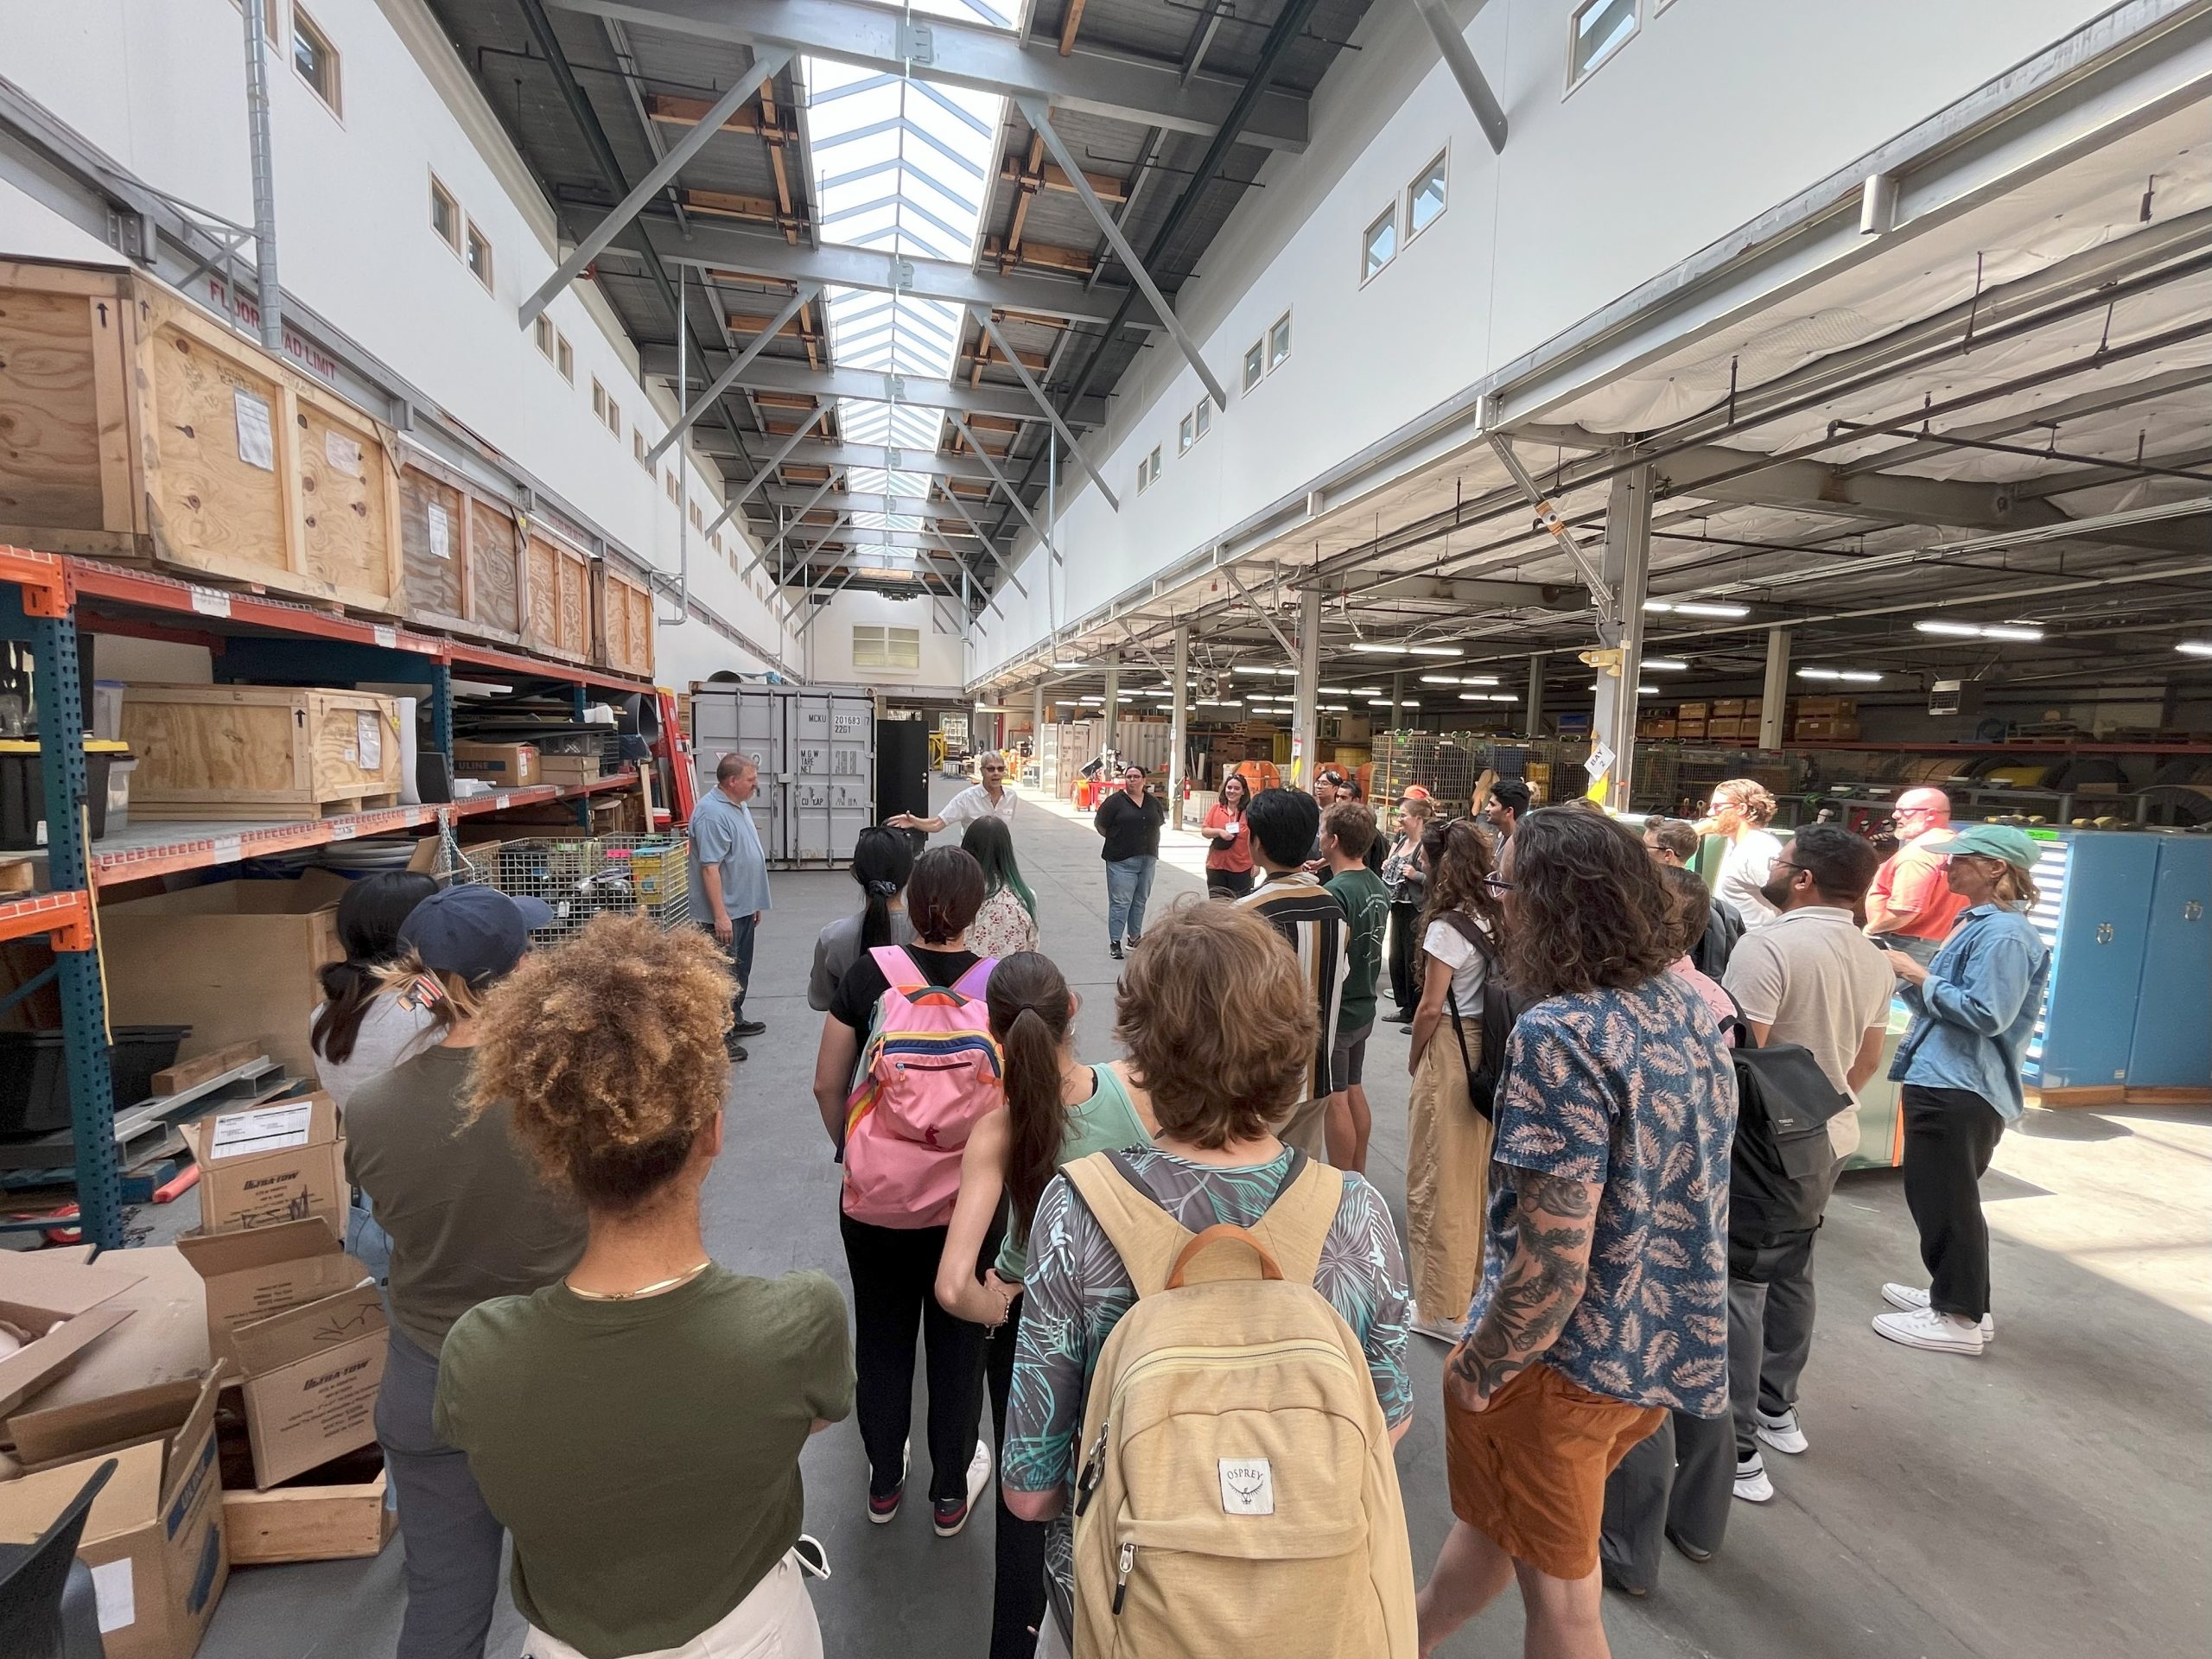 Participants tour the OOI-RCA Sand Point Facility. Credit: Holly Morin, OOIFB[/caption]


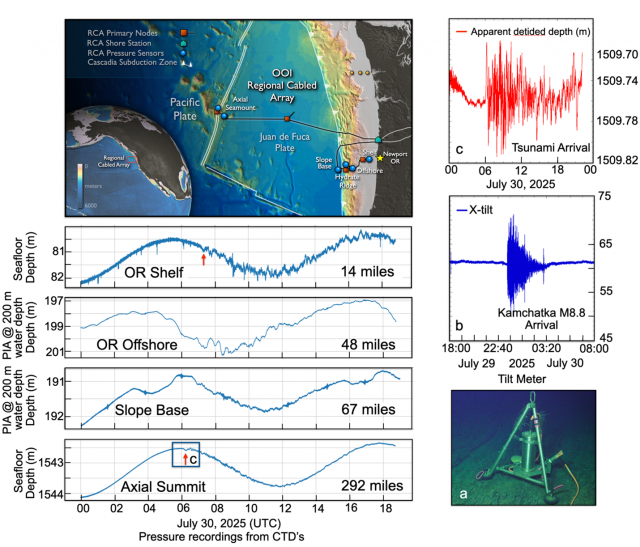
Kamchatka M8.8 Earthquake and Tsunami’s Reach Across the Pacific to NSF’s OOI Regional Cabled Array
Deborah Kelley1, Joe Duprey1, Wendi Ruef 1, and W. Chadwick2
1University of Washington, 1Oregon State University

On July 29 at 23:24:52 UTC, a powerful magnitude 8.8 earthquake struck the Kamchatka Peninsula in Russia, unleashing seismic energy and a tsunami that surged across the Pacific Ocean. This extraordinary event was captured in remarkable detail by the NSF Ocean Observatories Initiative’s (OOI) Regional Cabled Array—a seafloor observatory located offshore Oregon and Washington and one of the world’s most advanced underwater monitoring networks, with over 150 instruments transmitting real-time data to shore at the speed of light.
At 23:33:15, the seismic waves from the Kamchatka earthquake reached Axial Seamount, located nearly 300 miles west of the Oregon coast and almost a mile beneath the ocean’s surface, having crossed the entire Pacific in just nine minutes. The vibrations were so intense they rattled a seafloor instrument continuously for over four hours (a,b).
Then, at 06:03:00 UTC on July 30—6 hours and 30 minutes after the quake—the first tsunami waves arrived at Axial Seamount (c). Ultra-sensitive pressure sensor on bottom pressure tilt instruments picked up the waves with astonishing clarity. Lower-resolution sensors across the array also tracked the tsunami’s journey toward the UW west coast. Racing at speeds of 270 miles per hour, the first wave swept across the Juan de Fuca Plate and over the Cascadia Subduction Zone, eventually reaching seafloor monitoring instruments at the Oregon Shelf site just 14 miles offshore from Newport, Oregon. The OOI Regional Cabled Array instruments showed that the Pacific Ocean reverberated with smaller waves for several days after the first tsunami waves arrived—echoes of one of the most powerful seismic events ever recorded.
This event highlights not only the dynamic nature of our planet and the seismic and tsunami hazards that we have to be prepared for in the Pacific Northwest, but also the incredible capability of modern science to observe and understand these kinds of events—in real time from deep beneath the ocean’s surface, and the value of such monitoring to coastal communities.
The audio, captured by hydrophones at Axial Seamount, reveals the moment the M8.8 earthquake arrived:
[audio mp3="https://oceanobservatories.org/wp-content/uploads/2025/08/kamchatka_Axial_Arrival.mp3"][/audio] Read MoreCall for Applications: OOIFB Data Systems Committee
The Data Systems Committee (DSC) of the Ocean Observatories Initiative Facility Board (OOIFB) was established to help ensure timely and reliable access to high-quality U.S. National Science Foundation (NSF) Ocean Observatories Initiative (OOI) data. The Committee evaluates and recommends improvements to the data services, policies, and practices of the NSF OOI Facility that will lead to more efficient and effective scientific use of NSF OOI data.
The DSC is now soliciting applications to fill one open position. This 3-year appointment will begin in October 2025. The selected individual will be eligible to serve a second 3-year term, if fitting.
The DSC holds one web conference each month and at least one in-person meeting per year. Some objectives of the DSC include:
● Keeping abreast of the current state of the NSF OOI cyberinfrastructure and data services with the goal of helping to promote maximum scientific use of NSF OOI data. These efforts will be informed by the FAIR Guiding Principles for scientific data management and stewardship, such that data are: a) Findable, b) Accessible, c) Interoperable, and d) Reusable.
● Encouraging the use of best practices, standards, and naming conventions established by the oceanographic community.
● Engaging with the user community to gauge user needs in regard to NSF OOI data systems, and to facilitate the promotion of a positive user experience.
● Staying current on potential new modes of data service and access, data analysis methodologies, and related technologies that facilitate the use of NSF OOI data.
● Engaging with members of the NSF OOI Program regarding the priorities and plans of the NSF OOI cyberinfrastructure groups.
● Making recommendations for data products, usage metrics, and improving the user experience on the OOI Data Explorer, as well as other data service systems employed by the NSF OOI.
Scientists with interests and/or experience using scientific observing systems such as the NSF OOI, as well as those with experience in successfully delivering data from large-scale multi-sensor observing systems to scientific users are encouraged to apply. Familiarity/expertise with biogeochemistry datasets is preferred but not required. All applications will be considered. Interested applicants should submit a letter of interest and accompanying CV to Holly Morin, at the OOIFB Administrative Support Office (holly@ooifb.org), no later than September 16, 2025. The statement of interest should highlight the applicant’s experience with NSF OOI data services and/or with other similar data services. Applicants might also include a vision for how these experiences might evolve in the future. For more information about the DSC and its activities, please visit the OOIFB website (http://ooifb.org), or contact Jim Potemra, DSC Chair (jimp@hawaii.edu).
Read MoreSAR Imagery Detects Atmospheric Stratification
(Adapted from Stopa et al., 2024)
There is interest in using satellite-based Synthetic Aperture Radar (SAR) imagery to assess phenomena related to atmospheric boundary layer stratification over the ocean. Obtaining such information with high spatial and temporal resolution would advance boundary layer research and would be beneficial to the development of offshore wind energy. However, monitoring marine boundary layer structure remotely is a challenge. A recent paper by Stopa et al. (2024) shows that it is possible to utilize SAR imagery, in conjunction with in-situ meteorology, to characterize boundary layer stratification.
The Central Surface Mooring (CNSM) of the OOI Pioneer New England Shelf Array is located near a region of offshore wind development where SAR imagery is also available. The authors use wind speed, air temperature, and sea surface temperature from the CNSM buoy to estimate the bulk Richardson number (Ri), a measure of marine atmospheric boundary layer stability. OOI quality control flags were used to identify good data, and suspect data were replaced with data from redundant sensors. CNSM data from 2014 – 2021 were used in the analysis.
SAR data are commonly used to provide wind speed estimates, but the images also contain rich information about coherent structures in the atmosphere, and those structures correspond to boundary layer stratification regimes (Stopa et al., 2022). The Stopa et al., (2024) study used European Space Agency Sentinel-1 C-band SAR wave mode (S1 WV) imagery spanning the region of the NES Pioneer Array. SAR Images in 20 x 20 km regions were visually examined and classified based on observed “signatures” of atmospheric phenomena. Of particular interest for this study were signatures indicative of waves, rolls/streaks and convection (Table 1).
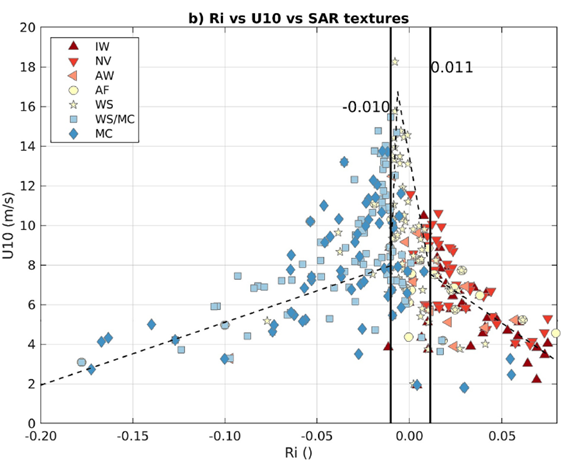
The relationship of SAR image classes to wind speed and atmospheric stability was examined by plotting the classified data set vs Ri and U10 (Figure 1). U10 shows a change in slope near neutral stratification (Ri = 0) with indications of a Ri-U10 relationship at higher and lower Ri. Of interest is the appearance of Ri boundaries denoting transitions between unstable (Ri < -0.01), neutral, and stable (Ri > 0.01) regimes. Rolls, streaks and convection dominate the unstable regime, while waves dominate the stable regime. In other words, classification of the SAR images provides information about atmospheric stratification.
This project shows the power of combining remote sensing with long-term, in-situ meteorological measurements to gain insights that neither could provide alone. The authors note that when satellite data are available, the SAR-based determination of boundary layer structure can be used over broad areas and long times, and is more efficient than direct measurements such as buoy-based LIDAR.
Table 1: Atmospheric signatures in SAR imagery
| Class | Phenomena |
| NV | Lack of rolls or cells |
| AW | Atmospheric gravity waves |
| IW | Oceanic internal gravity waves |
| WS | Rolls or wind streaks |
| MC | Microscale convection |
| WS/MC | Combined WS/MC |
Figure 1. SAR image classes shown as different symbols) vs. Richardson number (Ri) and ten meter wind speed (U10). Note the regime transitions near Ri = -0.01 and +0.01. From Stopa et al., 2024.[/caption]
___________________
References:
Stopa, J.E., C. Wang, D. Vandemark, R.C. Foster, A. Mouche, and B. Chapron, (2022). Automated Global Classification of Surface Layer Stratification Using High-Resolution Sea Surface Roughness Measurements by Satellite Synthetic Aperture Radar,” Geophysical Research Letters 49(12), e2022GL098686.
Stopa, J.E., D. Vandemark, R. Foster, M. Emond, A. Mouche, and B. Chapron (2024). Characterizing the Atmospheric Boundary Layer for Offshore Wind Energy Using Synthetic Aperture Radar Imagery. Wind Energy, 27:1340–1352, https://doi.org/10.1002/we.2933.
Read MoreGap-Filled Dissolved Oxygen Data from the Ocean Observatories Initiative Endurance Array Inshore Moorings
Brandy Cervantes contributed the dataset described below to Zenodo. This dataset now appears in the OOI Community Datasets under the OOI home page.
The National Science Foundation Ocean Observatories Initiative (OOI) collects continuous in-situ measurements of dissolved oxygen (DO) on the Endurance Array moorings in the inner shelf region of the Oregon and Washington coasts. Aanderaa Optode 4831 oxygen sensors were deployed at 7 meters depth on the near surface instrument frame (NSIF) and on the collocated coastal surface piercing profiler (CSPP) moorings. The sensors suffer from calibration drift due to biofouling, which can cause a dramatic increase in DO during daylight hours and corresponding decrease at night compared to the conditions in the water column. This enhanced diel signal, when present, is much more pronounced on fixed-depth sensors and usually begins to occur 1-2 months after a mooring is deployed. After this biofouling issue was identified, OOI began deploying UV lamps adjacent to the oxygen sensor in spring 2018, after which there was substantial improvement in DO data quality. Each file in this dataset contains the measured near surface DO and the corrected near surface DO at the Oregon and Washington inner shelf surface moorings (ISSM) with gaps from periods of biofouling replaced with the DO measured by the CSPP.
___________________
References:
Cervantes, B. (2025). Gap-Filled Dissolved Oxygen Data from the Ocean Observatories Initiative Endurance Array Inshore Moorings [Data set]. Zenodo. https://doi.org/10.5281/zenodo.15742508
Read More