
News
OOI Irminger Sea Data Helping Fill Critical Gap in Climate Models
Researchers at Woods Hole Oceanographic Institution (WHOI) were recently awarded a $500,000 grant from the National Oceanic and Atmospheric Administration’s (NOAA) Climate Observations and Monitoring (COM) program to develop machine learning tools to improve estimates of air-sea heat exchange in the Arctic Ocean and adjacent seas. These tools are expected to fill critical gaps in climate models, which currently show large disparities when simulating the rate of polar ice melt.
Recent advances in remote sensing technologies have provided researchers with the data they need to better understand the forces behind Arctic ice melt and the implications of that heat exchange between the ocean and the atmosphere. These real-world measurements will allow researchers to develop algorithms that will validate and improve satellite-based modeling of the Arctic and subarctic regions.
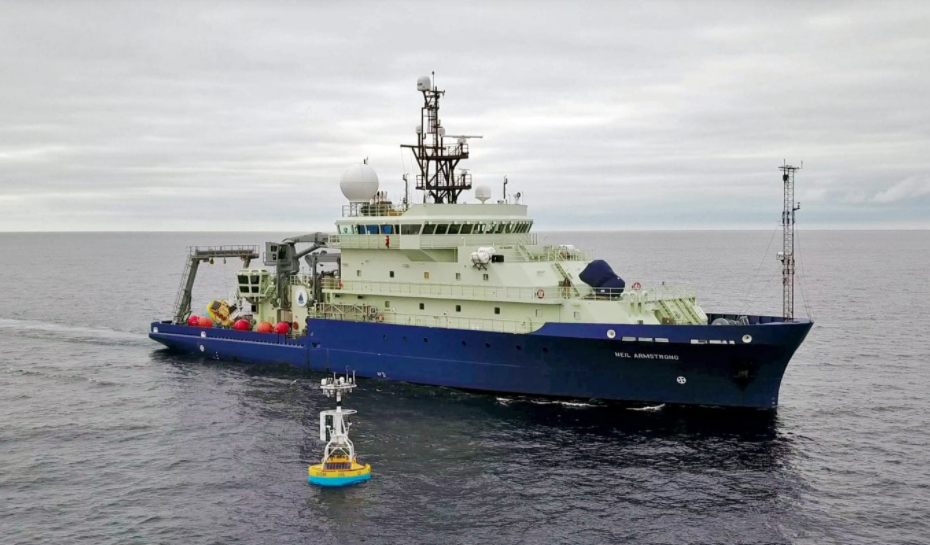
Due to the difficulty of accessing the Arctic Ocean—especially during the stormy winter months—and the complexity of measuring air-sea heat exchanges, there has previously not been enough quality data to incorporate ice melt and seasonal changes into climate models. This challenge was overcome by recent advances in long-term remote data collection at high latitudes. For the first time in 2019, an Ocean Observatories Initiative (OOI) surface buoy in the Irminger Sea collected over a year’s worth of sensor data, including icy and windy winter conditions. Located in an important area of ocean circulation, the data collected from the OOI surface buoy provides critical verification for satellite-based models.
Lisan Yu, a WHOI senior scientist and the project’s principal investigator, said a machine learning-based framework will improve the accuracy of ocean-surface forcing estimates used to model the global climate. She said it will also improve the accuracy of ice and weather forecasts in a region that is rapidly opening up to commercial exploration. WHOI Senior Scientist Al Plueddemann, who also serves as a co-principal investigator for OOI and project lead for its Coastal and Global Nodes, is a collaborator on this project.
Read the full release here.
Read MoreMaking OOI’s Website Accessible to All
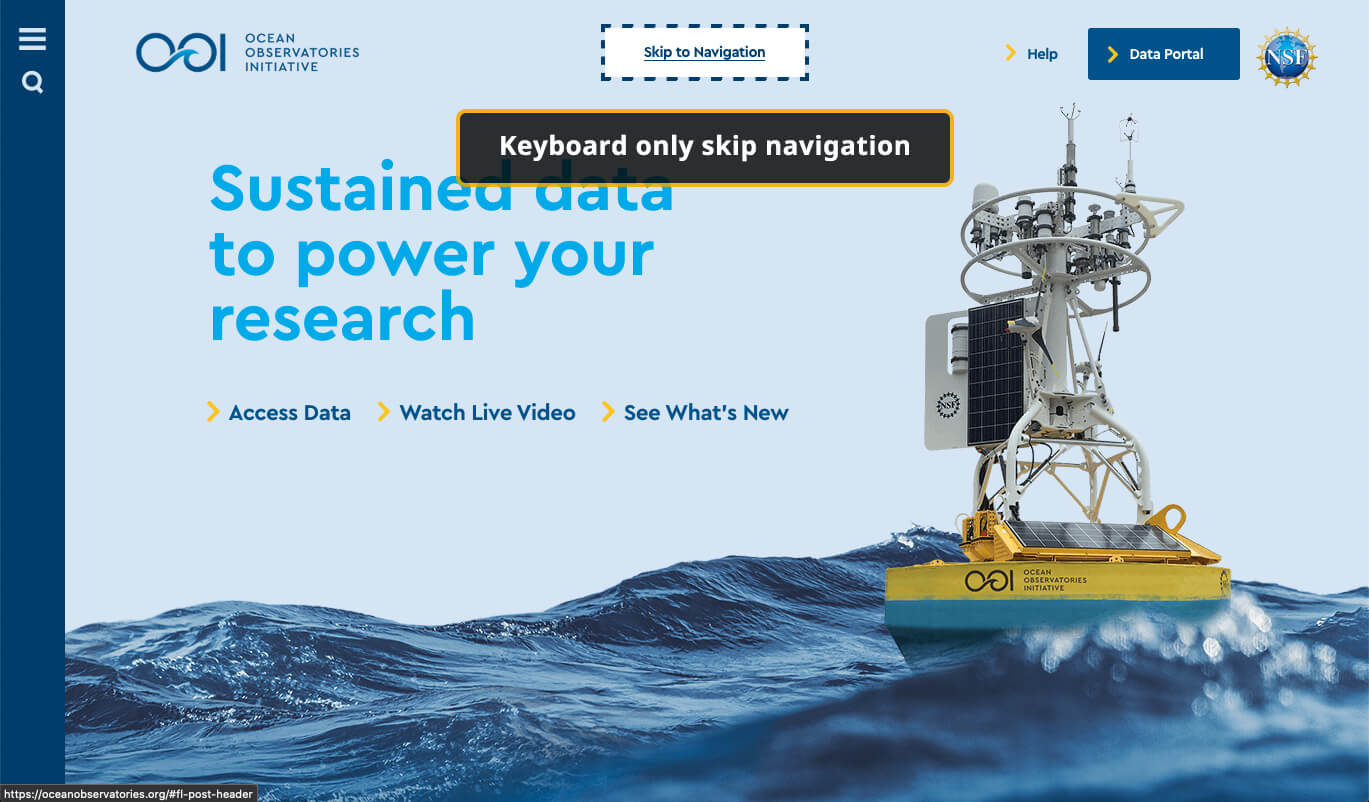
[media-caption path="/wp-content/uploads/2020/10/OOI-screenshot-01.jpg" link="#"]The OOI website was redesigned with accessibility and ease of use for all visitors as a top priority. [/media-caption]
Accessibility means different things to different people. When visiting a website by the visually or physically impaired, accessibility means the difference between being able to navigate and understand the site or getting lost in a labyrinth-like design with literally hidden pitfalls and navigational traps.
In redesigning OOI’s website, making the site accessible and easily navigable to all visitors was a top priority. “Websites are all about the user experience. It’s not simply about building something to experience the beauty on the screen, but rather building for everyone trying to access that information and treating them equally,” explained Nate King, web developer with Trapeze, the firm which designed and coded the new site.
“To be perfectly accessible, there would be very little design, most websites would consist of simple text on a screen. But there is a reason we put beauty into websites and that we please people with what is seen on the screen. That doesn’t mean that beauty and the experience have to be at the expense of accessibility. They can be intertwined as we have successfully done with OOI’s new website.”
King used a three-pronged approach to make OOI’s website accessible to those with visual, and other physical limitations. He developed a navigation system for keyboard users, who do not or are unable to navigate using a mouse, which takes them through the content in a logical way. He also incorporated audible-only information into the design that will help those who are blind or with other visual impairments navigate the site by providing context regarding its organization and logic when using screen reader technology. Lastly, King worked with the designers to ensure people with visual impairments such as color or partial blindness could successfully navigate the site and be able to differentiate its various components.
“As long as you put the time and effort into it—preferably from the outset—a site can be both beautiful and accessible, which we achieved here,” added King.
The OOI website represents a high standard for accessibility as it attempts to meet or exceed the Web Content Accessibility Guidelines (WCAG). Meeting such accessibility guidelines levels the playing field for all visitors to the website, giving every visitor to the site equal access to the information.
King further explained that the OOI site was designed with a logical approach to enhance its accessibility. For example, headline sizes/styles are used in a predictable way—headings contain semantically correct structure, the single H1 contains H2 headlines which in turn contain H3 headlines—rather than choosing headline sizes based on the designer’s preference. The accompanying audible information guides the visually impaired and provides context when visiting the site, better explaining the navigation of the site, how the site is referenced through search, and where the visitor will land next. And, the OOI website’s design allows for magnification up to 200 percent to provide more visitors with the opportunity to experience and explore the site. “A website is not a piece of paper. It can expand, contract, and offers up all sorts of ways to get information to visitors,” said King. “We are delighted to have used an empathy-driven design methodology to help OOI make its site accessible to all.”
[media-caption path="/wp-content/uploads/2020/10/OOI-screenshot-04.jpg" link="#"] Keyboard navigation is accompanied by audio that explains where one is on the site and what to expect next.[/media-caption]
[media-caption path="/wp-content/uploads/2020/10/OOI-screenshot-03.jpg" link="#"] Context provided by the keyboard navigation system allows user to move through OOI’s website with ease.[/media-caption]
Read More
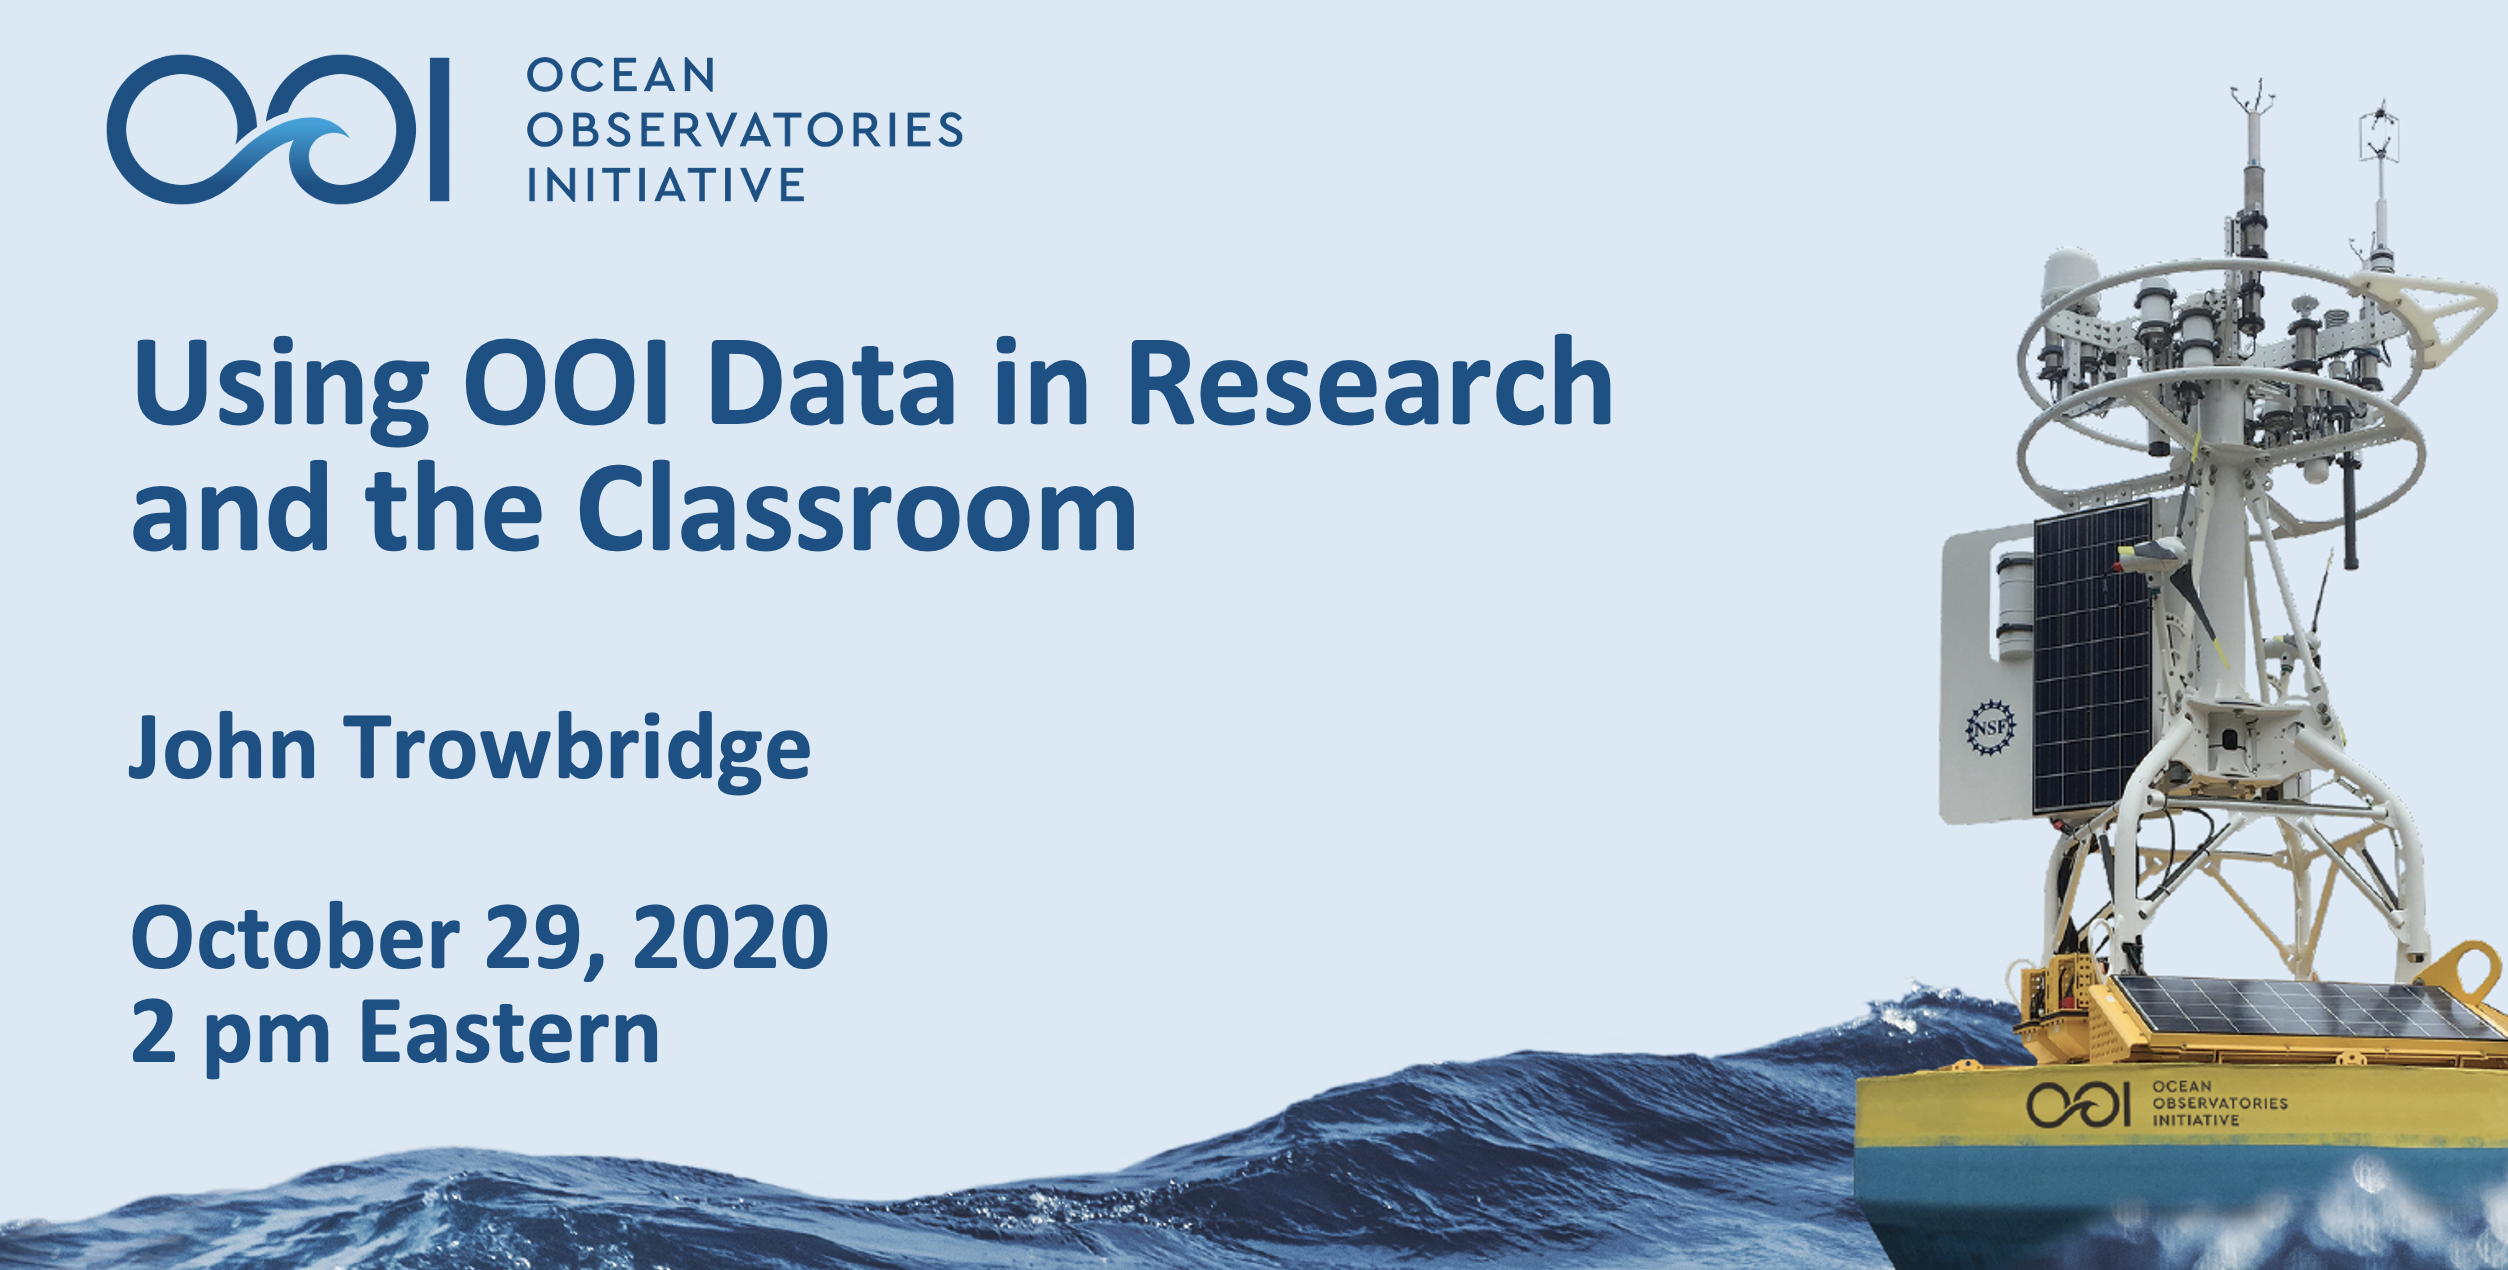
Oct 29: Opportunity to Learn More About the OOI
[media-caption path="/wp-content/uploads/2020/10/Screen-Shot-2020-10-23-at-2.33.33-PM.png" link="#"]To attend, please register for the webinar at bit.ly://newtoOOI. [/media-caption]
There is still time to register for this webinar here to learn more about OOI and how it can advance your research and aid you in the classroom.
Please join OOI Principal Investigator John Trowbridge in this webinar as he provides an overview of OOI, what it is, how it delivers data, and how researchers and instructors are using OOI data to advance what is known about the changing ocean. There will be ample opportunity to ask questions and engage in discussion.
This webinar is particularly helpful for those new to OOI.
Read More
OOI Booth Schedule
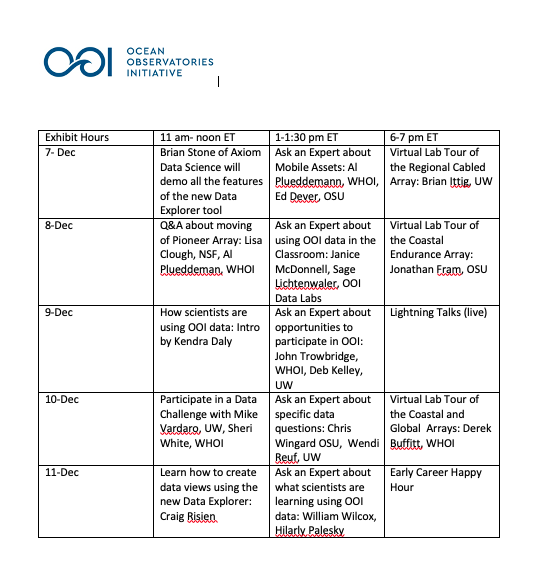
The Ocean Observatories Initiative has a full plate of activities at its virtual AGU booth during AGU’s exhibit hall hours. Registration is required for the 11 am-noon time slots, indicated below. Please join us for all other activities, by simply clicking here:
Monday 7 December
- 11 am-noon Eastern: Learn how to use the new Date Explorer: Register here.
Brian Stone of Axiom Data Science will demonstrate the many features of the OOI’s new data discovery tool, Data Explorer.
- 1-1:30 pm Eastern: Ask an expert about specific data questions
OOI Data Team members Chris Wingard with the Coastal Endurance Array and Wendi Ruef with the Regional Cabled Array will be available to answer any and all questions.
- 6-7 pm Eastern: Curious about how OOI collects and delivers data?
Join Derek Buffitt, program manager for the Coastal and Global Scale Nodes (CGSN), for a virtual lab tour of the CGSN Facility at Woods Hole Oceanographic Institution.
Tuesday 8 December
- 11 am-noon Eastern: Announcement forthcoming
- 1-1:30 pm Eastern: Ask an expert about using OOI data in the classroom .
Sage Lichtenwaler from the OOI Ocean Data Labs has helped hundreds of professors seamlessly integrate OOI into undergraduate classrooms. He will be on hand to answer your question on how to use OOI data in your course instruction.
- 6-7 pm Eastern: Curious about how OOI collects and delivers data?
Join Jonathan Fram, program manager for the Coastal Endurance Array (EA), for a virtual lab tour of the EA Facility at Oregon State University.
Wednesday 9 December
- 11 am-noon Eastern: Hear from scientists who are using OOI data to advance their research: Register here.
Kendra Daly, chair of the Ocean Observatories Initiative Facilities Board, will provide a quick look at what’s new in the OOI’s latest science plan.
Glen Gawarkiewicz, Woods Hole Oceanographic Institution, will share what is now known about the shelf break exchange process.
Andrew Leising, Southwest Fisheries Science Center, National Oceanic and Atmospheric Administration, will review what we have learned about marine heatwaves.
Douglas S. Luther, University of Hawai’i at Manoa, will discuss internal tide impacts of ocean circulation.
Wu-Jung Lee, University of Washington, will review how echosounder data are accelerating marine ecological research. (To be confirmed).
- 1-1:30 pm Eastern: Ask an expert about opportunities to participate in OOI
OOI Principal Investigator John Trowbridge and Co-Principal Investigator and lead of OOI’s Regional Cabled Array Deborah Kelley will be on hand to answer any and all questions about how to get involved in the OOI.
- 6-7 pm Eastern: Live Lightning Talks
Eleven presenters will share the latest research investigations using OOI data, as well as examples of how OOI data are being integrated into classroom instruction.
Thursday 10 December
- 11 am-noon Eastern: Participate in a data challenge: Register here.
Two members of OOI’s data team, Mike Vardaro, RCA and University of Washington, and Andrew Reed, CGSN and Woods Hole Oceanographic Institution, will lead participants through a series of three data challenges to demonstrate the capabilities of the Data Explorer.
- 1-1:30 pm Eastern: Ask an expert about opportunities OOI’s mobile assets
Coastal and Global Scale Node Team members Al Plueddemann or Peter Brickley and Coastal Endurance Lead Edward Dever will answer questions about OOI’s mobile assets, everything from why we use them to what we are learning from them.
- 6-7 pm Eastern: Curious about how OOI collects and delivers data?
Join Brian Ittig or Dana Manalang of the Regional Cabled Array Team (RCA) for a virtual lab tour of the RCA Facility at the University of Washington.
Friday 11 December
- 11 am-noon Eastern: Learn how to create data views using the new Date Explorer: Register here.
OOI Data Team and Coastal Endurance team member Craig Risien will guide us through the steps of creating a data view using Coastal Endurance array data to demonstrate this feature of OOI’s new data discovery tool, Data Explorer.
- 1-1:30 pm Eastern: Ask an expert about what scientists are learning using OOI data
Join William Wilcock, University of Washington, and Hilary Palvesky, Boston College, to hear what they have learned using OOI data and how you might do the same.
- 6-7 pm Eastern: Early Career Scientists’ Happy Hour
Close down the OOI virtual booth by joining your friends and colleagues at a virtual hour. This is an opportunity to network, reconnect with friends and colleagues, and raise a glass together.
All activities other than the 11 am time slots can be accessed here. Look forward to seeing you soon!
Read More
What We Are Learning
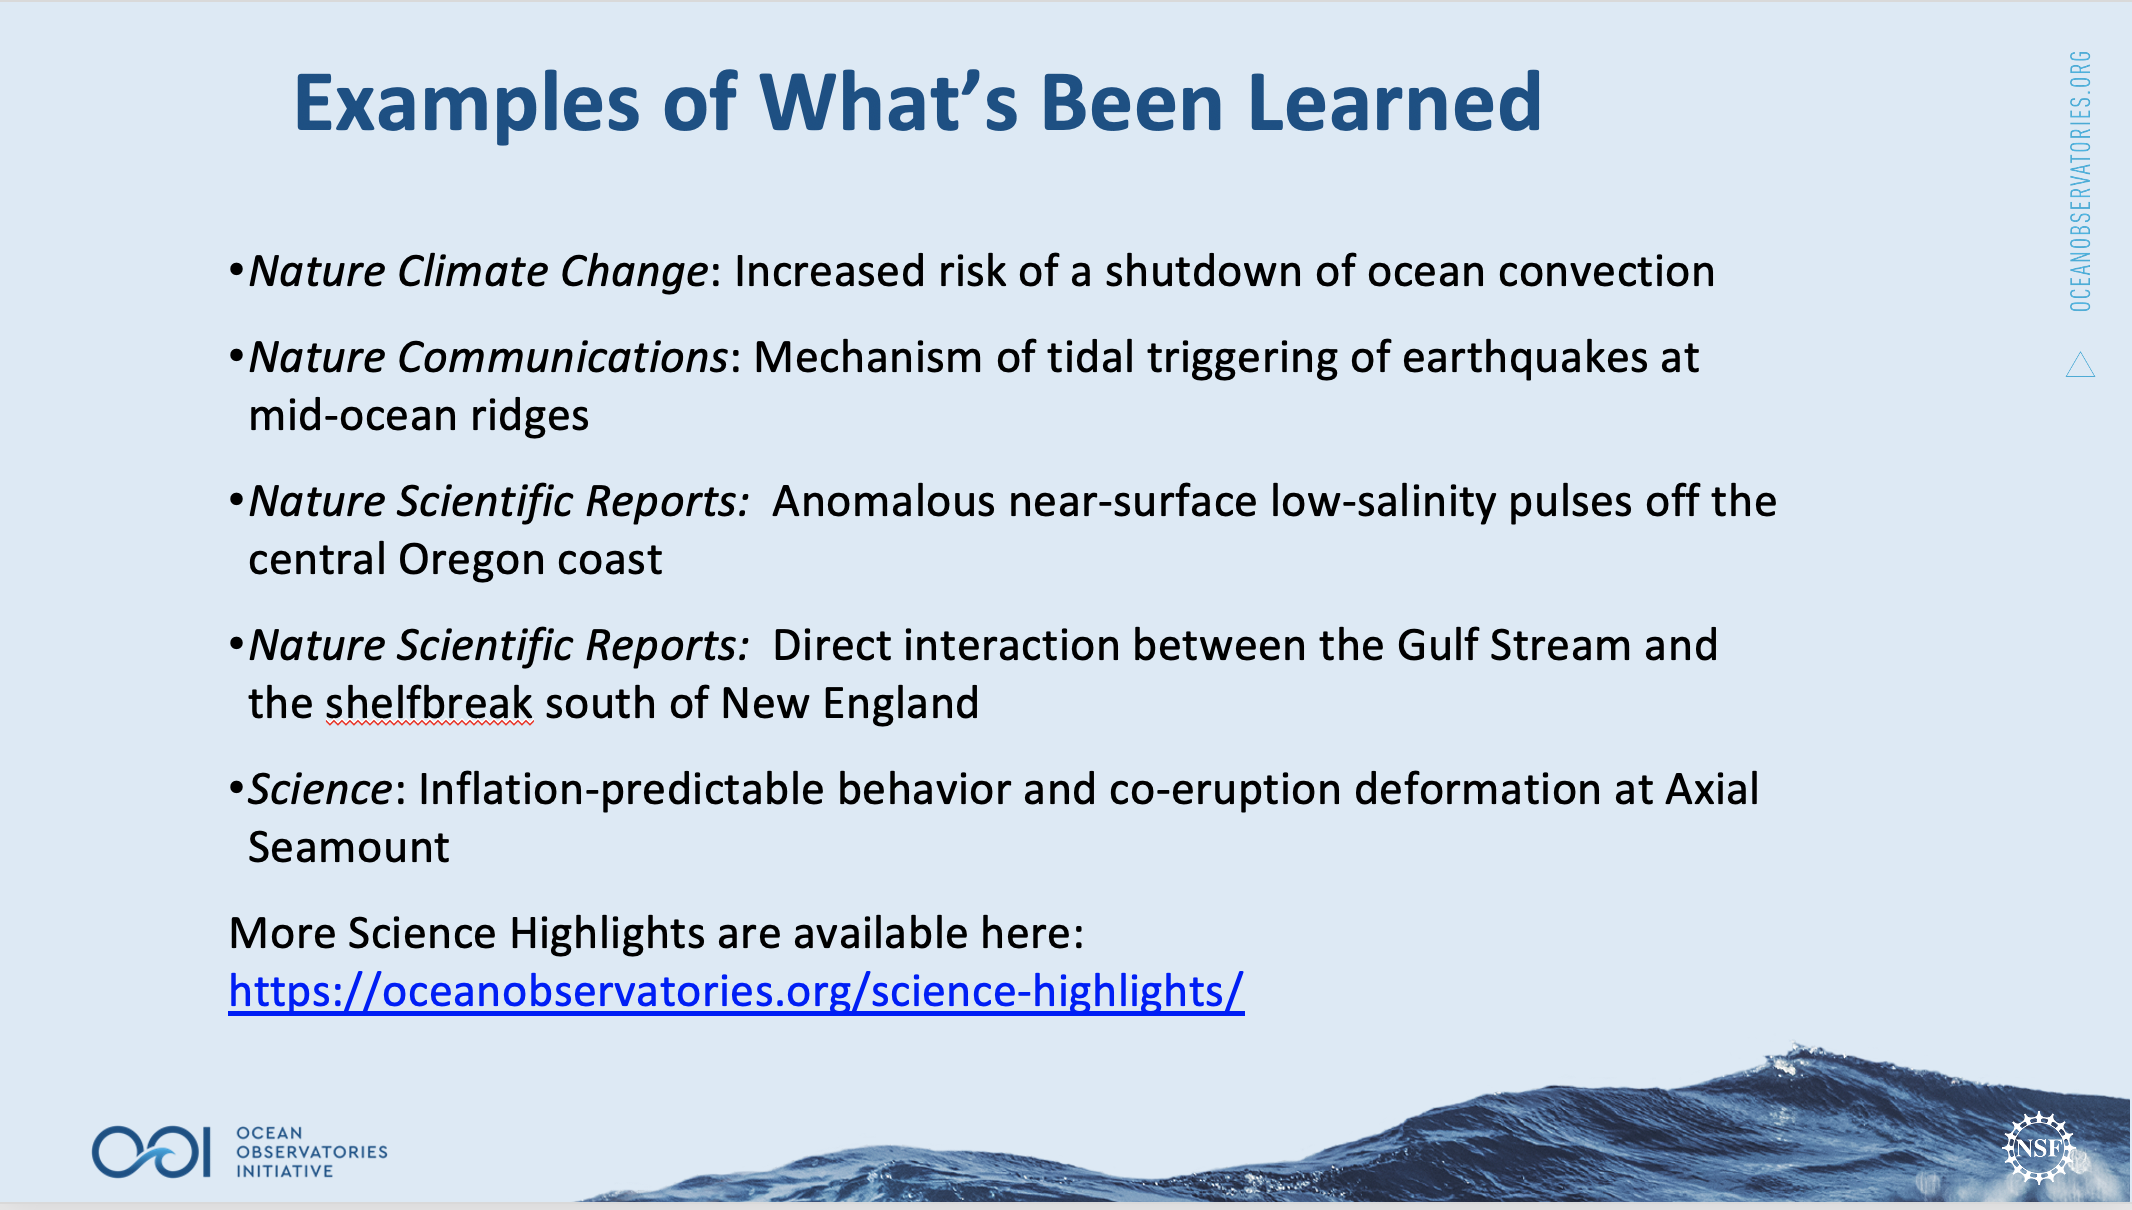
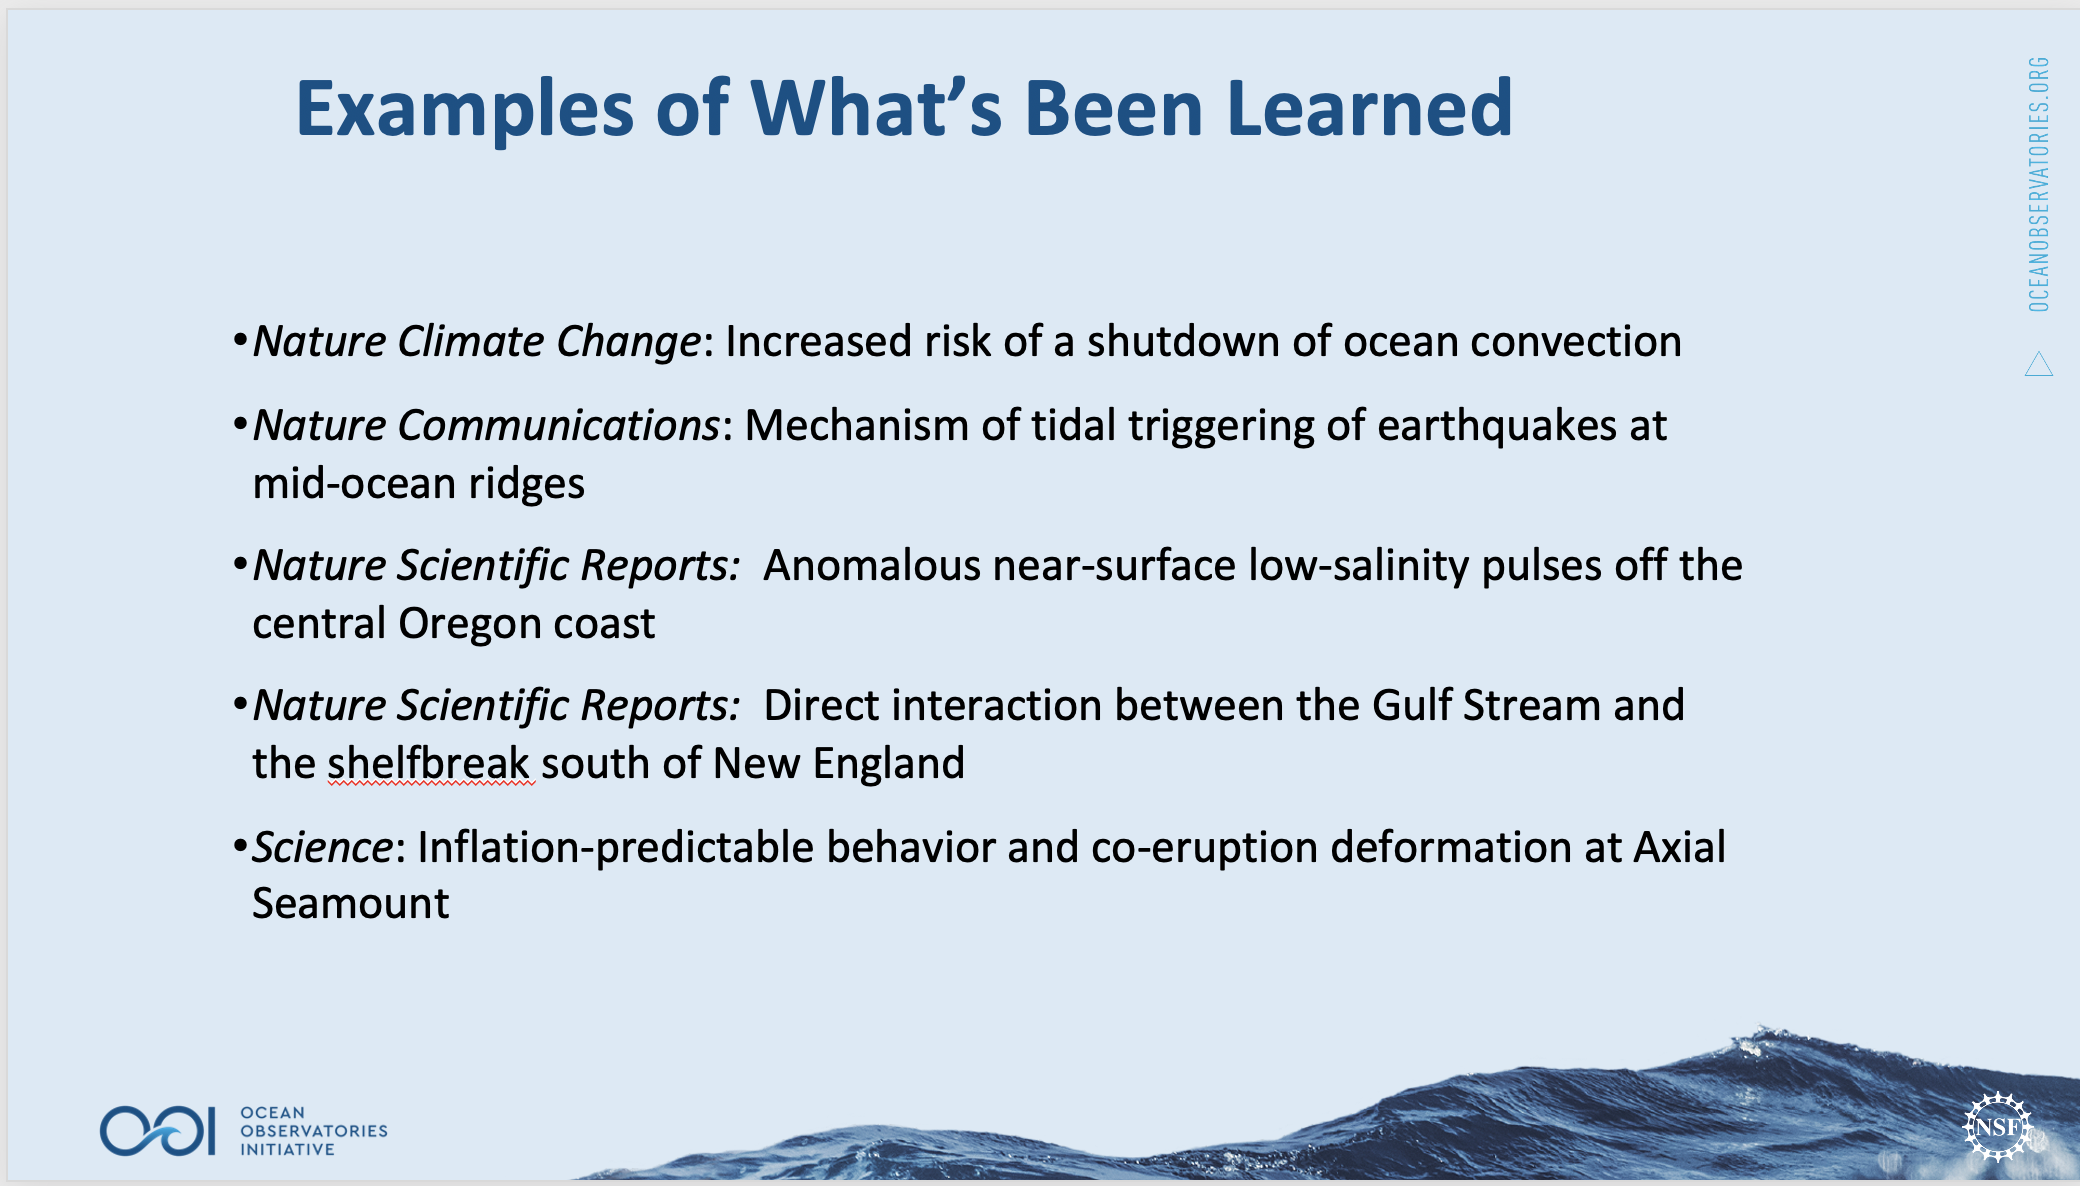
More Science Highlights are available here: https://oceanobservatories.org/science-highlights/
And here: https://oceanobservatories.org/science/publications/
Read More
New Data Explorer Live! Demo 21 October
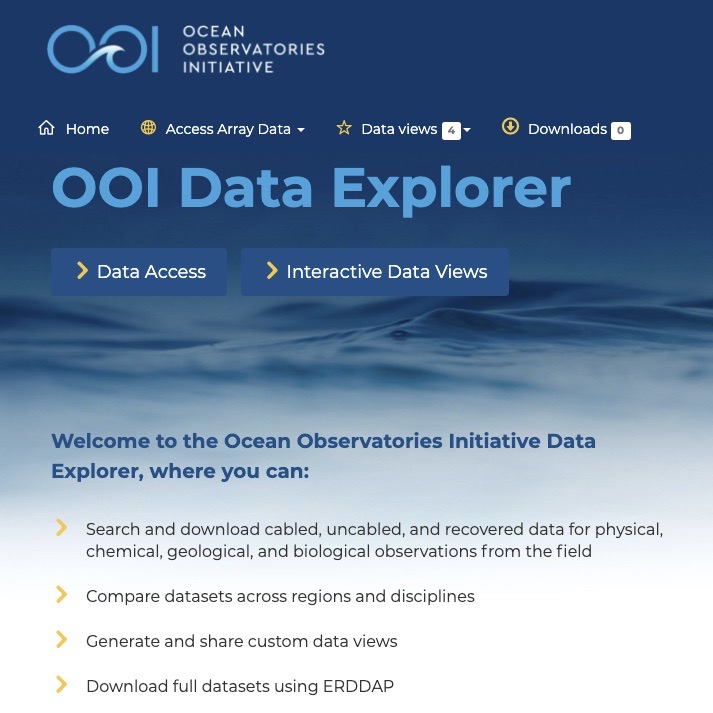
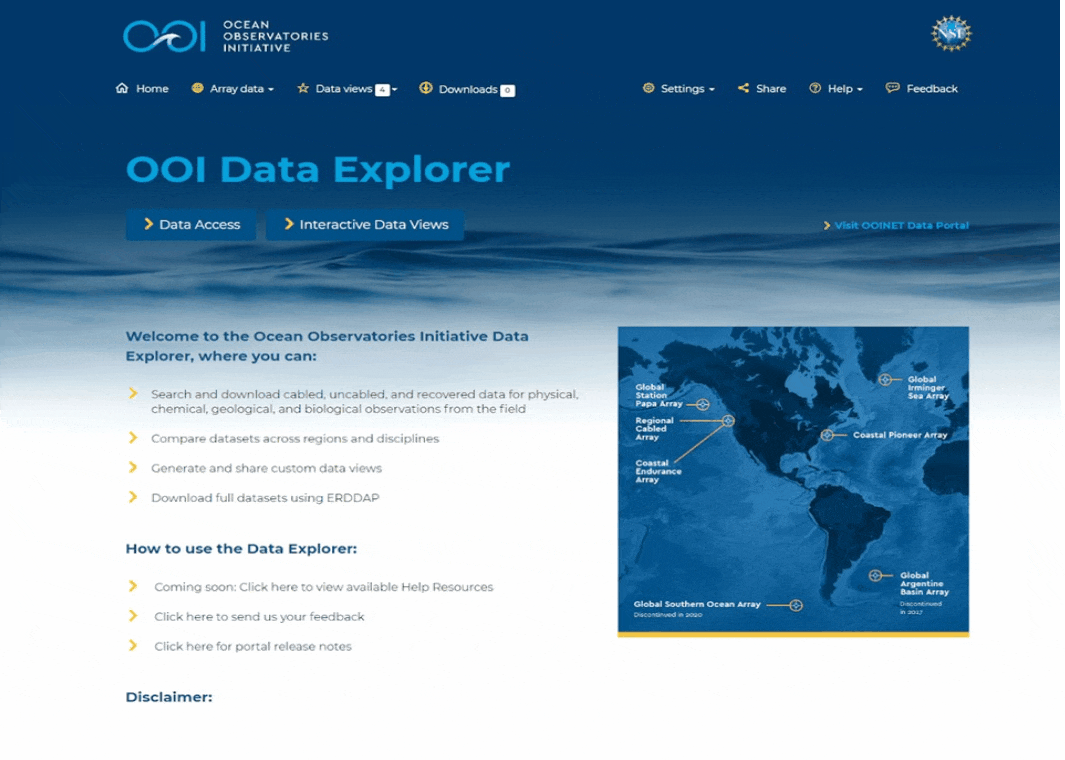
As of today, accessing, visualizing, and integrating OOI data into research and classrooms is a whole lot easier. The Ocean Observatories Initiative launched its new data exploration tool – OOI Data Explorer version 1.0 on 5 October. Data Explorer allows users to search and download cabled, uncabled, and recovered data, compare datasets across regions and disciplines, generate and share custom data views, and download full data sets using ERDDAP.
The OOI Data Team worked with Axiom Data Science to develop a data exploration system that is both powerful and user friendly. Version 1.0 has already been beta tested over the past three months by a subset of OOI scientific data users. This group’s feedback has improved Data Explorer, making it ready for broader distribution and use.
A live demonstration of Data Explorer is scheduled for 21 October at 2 pm EDT. This timeframe will allow users to try their hands using Data Explorer and come to the demonstration ready with specific questions about accessing data or suggestions on functions that could further enhance the user experience. To reserve a spot at the live demo, please register here.
“Data Explorer version 1.0 is the culmination of a process of listening to OOI data users and responding by implementing easier, more efficient, and useful means to deliver OOI data to them,” explained Jeffrey Glatstein, head of OOI’s Cyberinfrastructure, who guided a team of data and visualization experts in developing the tool. “It is an excellent tool that has been refined over the test period, and which we will continue to refine it in response to users’ suggestions. While continued improvements will be made and more data continually added, Data Explorer version 1.0 offers a great new way to find, access, and use OOI data.”
To ensure that all OOI data users maintain access to data, OOI’s current data portal will remain accessible and functional until the foreseeable future. Once all data have been exported to Data Explorer, tested, and vetted, only then will a complete switch be made to this new innovative tool.
The developers caution that Data Explorer version 1.0 may still have a few bugs, and users are asked to report them so the tool can be improved.
Added Glatstein, “Data Explorer is really a community-driven tool and it will be exciting to see how we can refine and improve it to meet the needs of our community.”
Read MoreNSF’s Division of Ocean Sciences to Provide PostDoc Fellowships in 2021
The National Science Foundation’s Ocean Science Division (OCE) announced plans to launch a postdoctoral research fellowship program later this fall. Assistant Director for Geosciences William E. Easterling noted that such fellowship programs often serve as launching pads for successful careers. He also encouraged applications that incorporate existing data offered by NSF-funded program such as the Ocean Observatories Initiative.
OCE anticipates awarding about 15 postdoctoral fellowships that will start in mid-2021 or later. Selected fellows will affiliate with a research institution and conduct research on topics supported by OCE.
The Ocean Observatories Initiative offers potential applicants the opportunity to avail themselves of targeted and long-term ocean data and provides useful resources that can aid in the development of proposals that incorporate OOI data. OOI, for example, offers webinars on how to add instruments or platforms to its infrastructure. Opportunities for ship-time experiences, as well as possibilities to modify or add to existing OOI sampling to help answer research questions. OOI also offers tools to incorporate OOI data into research, including a recently launched Data Explorer tool that makes it easy to download and visualize datasets and customize data views.
We will keep an eye out for further information about this OCE program. In the meantime, we encourage you to contact OOI’s HelpDesk to begin to discuss and explore the many opportunities that exist to integrate OOI data into a fellowship application.
Read More
OSU Assumes Cyberinfrastructure Responsibility for OOI
![]()
Woods Hole Oceanographic Institution (WHOI) and Oregon State University (OSU) jointly announced that OSU will assume responsibilities for the systems management of the cyberinfrastructure that makes data transmission for the Ocean Observatories Initiative (OOI) possible through September of 2023. OSU was awarded this role after a systematic and thorough selection process. Rutgers, the State University of New Jersey, has provided OOI’s Cyberinfrastructure systems management since 2014, and will leave the OOI Program in 2021 following a transition period with OSU. The OOI consists of five instrumented observatories in the Atlantic and Pacific Oceans outfitted with more than 900 instruments that continually collect and deliver data to shore via a cyberinfrastructure, which makes the data available to anyone with an Internet connection. The demands on the cyberinfrastructure are great, as it stores 73 billion rows of data, and has provided 36 terabytes of data in response to 189 million user requests since 2014. With the data requests and delivery demands increasing each year, the OOI has the capability to provide data that allows inquiries into episodic ecosystem events in real-time, as well as investigations using long-term time series data. The OOI is made possible through a funded five-year cooperative agreement to WHOI from the National Science Foundation. The OSU award is for $6 million over a three-year period.
“We are delighted that OSU has the capabilities and expertise to take on this hugely important task,” says John Trowbridge, Principal Investigator of the Program Management Office of the OOI at WHOI. “The OOI has become a dependable source of real-time ocean data, helping scientists answer pressing questions about the changing ocean. Educators use real-time ocean data to teach students about the fundamentals of oceanography, the global carbon cycle, climate variability, and other important topics. The team at OSU will help advance this work and ensure that OOI data are served reliably to an ever-growing audience.
“We are also extremely grateful to the Rutgers team for the excellent foundation they established over the past six years that will allow a seamless transition to the OSU cyberinfrastructure team. Rutgers was an important partner that helped establish OOI as a reliable data provider,” adds Trowbridge.
“OSU brings the perfect mix of hardware, software, and ocean data experts to ensure that we are able to store and serve up this gargantuan amount of important ocean data,” adds Anthony Koppers, Principal Investigator for the OSU Cyberinfrastructure Systems Team. “We have the key personnel and systems in place that will allow us to seamlessly take on the challenge of storing and serving OOI data, strategically planning for future data demands and implementing cybersecurity. We also will be working hand-in-hand with the OOI’s Data Management Team to ensure the data meets the highest quality standards.”
OSU’s cyberinfrastructure will handle telemetered, recovered, and streaming data. Telemetered data are delivered to the cyberinfrastructure from moorings and gliders using remote access such as satellites. Recovered data are complete datasets that are retrieved and uploaded to the cyberinfrastructure once an ocean observing platform is recovered from the field. Streaming data are delivered in real time directly from instruments in the field.
Read More
Ocean Data Labs Tutorial at WHOI Available Online
The Zoom screen was full as 40 people participated in the third of Woods Hole Oceanographic Institution’s (WHOI) Data Science Summer Series on 4 August 2020. Research Programmer Dr. Sage Lichtenwalner, of Rutgers, the State University of New Jersey, who helped design and implement the Ocean Observatories Initiative (OOI) Ocean Data Labs, presented.
Lichtenwalner gave an overview of the many resources available through the Ocean Data Labs project, which is developing, testing, refining, and disseminating easy-to-use, interactive Data Explorations and Data Lab Notebooks for use in the classroom. Entertaining and information, the hour-long presentation flew by as Lichtenwalner presented tricks and tips to downloading OOI data, how to use OOI data in python and other computing platforms such as the Google Colab interface, and ended with a demonstration visualization of OOI data collected by its Pioneer Array. The complete webinar can be viewed here.
Dr. Stace Beaulieu, a senior research specialist in Biology and coordinator of WHOI’s Ocean Informatics Working Group, planned and hosted the session.
Read More
Partnerships Expand Use of OOI Data
The OOI’s primary mission is to make its data widely available to multiple users. One way it achieves this, on a broad scale, is by establishing partnerships with other organizations that also distribute ocean observing data. For example, OOI currently partners with the Integrated Ocean Observing System (IOOS), which provides integrated ocean information in near real-time and tools and forecasts to apply the data, the National Data Buoy Center (NDBC), which maintains a network of data collecting buoys and coastal stations as part of the National Weather Service, the Global Ocean Acidification Observing Network (GOA-ON), which uses international data to document the status and progress of ocean acidification, and Incorporated Research Institutions for Seismology (IRIS), a consortium of over 120 US universities dedicated to the operation of science facilities for the acquisition, management, and distribution of seismological data.
NANOOS: Making data relevant for decision-making
NANOOS, the Northwest Association of Networked Ocean Observing Systems, which is part of IOOS, has been operational since 2003, establishing trusting, collaborative relationships with those who use and collect ocean data in the Pacific Northwest. NANOOS has been an exemplary partner in ingesting and using OOI data. Part of its success lies in advance planning. NANOOS, for example, had determined that OOI assets, in addition to achieving the scientific goals for which they were designed, could fill a data void in IOOS assets running north and south in an area between La Push, WA, and the Columbia River, well before the OOI assets came online.
[media-caption type="image" class="external" path="https://oceanobservatories.org/wp-content/uploads/2020/09/Screen-Shot-2020-09-22-at-2.25.24-PM.png" alt="Endurance Array" link="#"]OOI’s Coastal Endurance Array provides data from the north and south in an important upwelling area in the northeastern Pacific. Gliders also traverse this region, with glider data available through both the IOOS Glider Data Assembly Center and the NANOOS Visualization System. Credit: Center for Environmental Visualization, University of Washington.[/media-caption]According to Jan Newton, NANOOS executive director at the University of Washington, “One of the reasons NANOOS is so effective is that our guiding principle is to be cooperative and not compete. If the public is looking for coastal data, for example, we want to make sure they can access it and use it, rather than having them trying to sort through whether it is a product of IOOS or OOI. We operate with the philosophy of maximizing the discoverability and service of the data and OOI has been a great partner in our mission. We’ve been really happy about how this partnership has played out.”
[media-caption type="image" class="external" path="https://oceanobservatories.org/wp-content/uploads/2020/09/Regional-Cable-Array-revised-.jpg" alt="Revised RCA" link="#"]OOI’s Regional Cabled Array also contributes data in the NANOOS region from its Slope Base and the Southern Hydrate Ridge nodes. Credit: Center for Environmental Visualization, University of Washington.[/media-caption]NANOOS has made a huge effort on its data visualization capabilities, so people can not only find data, but look at it in a relative way to use it for forecasting, modeling, and solving real-world problems. OOI data are integral in helping support some of these visualization and modeling efforts, which commonly play a role in situations facing a wide cross-section of society.
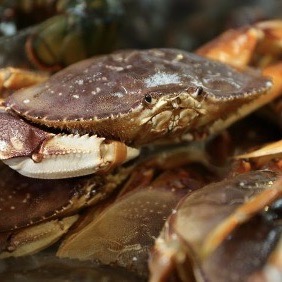
An example of this applicability played out in improved understanding of hypoxia (oxygen-deficient conditions) off the coast of Oregon, which had resulted in mass mortality events of hypoxia-intolerant species of invertebrates and fish, in particular, Dungeness crabs. Allowing access through NANOOS to near real-time oxygen data from OOI assets has allowed the managers and fishers to come up with some plausible solutions to maintaining this valuable resource. The Dungeness crab fishery is the most valuable single-species fishery on the U.S. West Coast, with landed values up to $250 million per year, and plays an enormous cultural role in the lives of tribal communities in the region, as well.
[media-caption type="image" class="external" path="https://oceanobservatories.org/wp-content/uploads/2020/09/Dungeness-Crab.jpg" alt="Dungeness Crab" link="#"]OOI oxygen data have helped resource managers and fishers maintain the valuable Dungeness crab fishery, which is the most valuable single-species fishery on the U.S. West Coast.[/media-caption]Researcher Samantha Siedlecki, University of Connecticut, reports that in late June of 2018, for example, fishers in the region were pulling up dead crabs in pots without knowing the cause. Scientists accessed near real-time OOI observations through the NANOOS data portal and found that the Washington Inshore Surface Mooring of the Coastal Endurance Array (EA) had measured hypoxia from June 7th onwards. So, the data confirmed real-life conditions and explained the crab mortalities.
This is important because such occurrences are helping to confirm models and enhance forecasting to better manage these events by providing guidance to fishers and resource managers. In this instance, the forecast indicates what regions will likely require reduced time for crabs to remain “soaking,” caged in the environment during hypoxia events, to ensure crabs are captured alive, and also aid in spatial management of the fishery itself. OOI data will play a role in continual improvements in forecasting in this region and the fishery by providing data during winter months, ensuring historical data are available and quality controlled for use in forecasting, and continuing to serve data in near real-time.
Adds Newton, “I can’t tell you how many OOI and other PIs come up and tell me how they love that their data are having a connection to real world problems and solutions. It makes their research go farther with greater impact by being part of this NANOOS network.”
Explains Craig Risien, Coastal Endurance Array senior technician at Oregon State University, “OOI is collecting an incredible wealth of data, offering a treasure chest of material to write papers, write proposals, include in posters, and now it is being used in practical ways for finding scientific solutions to environmental problems. Every time we look at the data, there’s a new story to tell. We always find something new, something interesting, and encourage everyone to have a look and experience the same usefulness and excitement about OOI data.”
Sharing OOI data
The OOI is in talks with the IOOS regions serving the Northeast Atlantic and the Mid-Atlantic to see how OOI data might enhance their networks, as well. The OOI also has been providing data to the National Data Buoy Center since 2016, supplementing the data collected by NDBC’s 90 buoys and 60 Coastal Marine Automated Network stations, which collectively provide critical data on unfolding weather conditions. And, the OOI has been providing data to Global Ocean Acidification Observing Network (GOA-ON), since mid-2019, ground-truthing on site conditions in real to near real-time, which is critical to understanding conditions contributing to ocean acidification and improving modeling capabilities to determine when it might occur. OOI’s Regional Cabled Array has been providing seismological, pressure and hydrophone data to Incorporated Research Institutions for Seismology (IRIS) since 2014, providing a wealth of data from Axial Seamount and on the Cascadia Margin. For example, on April 24, 2015 a seismic crisis initiated at the summit of Axial Seamount with >8,000 earthquakes occurring in 24 hrs, marking the start of the eruption. Starting at 08:01 that same day, the network recorded ~ 37,000 impulsive events delineating underwater explosions, many of which were associated with the formation of a 127 meter thick lava flow on the northern rift.
Data examples
If you would like to test drive some of the OOI data in NANOOS, NDBC, and GOA-ON, here are some examples below:
IOOS
· OOI data in the NANOOS Visualization System (NVS)
NDBC
· Coastal Endurance Array data (Stations 46097, 46098, 46099, 46100)
· Coastal Pioneer Array data (Stations 44075, 44076, 44077)
· Global Irminger Array data (Station 44078)
GOA-ON
· Coastal Endurance Array data
IRIS
· Regional Cabled Array (While searching within IRIS for OOI data, use the two-letter IRIS network designator “OO.”)
Read More