
News
Bringing Computer VISION into the Classroom Utilizing RCA Imagery and the OOI Jupyter Hub

There is a rapidly growing demand in Earth system science for workforce expertise in machine learning. To increase marine science students understanding of, and ability to use, artificial intelligence tools, Dr. Katie Bigham and School of Oceanography undergraduate student Atticus Carter are teaching an undergraduate class focused on applying “computer vision” (processing imagery with the computer) to marine science problems. The Computer Vision Across Marine Sciences prototype course for UW undergraduates in the Ocean Technology program includes the development of a Jupyter Binder (a notebook collecting multiple Jupyter Notebooks). Currently, an enormous amount of time is required to manually process imagery collected in marine environments, resulting in a major bottleneck for all research utilizing marine imagery. In this course, students gain an understanding of computer vision capabilities, model training and evaluation, and research applications. The course utilizes real-world datasets from the OOI Regional Cabled Array (RCA), including imagery from remotely operated vehicles utilized on RCA cruises and fixed camera imagery on the array, and from other systems, exposing students to diverse marine habitats. For their final projects, students will develop bespoke models utilizing datasets of their choosing, including RCA imagery. Students can employ the OOI Jupyter Hub for additional computational power, facilitating easy access to imagery and necessary resources. In collaboration with a faculty member in the UW School of Education quantitative data are collected on student learning and feedback for course improvement. The open-access course text is actively under development and is accessible at OceanCV.org. The team aims to improve the materials based on student feedback. Carter will present findings and learnings from the first version of the class at ASLO 2025 Aquatic Sciences Meeting in the Building Data Literacy Skills in the Next Generation of Aquatic Scientists session hosted by OOI Data Labs.
[caption id="attachment_35685" align="alignnone" width="640"] Figure 27: Introductory page for Computer Vision Across Marine Sciences Jupyter Binder and example of artificial intelligence-based predictions of animals in imagery collected by the Regional Cabled Array digital still camera at Southern Hydrate Ridge. This work is supported by an NSF OCE Postdoctoral Research Fellowship to Dr. K. Bigham, University of Washington.[/caption]
Read More Exploring the Coastal Surface Piercing Profiler (CSPP): Capabilities, Challenges & Impact
The Coastal Surface Piercing Profiler (CSPP) is an important component of the Ocean Observatories Initiative (OOI), uniquely designed to collect high-resolution data from the ocean’s surface to the seafloor over the Oregon Shelf. Importantly, as the name implies, the CSPP does not stop at the ocean surface but some of its sensors actually pierces the interface into the near surface atmosphere. Operating in a highly dynamic environment, the CSPP provides valuable datasets that enhance our understanding of ocean-atmosphere interactions, nearshore processes, and biological activity in the upper water column.
In this interview, Jon Fram, co-PI and Program Manager for the Endurance Array (EA), explores the technical capabilities of the CSPP, the difficulties of operating in dynamic coastal conditions, and the significance of its unique datasets. With its ability to profile up through the air-sea interface and its collection of advanced sensors, the CSPP bridges critical gaps in ocean observation. Jon discusses the practical realities of deploying and maintaining the profiler, including a notable recovery effort that illustrates the complexity of coastal oceanographic work.
How does the CSPP operate in such a dynamic environment, and what are some of the challenges associated with deploying and maintaining it?
In between profiles, CSPPs park near the seafloor where currents from waves and tides are relatively calm. As CSPPs winch themselves up to the air-sea interface, they measure winchline tension and they alter their profiling speed to keep the tension constant. This behavior enables CSPPs to surface when waves are up to 3 meters high without the winchline over-wrapping or experiencing snap loads. We monitor conditions so CSPPs don’t profile when seas are too rough. Most of a CSPP’s battery energy goes to operating its winch, so CSPPs need to be recovered/redeployed every 2-3 months and they are limited to 2-4 profiler per day during each deployment (when conditions are sufficiently calm).
What types of sensors and instruments are on the profiler, and what specific data do they collect?
CSPPs average 25 cm/s as they profile upwards. Their CTDs sample at 16 Hz, which corresponds to a measurement every 1.5 cm. Their ~1 Hz instruments include dissolved oxygen (DOSTA), point velocity (VELPT), nitrate (NUTNR), spectral irradiance (SPKIR), photosynthetically active radiation (PARAD), and chlorophyll-a—optical backscatter—CDOM (FLORT). The CSPP is a particularly useful platform for the optical attenuation and absorption instrument (OPTAA), which can be used to characterize phytoplankton communities at the top of the water column.
What are the unique capabilities of the CSPP, and how do its datasets differ from those collected by other platforms within the OOI?
The CSPP is OOI’s only profiler that samples up to the air-sea interface.
How has the profiler contributed to understanding the relationship between atmospheric and oceanic processes in the area?
So far, OOI’s CSPPs have been used to fill in time gaps in mooring data and to fill in spatial gaps between mooring near-surface (NSIF) and benthic (MFN) data. Inshore and shelf CSPP data have been used together to calculate cross-shore exchange of nitrate, which is increased each spring due to coastal upwelling. CSPPs measure at the air-sea surface, so their measurements could be used to validate satellite data.
How could the near-time data transmission from the profiler benefit research efforts or inform stakeholders such as fisheries, conservation groups, or local communities?
Datasets are available within a week after each deployment. They can telemeter all data when they are on the surface at the top of each profile, however, we transfer only data needed for operational decisions to reduce the chance of winchline fouling.
Can you share an anecdote about a particularly challenging or rewarding moment during the deployment, maintenance, or operation of the profiler?
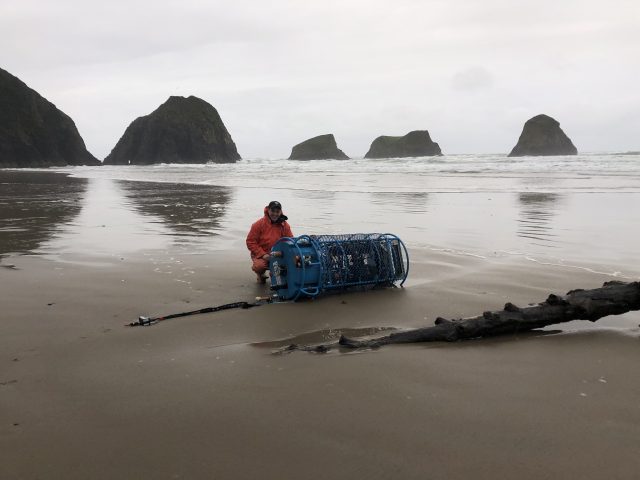
One challenging moment occurred 06 April 2019. During a storm, rough seas (~7m significant wave height, >1 m/s currents) dislodged our 25m depth Oregon Inshore CSPP and deposited it 75 nm north on a pocket beach in Ecola State Park. We climbed down to it, pulled it above the high tide line, disassembled it, and packed it out piece-by-piece up a steep trail in pouring rain. The Endurance Array inshore CSPP and adjacent surface mooring measure the northward fresh/turbid surface current that hugs the Pacific Northwest coast during winter, and which strengthens during storms. This is one example of how the CSPP data can be used to improve our wind, wave and current forecast models.
[caption id="attachment_35671" align="alignnone" width="640"]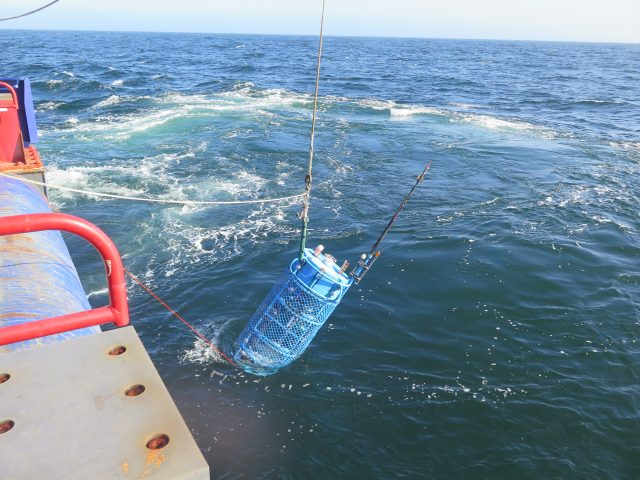 Deployment of CSPP. (c) Jon Fram[/caption]
[caption id="attachment_35670" align="alignnone" width="640"] Beach recovery effort. Pictured: Ian Black, OSU. (c): Jon Fram[/caption]
Read More
Deployment of CSPP. (c) Jon Fram[/caption]
[caption id="attachment_35670" align="alignnone" width="640"] Beach recovery effort. Pictured: Ian Black, OSU. (c): Jon Fram[/caption]
Read More Processing an Ocean of Data: OOI Insights from the NSF CI Compass Workshop

At the NSF CI Compass virtual workshop, “Data Management: From Instrument to First Storage,” Jeff Glatstein, OOI Senior Manager of Cyberinfrastructure at WHOI, shared key insights into the challenges and advancements in handling large-scale ocean data.
OOI manages enormous data volumes: 175 billion rows of numerical data, 2.8 petabytes of raw data, 13,000 hours of video, and over 2 million digital stills. In the last quarter alone, 36 terabytes of data were delivered to researchers, highlighting the complexity of managing continuous, multi-source data streams.
Jeff introduced the Jupiter Hub environment, which allows researchers to download and process data directly while supporting FAIR metadata standards. He also addressed challenges like storage costs, technical debt, and the need for scalable infrastructure as data demands grow.
Recent upgrades, including Cassandra improvements and enhanced monitoring systems, have improved efficiency. Future efforts focus on GPU use for AI applications, building a third-generation data center, and ensuring cybersecurity and disaster recovery with geographically distributed storage.
Jeff emphasized the importance of collaboration between observatories and the standardization of data formats to improve integration and sharing. His presentation highlighted the ongoing work required to make ocean data accessible, secure, and valuable for research.
The workshop highlighted the critical role facilities like OOI play in advancing ocean science, offering the tools and infrastructure necessary to manage complex data and foster collaboration across the research community.
To learn more about OOI’s data management strategies, check out Jeff Glatstein’s full slide deck from the NSF Workshop. View it here.
[caption id="attachment_35610" align="alignnone" width="640"] (c): Jeffrey Glatstein[/caption]
[caption id="attachment_35607" align="alignnone" width="640"] (c): Jeffrey Glatstein[/caption]
Read More
(c): Jeffrey Glatstein[/caption]
Read More Cyber Resiliency in Ocean Data Systems
With 2.8 petabytes of data collected—and 20-25 terabytes added monthly—the Ocean Observatories Initiative (OOI) is committed to ensuring secure, accessible, and reliable oceanic research data for decades to come. At the Cyber Resiliency Summit 2025, Craig Risien, CI Systems Project Manager at the OOI at Oregon State University, shared insights with theCUBE on how the OOI is addressing long-term data challenges through innovative strategies and collaborative partnerships.
Watch the interview: www.youtube.com/watch?v=5c-a0dTSF-Y&t=748s
Regional Cabled Array: Monitoring Axial Seamount in Real Time
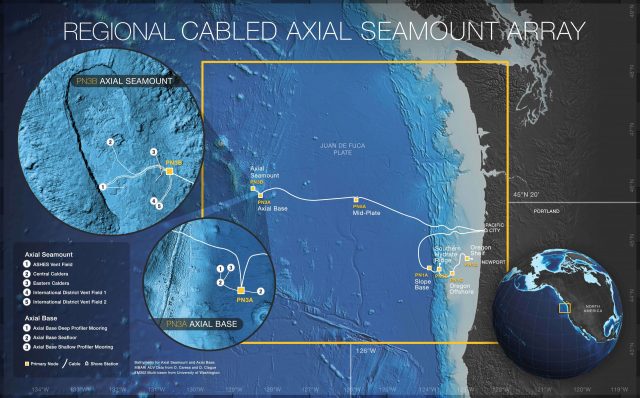
The Regional Cabled Array (RCA) is the world’s most extensive undersea volcano monitoring system, located off the Oregon coast. Operated by the University of Washington as part of the Ocean Observatories Initiative (OOI), the RCA features a network of submarine cables extending 200 miles offshore from Pacific City and Newport. This system monitors the Axial Seamount, a submarine volcano expected to erupt this year.
In a recent interview, Deb Kelley, OOI Principal Investigator and Director at the University of Washington School of Oceanography, discussed how the RCA collects near-time data to track seismic activity, hydrothermal systems, and chemical changes associated with volcanic activity. The RCA’s data supports long-term research on ocean dynamics and tectonic processes, providing critical insights into the Earth’s underwater systems.
Watch the full interview with KPTV FOX 12 here: https://www.youtube.com/watch?v=PUJMTdka8KI
[caption id="attachment_35589" align="alignnone" width="640"] Credit: Center for Environmental Visualization, University of Washington[/caption]
Read More Life at Sea: Student Reflections from the VISIONS’24 (Leg 3) Expedition
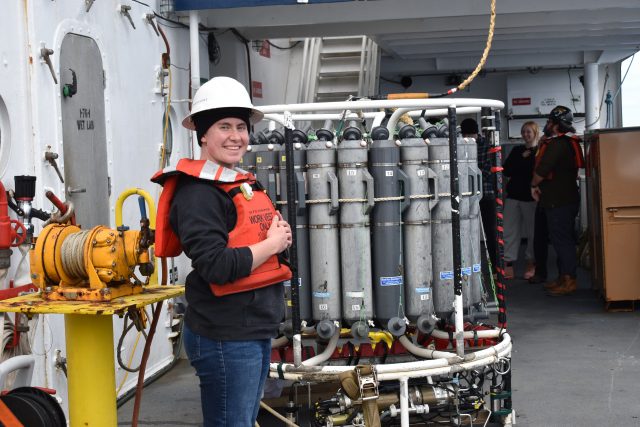
As part of the Regional Cabled Array operations and maintenance 2024 cruise, a cohort of 24 undergraduates spanning different countries of origin, states, and socio-economic backgrounds, participated in the expedition as part of the UW at-sea experiential learning program called VISIONS. This program has allowed over 200 undergraduate students, studying myriad disciplines, the opportunity to spend 8-45 days at sea on NSF-funded global class research ships utilizing state-of-the art remotely operated vehicles (ROV). Onboard, they stand 4-hr on, 8-hr off watches in the ROV control room working alongside the pilots, and RCA engineers and scientists. They work out on deck, learn about ship operations, and gain skills in oceanographic sampling and analyses of fluids. They see first-hand life forms rarely seen thriving in some of the most biologically productive waters in the ocean along the Cascadia Margin, the abyss at 2900 m water depth, and on 350°C underwater hot springs at the summit of Axial Seamount – the most active underwater volcano off the Oregon coast. The interviews below provide a glimpse of VISIONS’24 student impressions of life at sea and their experiences onboard. For many, their lives are forever changed.
Among the 2024 cohort was Morrigan Havely, whose curiosity and eagerness to explore marine science drove them to join the VISIONS program. Their journey aboard the R/V Atlantis highlights the combination of technical skill-building and personal development that the program supports. Morrigan’s experience reflects the unique community and collaborative spirit found at sea, where learning extends beyond science to include teamwork, resilience, and adaptability.
What motivated you to join the VISIONS program?
An oceanography undergraduate praised his experience with the program the year prior and highly recommended I join. One of my biggest goals with becoming a marine science major was to travel, and after reading about the amazing experiences of past students via their blogs, I knew that I wanted to sail aboard the R/V Atlantis.
What skills did you develop or strengthen during your time at sea that you feel will be valuable in your future career?
Time at sea in general is a super valuable experience, because it’s an entirely different culture than on land. You learn to work with people in extremely close quarters at all hours of the day, even if that means getting up at two in the morning to log Jason events. Learning about ship culture and having an on-board experience was an integral part of VISIONS ‘24.
How do you see the skills and experiences gained from the seagoing and Ocean 411 class, contributing to your role in the future workforce, particularly in science and engineering fields?
Research is a huge part of the marine science field, and Deb made sure to emphasize the importance of integrating our findings with education. VISIONS takes a risk by sending inexperienced undergraduates out on a global class research ship conducting industrial-style operations to learn necessary skills, and I think it’s important to recognize and pay that opportunity forward through sharing what we find aboard with the community.
What advice would you give to other students considering applying for experiential learning programs like VISIONS?
Show your enthusiasm for the program! Enthusiasm is a product of a willingness to learn and a desire to be present, and those are the two most important qualities I’ve seen past VISIONS students exhibit. Even if you don’t have experience on boats or doing research, show in your application that you’re willing to stay up for odd hours to watch hydrothermal vent fields in real time and learn lab skills off-shift. Enthusiasm will make up for lack of experience.
What was the most surprising thing you experienced during your time at sea?
How kind and willing everyone was to teach me. Even outside of the science team, we had crew members showing us how to tie knots and work with the equipment on deck. We cracked jokes with the Jason team members in the control van and ate with the mates in the galley. The community created on a ship extends outside of scientists, and I’m so glad I got to be a part of that camaraderie.
[caption id="attachment_35516" align="alignnone" width="640"]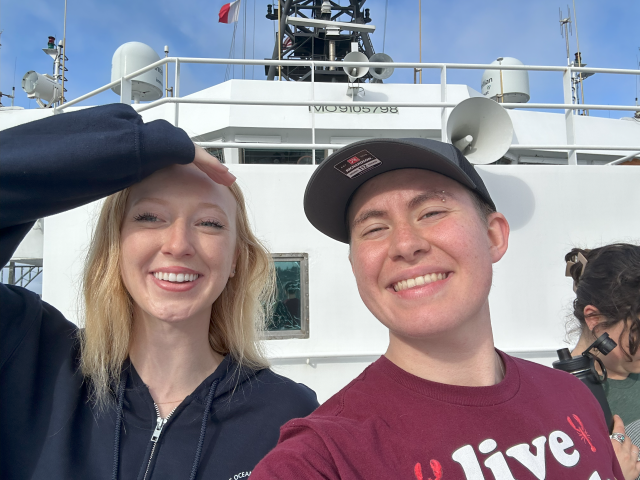 Morrigan (R) and team member onboard R/V Atlantis (Leg 2)[/caption]
[caption id="attachment_35517" align="alignnone" width="640"]
Morrigan (R) and team member onboard R/V Atlantis (Leg 2)[/caption]
[caption id="attachment_35517" align="alignnone" width="640"]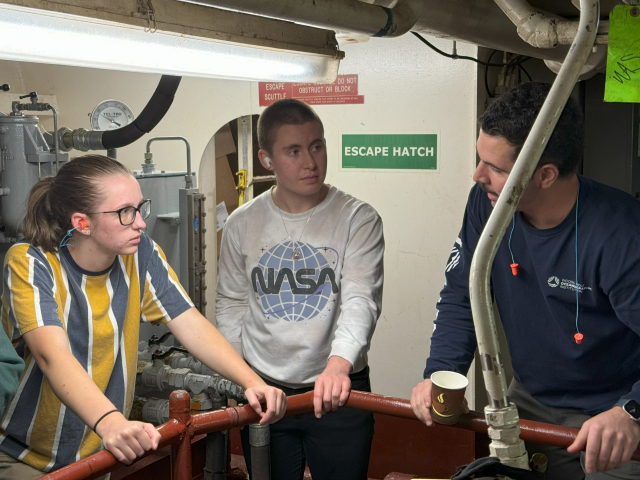 Teammates interact during VISIONS 24 cruise.[/caption]
Read More
Teammates interact during VISIONS 24 cruise.[/caption]
Read More Life at Sea: Student Reflections from the VISIONS’24 (Leg 2) Expedition
As part of the Regional Cabled Array operations and maintenance 2024 cruise, a cohort of 24 undergraduates spanning different countries of origin, states, and socio-economic backgrounds, participated in the expedition as part of the UW at-sea experiential learning program called VISIONS. This program has allowed over 200 undergraduate students, studying myriad disciplines, the opportunity to spend 8-45 days at sea on NSF-funded global class research ships utilizing state-of-the art remotely operated vehicles (ROV). Onboard, they stand 4-hr on, 8-hr off watches in the ROV control room working alongside the pilots, and RCA engineers and scientists. They work out on deck, learn about ship operations, and gain skills in oceanographic sampling and analyses of fluids. They see first-hand life forms rarely seen thriving in some of the most biologically productive waters in the ocean along the Cascadia Margin, the abyss at 2900 m water depth, and on 350°C underwater hot springs at the summit of Axial Seamount – the most active underwater volcano off the Oregon coast. The interviews below provide a glimpse of VISIONS’24 student impressions of life at sea and their experiences onboard. For many, their lives are forever changed.
The cohort included students like Leo Couchon, whose passion for ocean sciences and hands-on learning brought a unique perspective to the expedition. Leo embraced the challenges and opportunities of life at sea, immersing themselves in the demanding yet rewarding work environment. Their reflections offer a window into how the VISIONS program not only provides technical skills but also fosters personal growth and a deeper connection to the oceanographic community.
What motivated you to join the VISIONS program?
I really look up to Deb as a pioneer in Ocean Sciences and was really excited about the opportunity of learning about all different types of life on a research vessel. I wanted more than anything in the world to get my sea legs. It’s difficult to get your first experience at sea/days at sea, but it’s vital for oceanographic and marine technician work.
What skills did you develop or strengthen during your time at sea that you feel will be valuable in your future career?
Over the course of the VISIONS program, I had numerous opportunities to learn new skills and techniques. I learned how to perform meticulous, detail-oriented data logging in the ROV control van, how to deploy a CTD with Niskin bottles, and sediment push core sampling techniques. In some cases, the actual skills I was learning were second to who I was learning it from. I got the chance to learn about microbial mats and sediment cores directly from Dr. Laura Lapham, and I had the opportunity to learn Oceanographic field techniques from the people who developed the equipment we were using! I also feel like I learned things that helped me develop my communication skills in this kind of unique work environment. Between the strenuous work schedule and the round-the-clock nature of the crew and science team’s activities, I began to realize how interdependent and involved different departments need to be. Being able to effectively communicate within this was so important to my takeaway from this experience – everyone has something important to offer in terms of insight, even other students, and being able to navigate that interdependence and make a point to talk to everybody on the boat did a lot to enrich my experience.
How do you see the skills and experiences gained from the seagoing and Ocean 411 class, contributing to your role in the future workforce, particularly in science and engineering fields?
It was inspiring to be surrounded by professionals in the field I want to spend my life in; having that sense of responsibility and dedication is intoxicating. It’s something that I’ll bring with me to every future position I hold. I want to do meaningful science that involves the communities that I work within, and I want to learn enough that I can teach people. I loved being connected to everyone on the boat, getting to hear people’s stories and personal connections are important for science communication. There are still so many people out there that don’t even know what oceanography is as a field let alone how all of the pieces of the puzzle fit together. I am so genuinely excited to share my experience with anyone that will listen. I think that the skills I learned during VISIONS will be incredibly important to my future career in research, but moreover I believe that this experience increased my capacity to be effective in science communication.
What advice would you give to other students considering applying for experiential learning programs like VISIONS?
You can only get as much from the program as you put in, so apply yourself to everything that comes your way because you’ll never know what you can get from it. It’s difficult to put yourself out there but it’s worth it. Saying yes to everything that comes your way and always being willing to help everyone during the program is vital in learning a variety of skills. That said I also recommend advocating for your needs and ensuring you not to overload yourself. Carving out time for yourself to rest, reflect, and enjoy the experience for what it is can be equally important.
What was the most surprising thing you experienced during your time at sea?
There are so many people on the boat in one space and everyone is working 24/7, there’s always someone in the middle of their sleep while someone is in the middle of their shift and there is always something to learn – but it’s also routine. You just melt into the way that the boat operates. It’s the little moments that would catch me off guard. There was a night at around 2am where I left the darkness of the control van lit only by the ROV’s camera at around 2000 meters deep to be met with the expanse of the sky reflecting the end of the Perseids meteor shower. Or a day when I fully bawled on deck after everyone rushed out to see a dolphin pod following and I caught a glimpse of my favorite fish that I never thought I would get to see in person, the Mola mola. There is a sense of magic that’s difficult to put into words. You can’t ever quite carve out a moment of silence or time alone but you’re experiencing everything aboard with everyone. It’s both connecting and isolating all at once, the things that make it difficult are the very same things that make it beautiful.
[caption id="attachment_35504" align="alignnone" width="640"]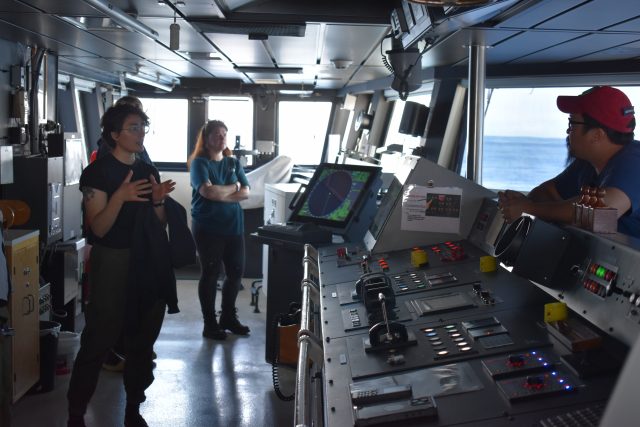 Bridge tour. (c) Kellen Rosburg[/caption]
[caption id="attachment_35503" align="alignnone" width="640"]
Bridge tour. (c) Kellen Rosburg[/caption]
[caption id="attachment_35503" align="alignnone" width="640"]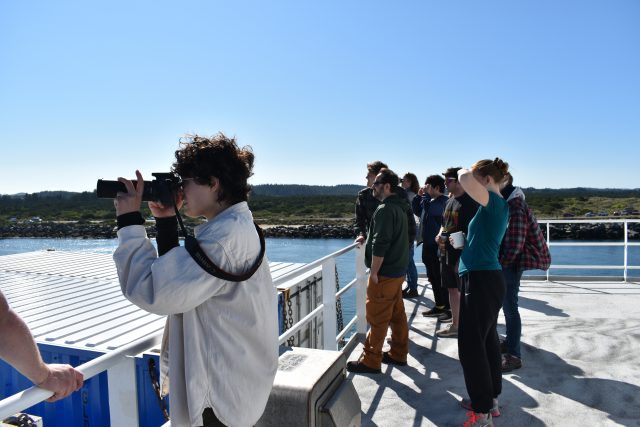 End of Leg 2. (c) Mitch Elend[/caption]
[caption id="attachment_35506" align="alignnone" width="640"]
End of Leg 2. (c) Mitch Elend[/caption]
[caption id="attachment_35506" align="alignnone" width="640"]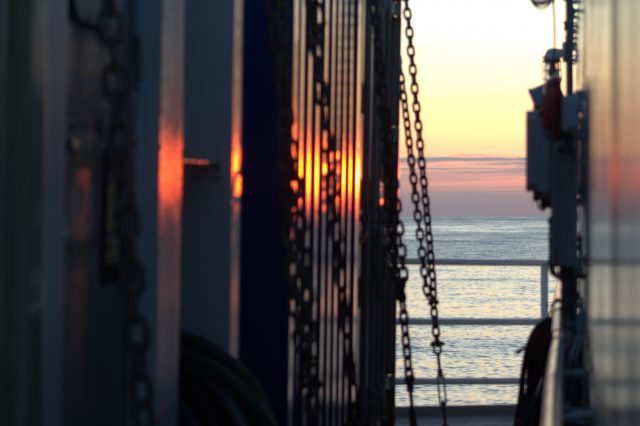 Sunrise on deck. (c) Leo Couchon[/caption]
Read More
Sunrise on deck. (c) Leo Couchon[/caption]
Read More Advancing Ocean Carbon Science: Highlights from OOI’s SUGR Meeting on Data Quality and Best Practices
On Sunday, December 8th, the Ocean Observatories Initiative (OOI) hosted its first Scientific User Group for Research (SUGR) meeting in Washington, D.C., prior to the AGU Fall Meeting. Held at The Westin DC Downtown, the event brought together researchers, scientists, and members of the user community to discuss the critical role of OOI data in advancing our understanding of the Carbon Cycle.
Exploring Ten Years of Insights and Innovation
The SUGR meeting provided a platform to review a decade of advancements in ocean carbon science supported by OOI data. Key presentations included:
- Ten Years of pCO₂ and pH Measurements on the NSF OOI Regional Cabled and Endurance Arrays: Techniques, Validation, and Science Opportunities presented by Ed Dever, Wendi Ruef, and Chris Wingard (OOI/OSU), highlighted the data generated by the Regional Cabled Array and Endurance Array. This dataset, including ten years of hourly pH and pCO₂ measurements, revealed significant variability and highlighted the potential for long-term monitoring to advance our understanding of ocean carbon processes.
- Using OOI Data to Investigate Carbon Cycling in the Irminger Sea, presented by Meg Yoder (Boston College), explored the unique challenges and opportunities associated with studying carbon cycling in the North Atlantic, leveraging OOI data for cutting edge research in this remote and dynamic region.
- OOI Biogeochemical Working Group & Data User Guide and 7 Reasons Why You Need It! presented by Merrie Beth Neely (Global Science & Technology), emphasized the value of the Biogeochemical Data User Guide and how it supports researchers in navigating and utilizing OOI’s vast datasets effectively.
- The Pioneer MAB Array: Location and Sensors, presented by Al Plueddemann (OOI/WHOI), provided an overview of the Pioneer Array’s configuration and sensor capabilities, highlighting its role in enhancing our understanding of shelf dynamics and biogeochemical processes.
- RCA Instrument Refresh, presented by Mike Vardaro (OOI/UW), focused on recent upgrades to the Regional Cabled Array’s instrumentation, ensuring its continued functionality for supporting new oceanographic research.
- NOAA Ocean Acidification and OOI Data, presented by Liza Wright-Fairbanks (NOAA OAP), highlighted the integration of OOI data with NOAA’s efforts to monitor and address ocean acidification.
The meeting fostered a collaborative atmosphere, with attendees sharing insights and identifying opportunities to enhance the value of OOI data. The discussions extended to updating the GOOS-Endorsed Best Practices document and exploring ways to integrate OOI datasets more seamlessly with other oceanographic networks.
Session Highlights and Key Takeaways
- Innovative Tools and Techniques: The discussions touched on the importance of deploying advanced tools to maximize the impact of OOI data. High-resolution pH and DIC sensors, microbial fuel cells for renewable energy and CO₂ fixation, and imaging flow cytometers were highlighted as transformative technologies for biogeochemical research.
- Data Quality and Calibration: Speakers emphasized the critical need for rigorous data validation and quality control processes. Challenges such as fouling and sensor drift were addressed, with proposed solutions including the development of improved calibration standards and updated best practices manuals.
- Expanding Community Engagement: Participants stressed the importance of user-driven collaboration in refining tools like the Biogeochemical Sensor Data Best Practices & User Guide. Suggestions included organizing science-themed webinars, leveraging existing resources, and enhancing tutorial accessibility to better support the community.
Future Plans
As OOI continues to evolve, SUGR meetings will remain central to addressing challenges, exploring innovations, and driving impactful research.
We welcome your suggestions for future SUGR meeting topics and areas of focus. Your input is critical in shaping OOI’s future efforts. Lastly, the OOI looks forward to working with you, our biogeochemical data champions, to continue to improve best practices for BGC research.
For more information and access to post-event resources, visit the SUGR Ocean Carbon Science webpage.
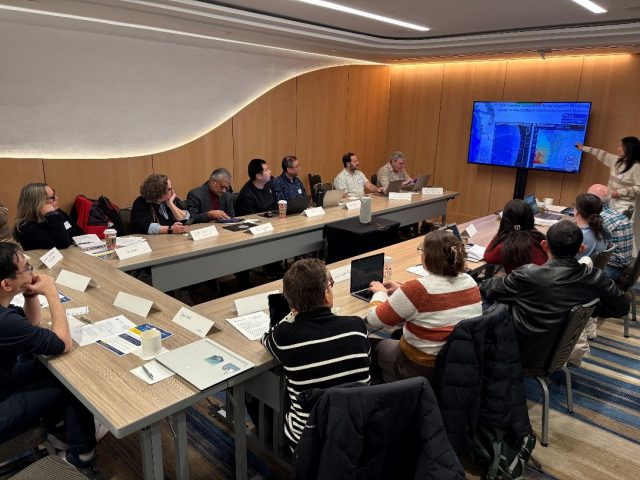
[caption id="attachment_35489" align="alignnone" width="640"] OOI SUGR Meeting, Dec 8th, Washington, DC[/caption]
[caption id="attachment_35491" align="alignnone" width="640"]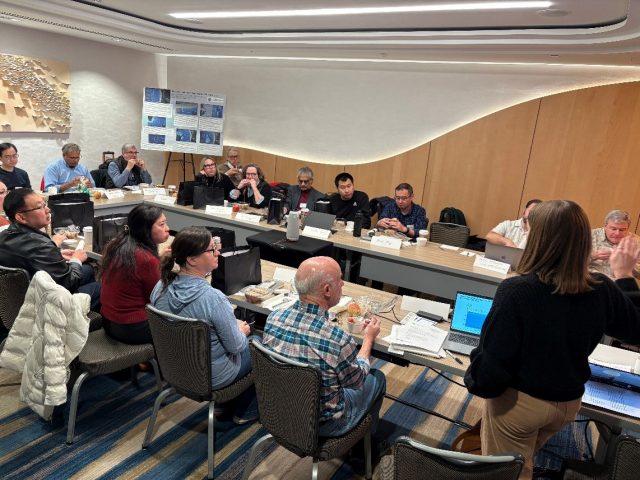 Meg Yoder, Boston College[/caption]
Read More
Meg Yoder, Boston College[/caption]
Read More Ocean Observatories Initiative at the 2024 AGU Conference
The Ocean Observatories Initiative (OOI) participated in the 2024 American Geophysical Union (AGU) Fall Meeting in Washington, D.C. This premier event served as a global platform for thousands of scientists and researchers to share breakthroughs and foster collaborations in Earth and space sciences. OOI took part in presentations, interactive discussions, and participation in the Ocean Observatories Initiative Facilities Board (OOIFB) Town Hall.
OOIFB Town Hall
A key event at AGU was the OOIFB Town Hall held on December 10th. This in-person session provided an opportunity for the community to engage directly with OOI representatives, NSF and NOAA program leaders, and the OOIFB. The event featured:
- Updates from OOI’s Principal Investigator (PI), Jim Edson who shared the latest developments from the Program Management Office (PMO) and the Marine Implementing Organizations (MIOs).
- Interactive Panel Discussion: A panel of experts, including representatives from OOI’s Endurance Array, Mid-Atlantic Bight Array (MAB), Regional Cabled Array (RCA), and PMO discussed opportunities and challenges for observatory-based research.
Participants heard from PI’s about the proposal process and discussed opportunities for adding new instruments to the infrastructure. The session emphasized the importance of community input and encouraged feedback to inform OOI’s future directions.
The panel members included:
- Jim Edson (OOI/WHOI)
- Al Plueddemann (OOI/WHOI)
- Ed Dever (OOI/OSU)
- Mike Vardaro (OOI/UW)
- George Voulgaris (NSF)
- Kaity Goldsmith (NOAA)
Researchers, educators, and scientists using or considering OOI data were encouraged to share their insights, helping to shape future OOI research and initiatives. Examples involved the use of existing OOI data and the addition of new sensors by external PIs for specific research projects. Other opportunities to use OOI infrastructure was discussed including the use of available space on our Operations and Maintenance cruise. Making better use of individual observing systems by combining measurement capabilies (e.g., between NSF/OOI and NOAA) was discussed as an action item.
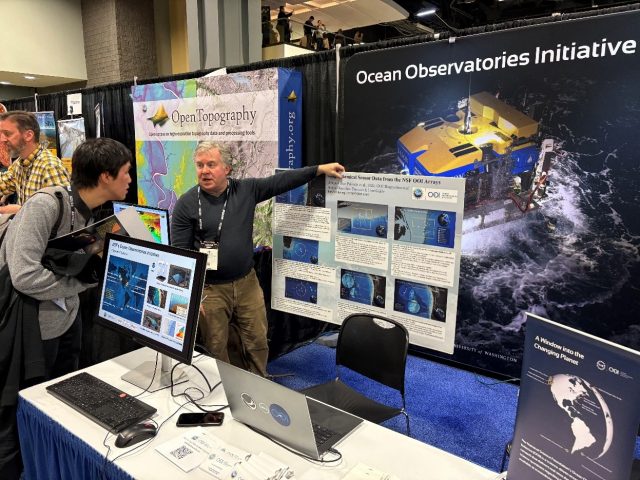
Engaging at the OOI Booth
The OOI exhibit booth was a hub of activity throughout the conference. Attendees explored live demonstrations of OOI’s data tools, learned about recent updates to infrastructure, and connected with OOI representatives to discuss potential collaborations. The booth provided an accessible entry point for researchers new to OOI data and offered experienced users an opportunity to delve deeper into its capabilities.
Looking Ahead
Through discussions, booth interactions, and participation in the OOIFB Town Hall, OOI demonstrated its commitment to innovation and collaboration. Looking forward, OOI remains dedicated to fostering an engaged community of researchers. The feedback and ideas gathered during AGU will help shape OOI’s next steps, ensuring its data and infrastructure continue to meet the needs of the scientific community.
For more information on OOI’s resources, presentations, and opportunities for collaboration, visit our website or follow us on social media.
[caption id="attachment_35482" align="alignnone" width="640"]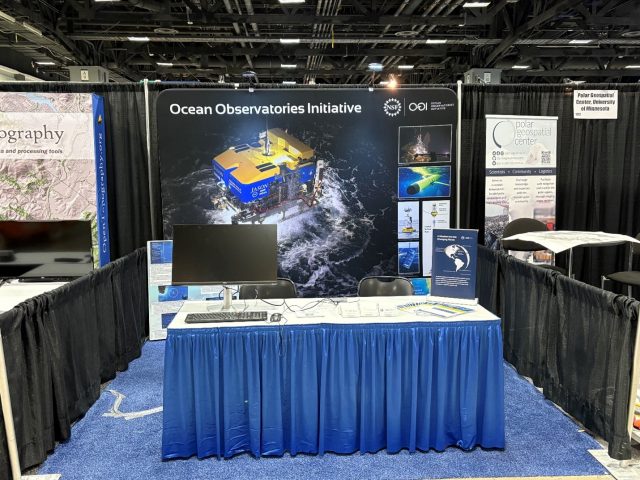 OOI at AGU[/caption]
[caption id="attachment_35483" align="alignnone" width="640"] Jim Edson, OOI’s Principal Investigator[/caption]
[caption id="attachment_35484" align="alignnone" width="640"]
OOI at AGU[/caption]
[caption id="attachment_35483" align="alignnone" width="640"] Jim Edson, OOI’s Principal Investigator[/caption]
[caption id="attachment_35484" align="alignnone" width="640"]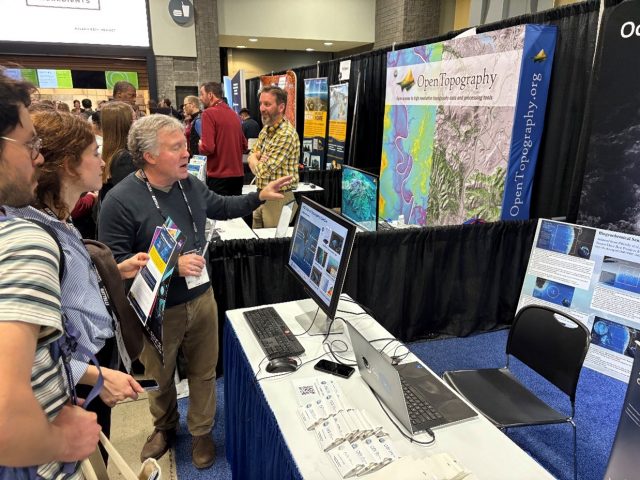 Jim Edson, OOI’s Principal Investigator[/caption]
Read More
Jim Edson, OOI’s Principal Investigator[/caption]
Read More Sea-Bird Scientific Issues Notice for Certain CDOM Fluorometers
Sea-Bird Scientific has issued a notice regarding certain CDOM fluorometers, which have been reported to produce biased measurements. The source of this bias has been identified as stemming from three distinct root causes:
- Incorrect primary CDOM standard
- In situ bias
- Out-of-tolerance UV LED