
Program Updates
Altered Carbon: Improvement to CO2 Measurements Enhance OOI Data Quality
Global carbon dioxide (CO2) concentrations are increasing in the atmosphere, largely due to the use of fossil fuels. The oceans are absorbing about 25-30 percent of the atmospheric CO2, resulting in a shift in seawater acid-base chemistry and a decrease in ocean pH, making seawater more acidic. To help scientists assess this changing ocean chemistry, the Ocean Observatories Initiative (OOI) uses the Sunburst SAMI-CO2 instrument to measure the partial pressure of carbon dioxide (pCO2) from 150-700 microatmospheres (μatm) in the upper 200 meters of the water column.
The distribution of pCO2 in seawater is dependent on gas exchange with the atmosphere at the ocean surface, the breakdown of plant material by microbial processes, and removal by photosynthesis, calcium carbonate formation, and rising temperatures. Increases in pCO2 can also be caused by dissolution of calcium carbonate, which is of particular importance because calcium carbonate minerals are the building blocks for the skeletons and shells of many marine organisms, such as oysters.
Using the SAMI-CO2 instrument, OOI researchers determine the partial pressure of CO2 by equilibrating a pH sensitive indicator solution (Bromothymol Blue) to sampled seawater. Aqueous carbon dioxide in seawater diffuses across a permeable silicone membrane equilibrator within the instrument, which changes the color of the indicator solution from blue to yellow. The equilibrated indicator solution is then pumped through a chamber where light passes through the liquid and into a receptor that uses the wavelength to determine the amount of color change, and thus the amount of CO2 dissolved in the water.
“The OOI system parses the raw data from the instrument, applies a ‘blank’ value to correct for instrument drift, and then delivers calibrated pCO2 data to users on demand,” explained Michael Vardaro, OOI Research Scientist at the University of Washington. “We recently created a fix to apply the correct ’blank’ values to the pCO2 data to improve data accessibility and data quality.”
Blank values (e.g., optical absorbance ratios in the pco2w_b_sami_data_record_cal data stream) are used to calculate the data product “pCO2 Seawater (µatm)” at a specific timestamp. Blank values, however, are recorded intermittently to correct for drift of the electro-optical system, about once a week, which is a longer interval than the instrument sampling rate of one sample per hour.
The recent correction will ensure that any pCO2 data request will use a linearly interpolated value from the closest blanks if no blank value is found within the requested time range. This means that for an hourly pCO2 measurement that falls between weekly blank values the system will calculate the appropriate drift correction to apply based on the surrounding blank values, instead of trying to find a specific blank value that might be outside the date range of the requested data. In addition to improving data quality, this fix prevents the system from returning fill values or empty datasets. Additional restrictions were put on data delivery to prevent interpolation across deployments, which could pull blanks from different instrument serial numbers, potentially creating bad data. These fixes apply to all OOI pCO2 data. Users who have pCO2 data products generated prior to 4 February 2020 are encouraged to re-request their data to ensure that the correct interpolation code is applied.
Any questions about this data fix, or any other OOI data issues, should be directed to help@oceanobservatories.org.
Images
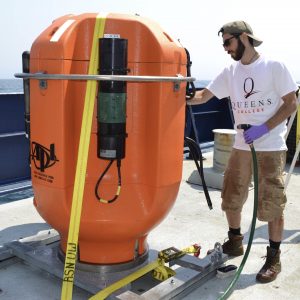
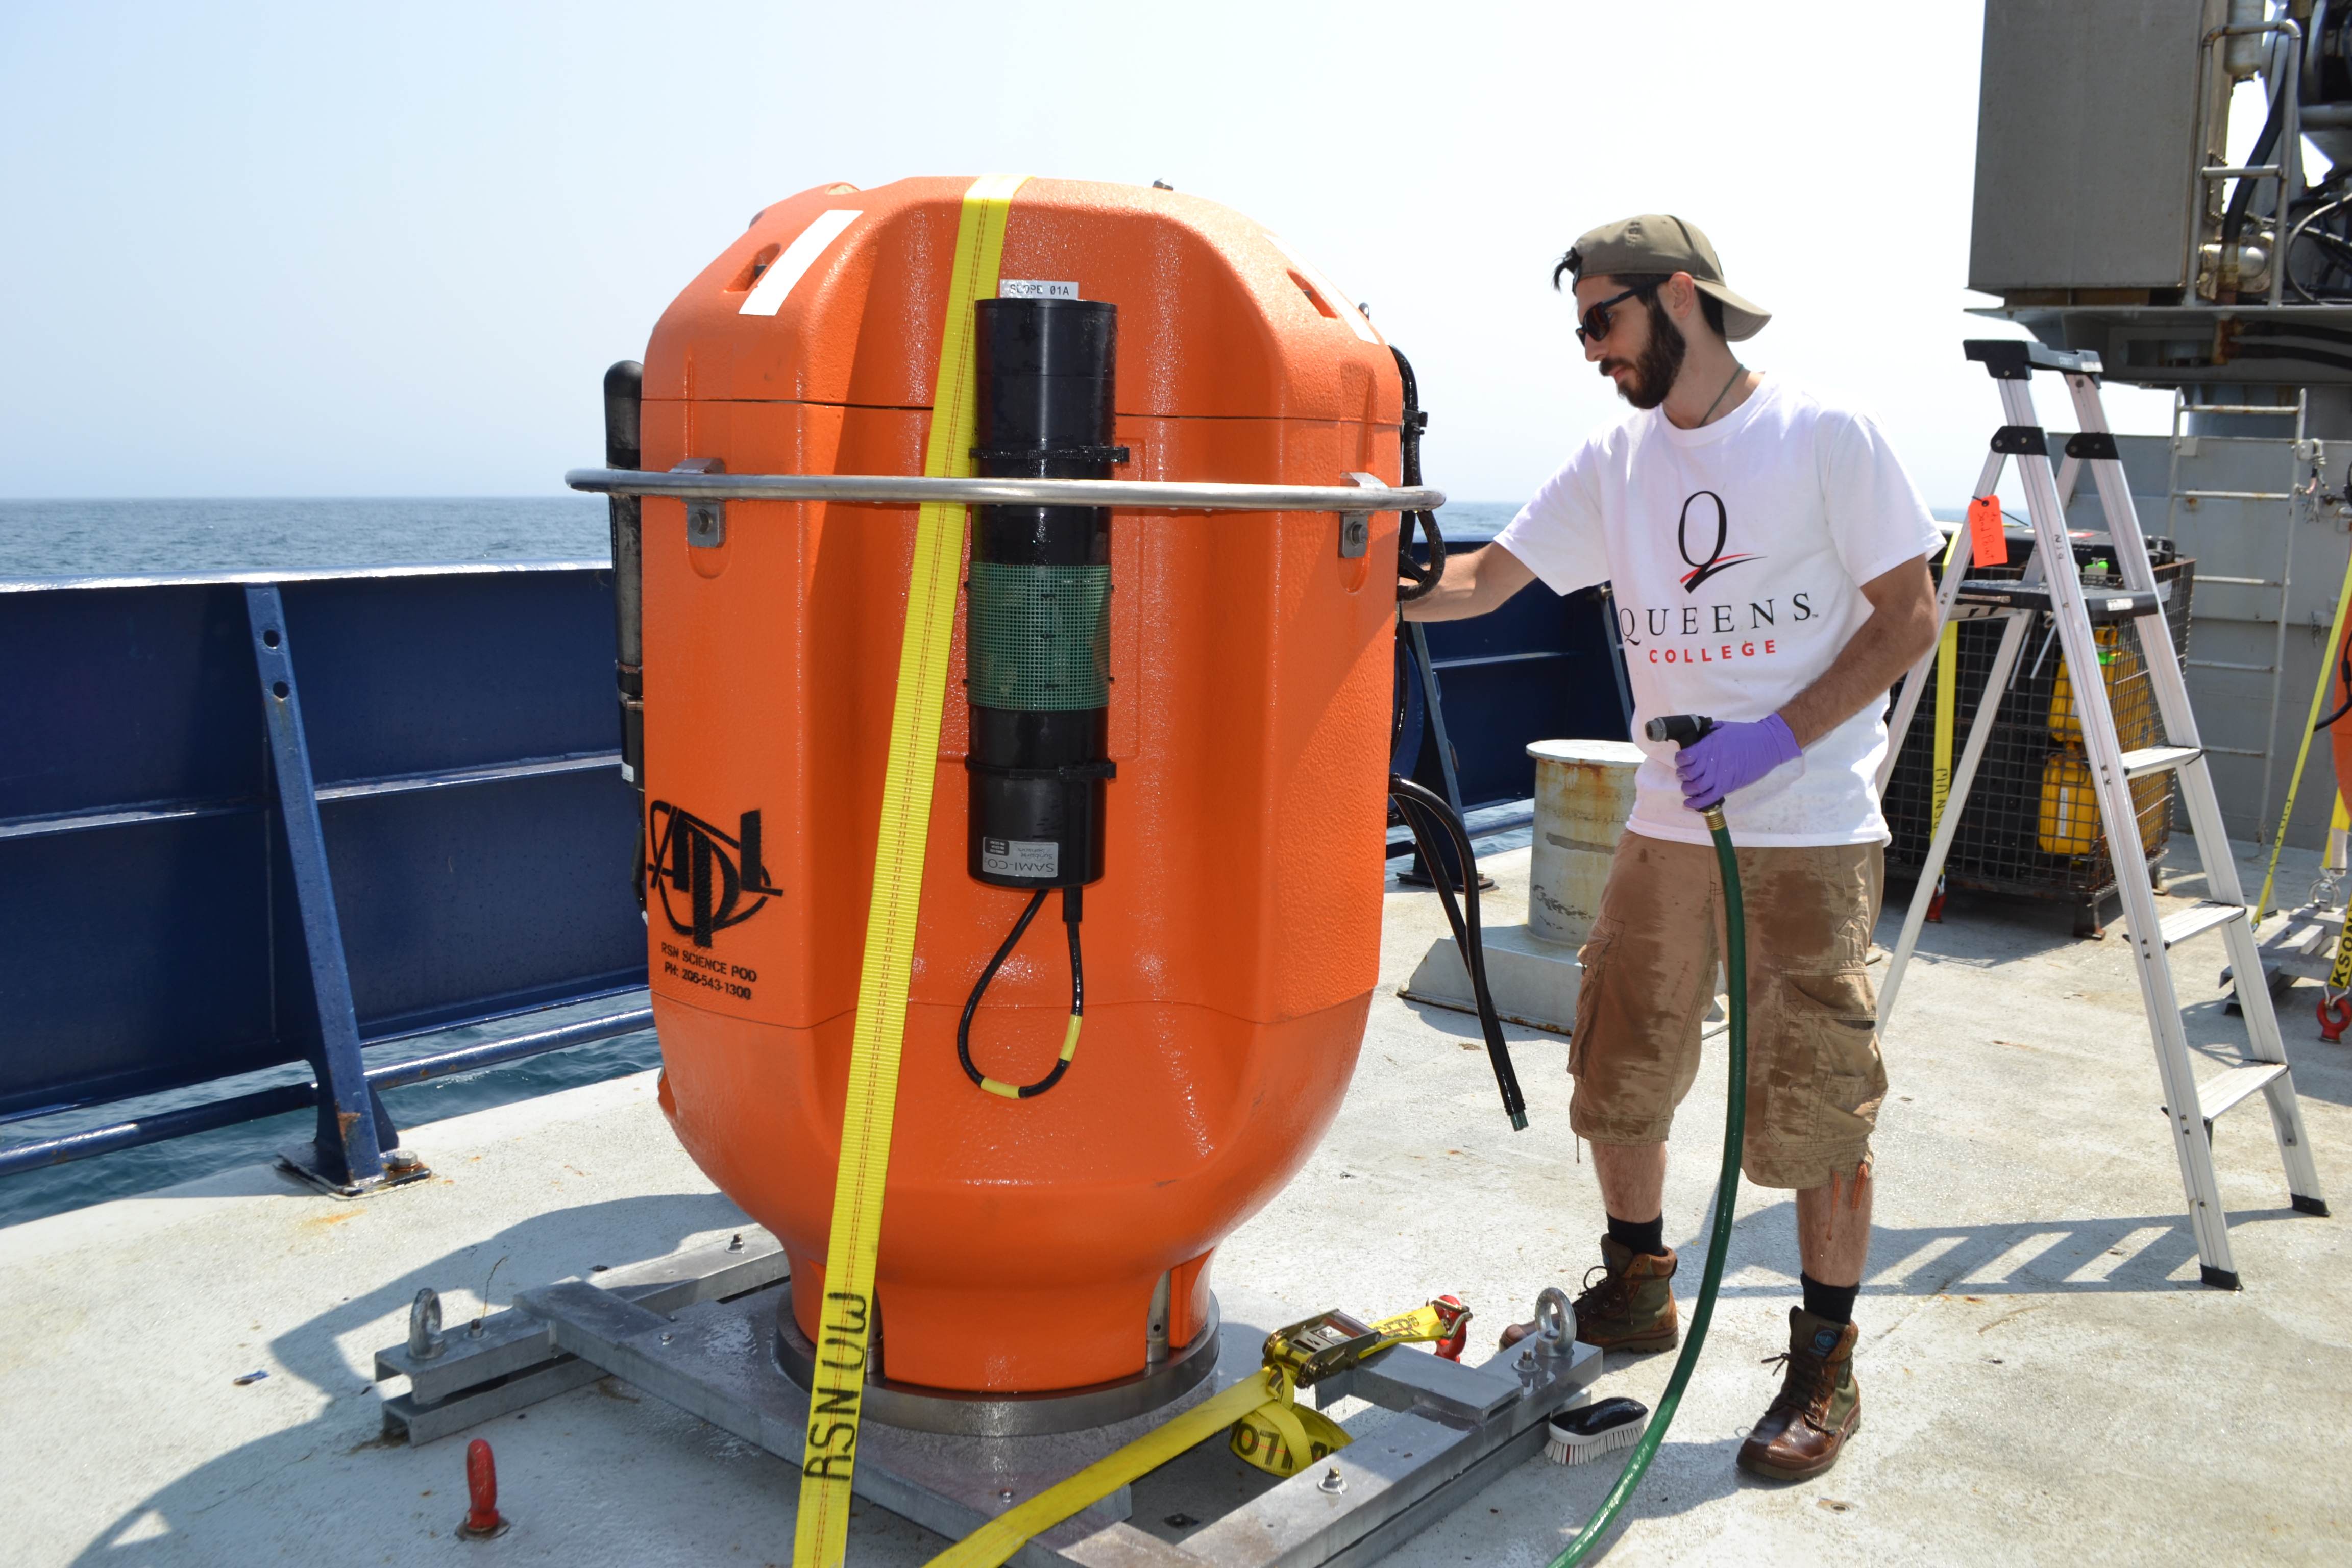
Top: Alex Andronikides, a VISIONS’17 student from Queens College, New York helps clean a Regional Cabled Observatory Shallow Profiler Mooring science pod that was installed off the Washington-Oregon coast. Credit: M. Elend, University of Washington, V17.
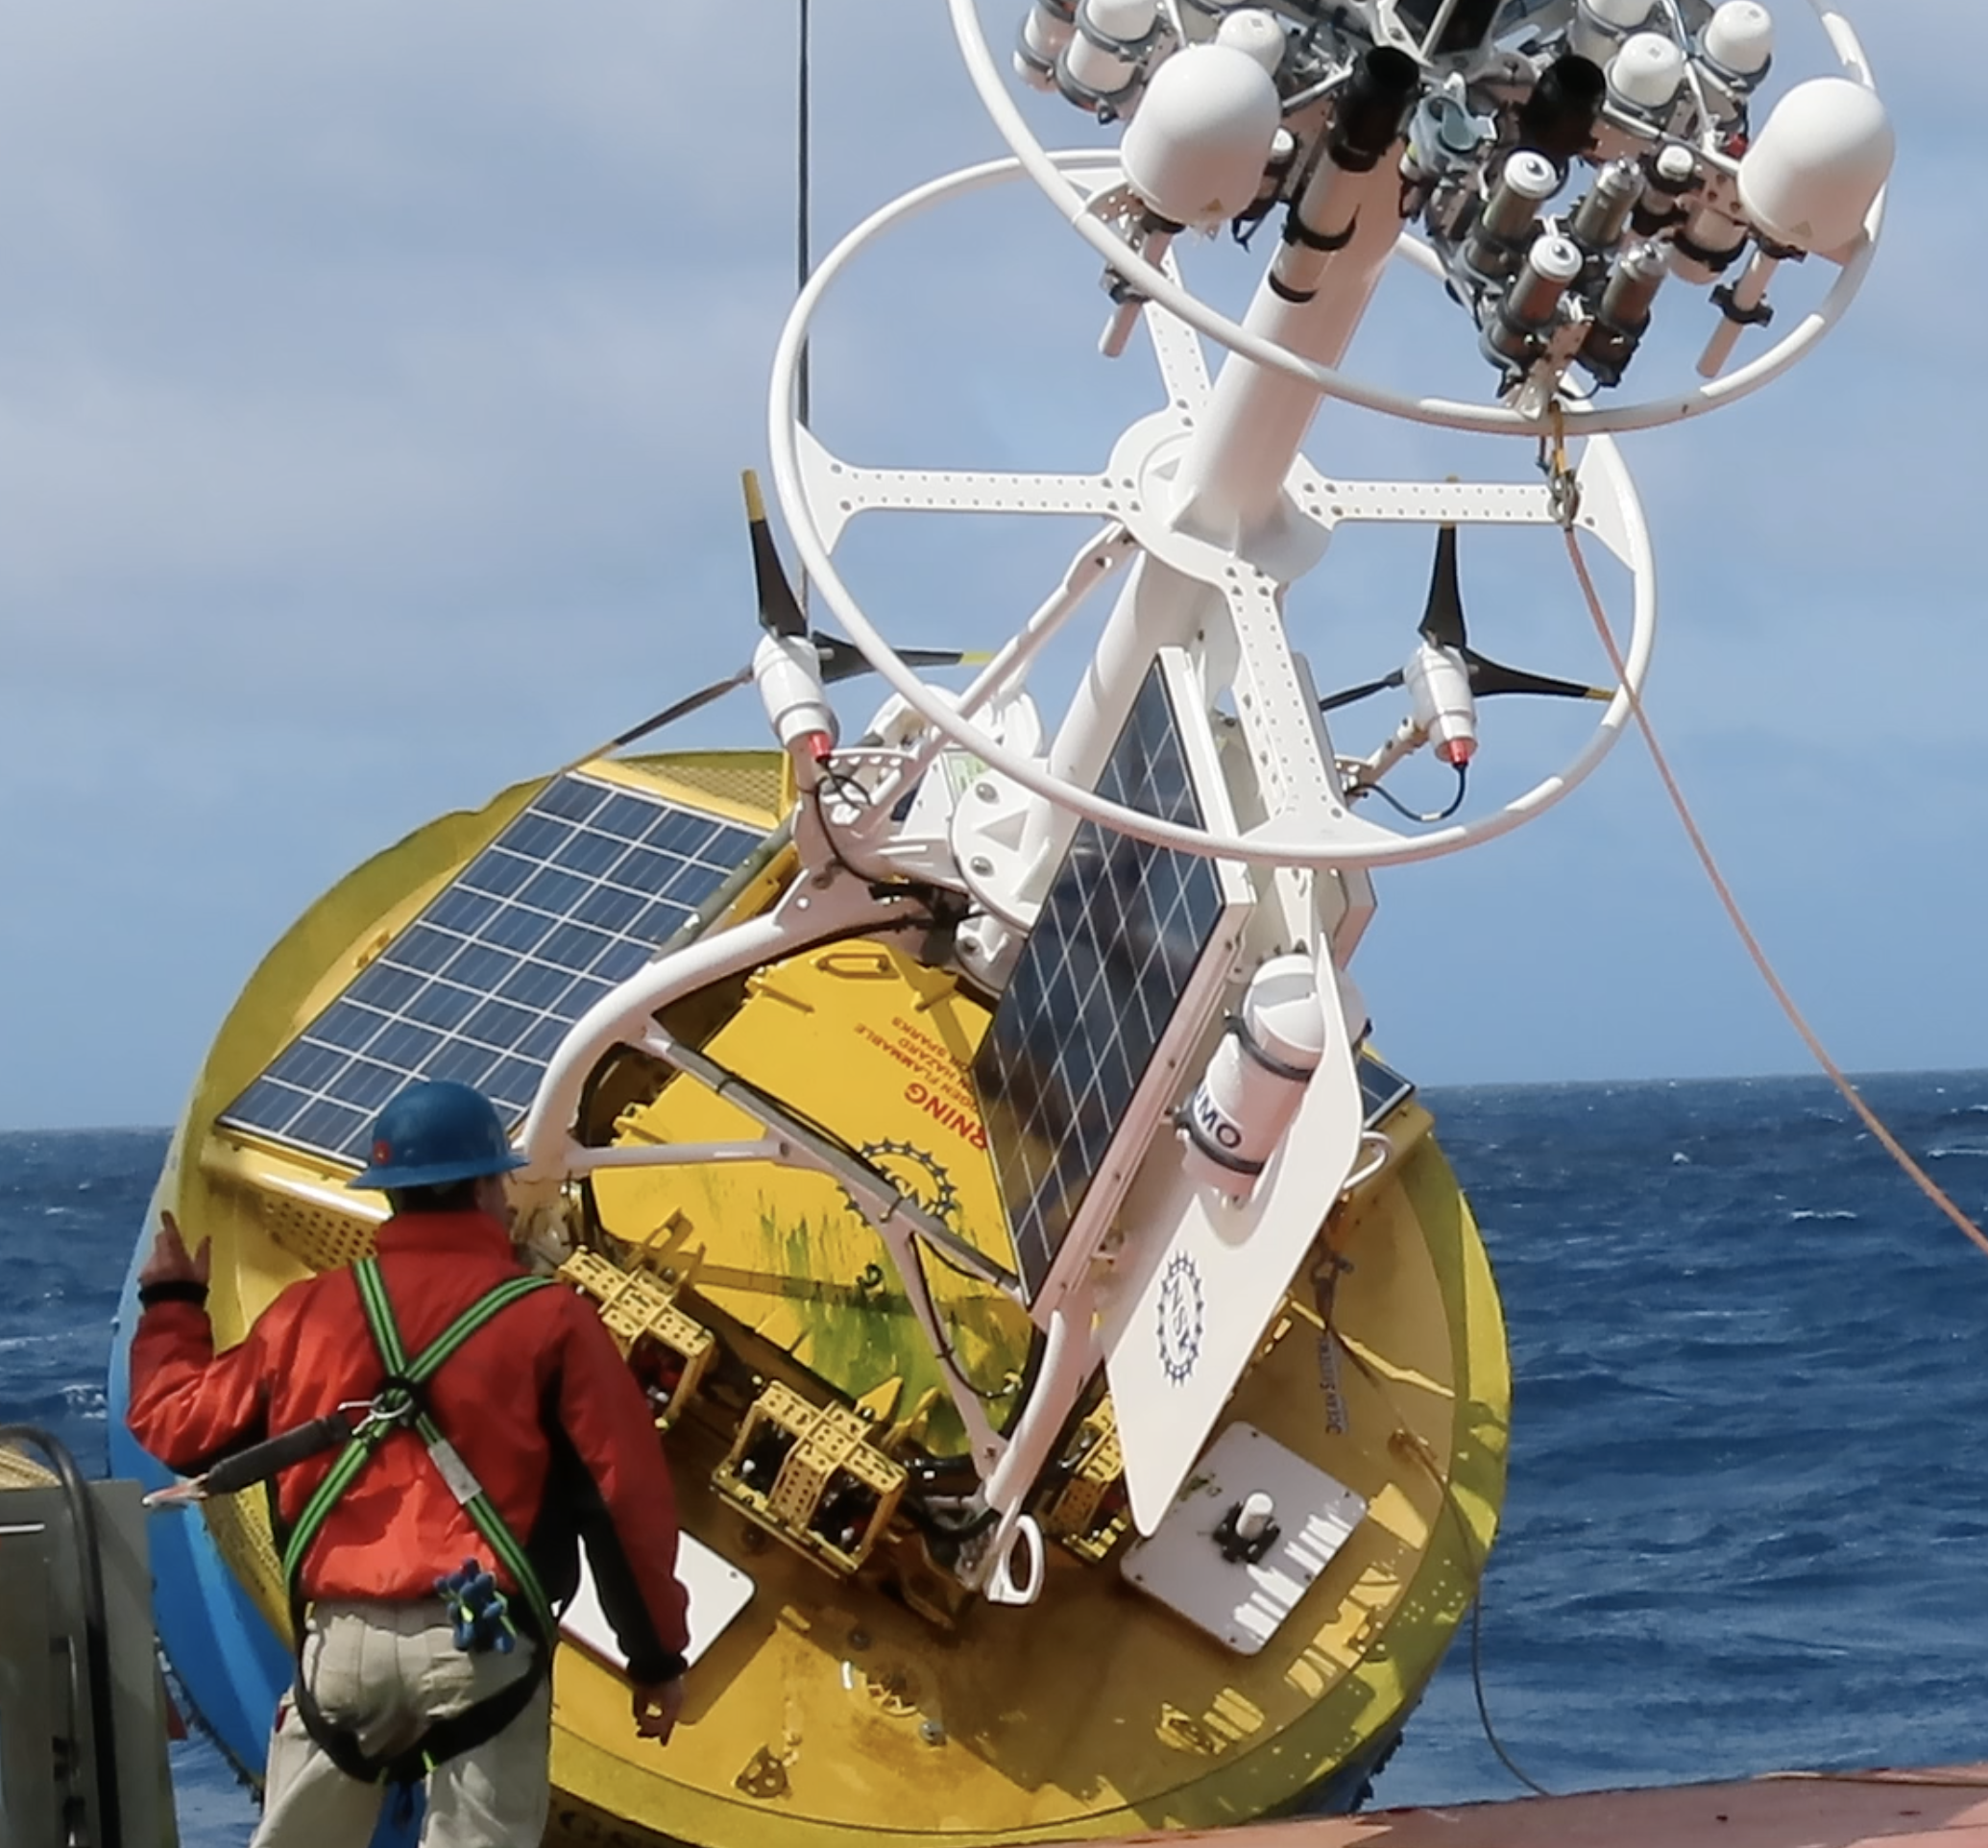
Bottom: Pre-deployment photo of a Sunburst SAMI-CO2 sensor attached to the Oregon Offshore Cabled Shallow Profiler pod, which moves up and down in the water column between 200 meters and near the surface off the coast of Newport, OR. Credit: M. Elend, University of Washington, V19.
Read MoreAssessment of OOI Endurance Array pCO2 Data Quality
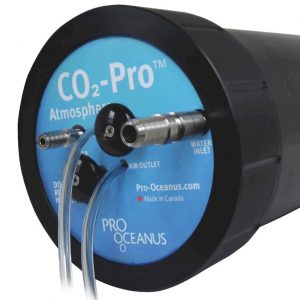
Given the significant importance of understanding and modeling levels of carbon dioxide in our atmosphere (and its potential sources and sinks), Ocean-Atmosphere Exchange and Global Biogeochemistry and Carbon Cycling are two of the OOI’s primary science themes. We address these themes in part through measurements of the air and surface water partial pressure of carbon dioxide (pCO2). Chris Wingard, the OOI Endurance Array Data Lead, recently completed an in-depth assessment of pCO2 data returned during the first four years of Endurance Array operations. These measurements were made using the Pro-Oceanus CO2-ProTM Atmosphere pCO2 sensor. By measuring the partial pressure of CO2 gas in both the air and surface water, researchers can estimate estimate surface flux of CO2 using data from this instrument. 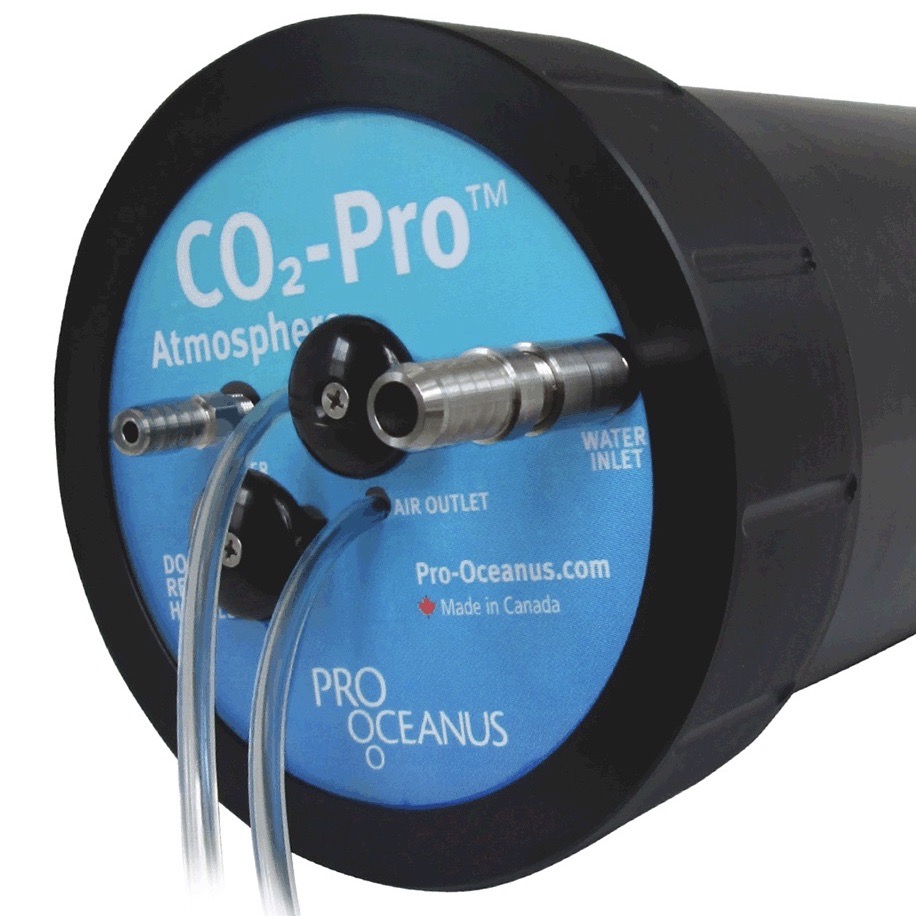
Wingard developed a protocol based on cross-comparisons of overlapping deployments of this sensor, comparing these with independent shipboard pCO2 measurements (including CTD samples and samples taken underway using flow-thru systems), and externally sourced air and surface water pCO2 measurements (e.g. from the LDEO Underway Database). This array of sampling techniques served to confirm the quality and scientific applicability of the Endurance Array pCO2 measurements.
He reported the results of this assessment at a poster session at the recent Ocean Sciences 2020 meeting held this past February in San Diego, CA. The protocol is largely applicable to the same suite of measurements made using the Pro-Oceanus sensor on moorings deployed in the OOI Pioneer, Irminger Sea, Southern Ocean, and Argentine Basin Global Arrays. The MATLAB code and data used to download, process, merge, and cross-compare the data used in this assessment are available online for use.
Both the air and surface water measurements and the flux estimates used in this assessment are available through the OOI Data Portal. Endurance Array air and surface water pCO2 measurements are made at four locations distributed across the Oregon and Washington shelf and slope within the northern California Current Marine Ecosystem.
Other sources of Endurance Array-specific data include the most recent 60 days of the Endurance Array’s air and surface water pCO2 data are available on the NANOOS Visualization System (NVS) and the Global Ocean Acidification Observing System Data Portal (GOA-ON).
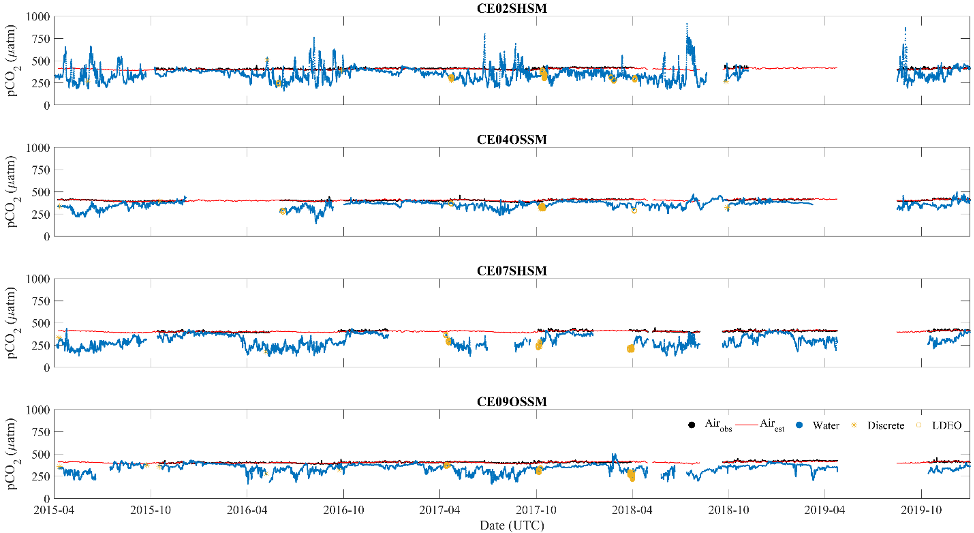
Figure 1: Surface water (•) and air pCO2 (•, observed and —, array average) measurements from 2015-04-01 through 2019-12-31 for the four moorings. The plots also show the distribution of discrete sample (*) and LDEO V2018 (O) data that coincide with each mooring. The data plotted have had human-in-the-loop (HITL) QC flags applied to remove points marked as suspect or failed. Beyond smoothing the data records and the estimation of an array averaged air pCO2 (—), no further corrections were applied to the data. Note the high degree of variability during the summer months in the surface water pCO2 measurements for CE02SHSM, which are similar to other observations made on the Oregon Shelf (Evans et al., 2011).
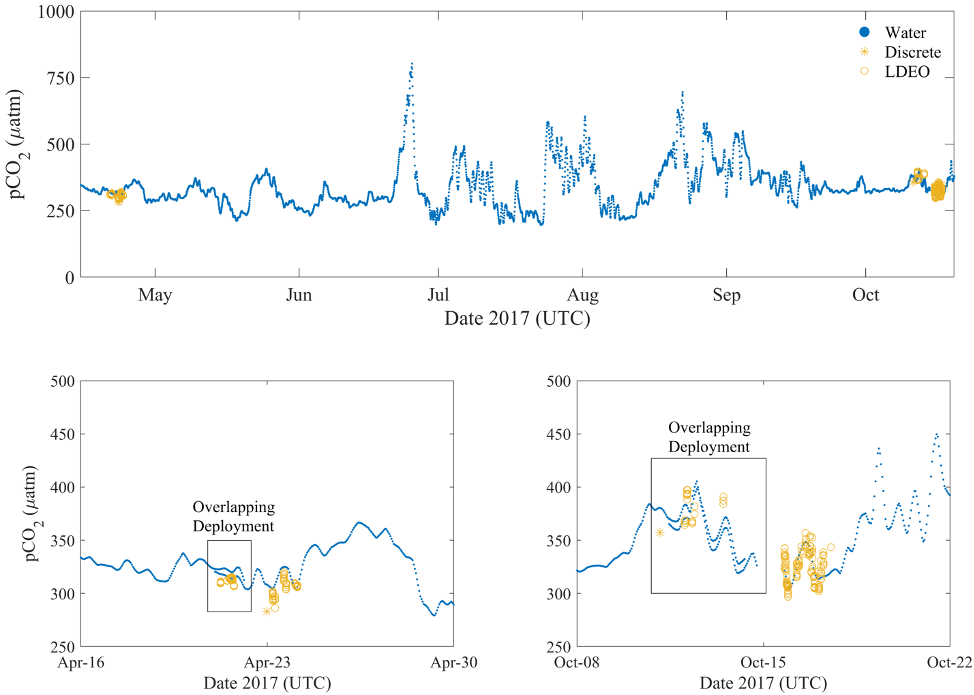
Figure 2: Focused view (upper panel) of the Spring 2017 deployment (#5) of CE02SHSM showing the observed offsets between the surface water pCO2 measurements (•) and the discrete samples (*) and LDEO V2018 (O). Detailed views in the lower two panels, provide a better picture of the observed offsets during the periods of over-lapping deployments; between deployments 4 and 5 (lower left) and deployments 5 and 6 (lower right). Prior to using the OOI pCO2A data, users are strongly encouraged to conduct such cross-comparisons. The independent measurements obtained by the separate systems, and the close agreement between them, provide measures of confidence in the accuracy and applicability of the data.
Read MoreOOI Launches “Download” to Keep Community Informed
[/media]
The first issue of Download, the OOI’s new newsletter, was released on 1 May. It provides a short, concise look at the OOI, with clickable links for digging deeper into specific topics. It covers the latest OOI developments, scientific advances being made using OOI data, and opportunities for you to participate in the OOI, through help with proposals, data use, workshops, and other events.
The newsletter is available online here. If you’d like to subscribe, please send an email to dtrewcrist@whoi.edu, with a subject line: Download subscribe.
Read More
A Hat for a New Name
In July, OOI will launch the Beta version of our new and improved data discovery tool. We are asking for the community’s help in naming the tool, which will make it possible to:
- search and download data from cabled and moored arrays and recovered data from for in situ physical, chemical, geological, and biological observations
- compare datasets across regions and disciplines
- generate and share custom data views
- download full data sets using ERDDAP
Want to take a crack at coming up with a name? The selected winner will receive an OOI hat in recognition of his/her creativity. If there is more than one winner, each will receive an OOI hat.
The deadline for submission is 15 May 2020. Please submit your nominations to dtrewcrist@whoi.edu, with subject line: “I deserve a hat!
Read MoreTalented Seafloor Workhorse
Enjoy some amazing underwater footage of the work that takes place off the Oregon coast to bring scientists and educators a constant stream of data from the seafloor through the water column across the Juan de Fuca plate.
https://vimeo.com/412358105
[embed]http://iframe%20src=https://player.vimeo.com/video/412358105%20width=640%20height=360%20frameborder=0%20allow=autoplay;%20fullscreen%20allowfullscreen/iframe[/embed]https://vimeo.com/user110037220/download/412358105/01ffce7409
Read MoreSpring Endurance Cruise Canceled due to COVID-19
The spring 2020 OOI Endurance Operations and Management (O&M) turn cruise has been canceled due to travel and personnel restrictions imposed to stem the spread of the virus COVID-19. The 16-day cruise was set to depart on 31 March from Newport, Oregon aboard the R/V Sikuliaq to service the array off the Oregon and Washington coasts.
Jonathan Fram, Program Manager of the Endurance Array, explains in this EOS article some of the possible implications of the cancellation, which may range from some of the moorings losing power, to the gliders running out of batteries, to possibly missing the recording data documenting the coastal ocean’s transition from winter to spring.
The fall 2020 Endurance turn cruise (currently scheduled for September) is expected to take place.
Read More
Array Enhanced Understanding of Complex Southern Ocean
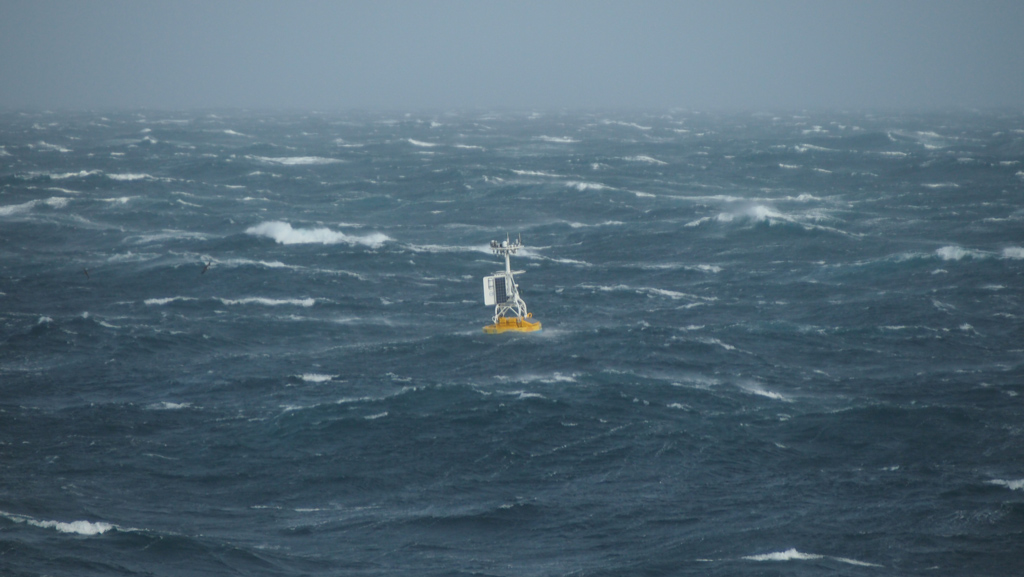
Five years of data have made a significant difference in understanding of the complex processes occurring in the remote and hostile conditions of the Southern Ocean. In its five years of deployment, OOI’s Southern Ocean Array has provided critical data that enhanced weather modeling and forecasting, while providing means to study the mechanisms behind Southern Ocean warming and the storage of carbon at depth.
Four OOI moorings were deployed in February 2015 in a very sparsely sampled area in the Southern Ocean (55 degrees South, 90 degrees W) with the goal of helping modelers, forecasters and scientists understand this dynamic and volatile environment. One mooring was decommissioned in 2017. Two bottom halves remained in place through 2018 and a single surface mooring remained in place through January 2020. Collectively, these deployments provided a continual treasure trove of data to scientists, modelers, and forecasters.
This data stream is particularly important because the Southern Ocean is not only warming faster than other parts of the world ocean, it has also been implicated as the major region for ocean uptake of carbon dioxide.
“Collecting continuous data in this sparsely sampled region has provided a groundtruth point to help refine climate models and weather forecasts, and better understand complex processes occurring in the Southern Ocean,” said Dr. Sheri N. White, lead systems engineer for the Coastal Global Scale Nodes of OOI at Woods Hole Oceanographic Institution and chief scientist on the 2018 and 2020 OOI expeditions that recovered the Southern Array.
The benefits of deployment were evident. When the moorings were first deployed in 2015, data were not initially integrated into the World Meteorological Organization’s Global Telecommunication System (GTS). In August 2017, when the data were added to the GTS, making them more easily accessible for weather forecasters and modelers, they had an almost immediate impact on forecasting by the European Centre for Medium-Range Weather Forecasts (ECMWF). In August 2017, for example, OOI’s Surface Buoy picked up a low-pressure system moving through the area. Integrating these data into forecast models, researchers filled in some key spatial gaps in their observational coverage, reducing the error in 24-hour forecasts. With improved data, ECMWF was better able to forecast the next huge Southern Ocean storm with a central pressure around 955 mb that had simultaneous major impacts on southern South America, Drake Passage, and the Antarctic Peninsula.
The Southern Ocean Array also provided a platform for interagency and interdisciplinary collaborations. The National Science Foundation and its UK counterpart, the National Environmental Research Council joined forces to support two expeditions in 2018 and 2020. The 2018 expedition recovered the bottom halves of the moorings, while outfitting the surface mooring with equipment to measure silicate and nitrate using “lab-on-a-chip” technology (miniaturized analytical devices that integrate laboratory operations into a single chip on a very small scale.) This work was an investigation undertaken by Dr. Adrian Martin of the UK’s National Oceanography Centre and an investigator for CUSTARD (Carbon Uptake and Seasonal Traits in Antarctic Remineralisation Depth). The sensors and the surface mooring were recovered during the 2020 expedition.
“CUSTARD focuses on how interactions between marine organisms, nutrients in the water and the ocean circulation control the storage of carbon at depth. To do so requires information through the year because of the boom and bust seasonal cycle of phytoplankton,” explained Martin. “The mooring gave us both a variety of important data as well as a platform to deploy some of our own sensors year-round in the challenging environment of the Southern Ocean. The CUSTARD project benefited immensely from our collaboration with OOI. “
The OOI moorings also provided scientists with a means to study the mechanisms behind Southern Ocean warming. In a study led by Sarah Ogle of Scripps Institution of Oceanography, scientists found that just a few extreme storm events drive most of the mixed-layer deepening, suggesting that air-sea heat exchange is a highly episodic process.
“Only the largest storm events each year are able to mix the upper ocean enough to influence the ocean interior,” said Dr. Sarah Gille, also of Scripps and a member of OOI’s Facility Board. “With the removal of OOI, we’ve lost one window into these big events, but from the OOI data, we’ve gained some perspective on what types of measurements need to be collected to understand air-sea exchange in the region. In the future, I hope that we’ll be able to make use of newer autonomous systems to continue the research started in the Southern Ocean with OOI.”
[media-caption type="vimeo" path="https://vimeo.com/398932101" link="#"] Crew members recover the last Southern Array Surface Mooring (9000+ lbs) aboard the RRS Discovery, operated by the Natural Environment Research Council.Video courtesy of Dr. Adrian P. Martin, National Oceanography Centre [/media-caption] Read MoreEndurance Cruise Delayed by COVID-19
The spring 2020 OOI Endurance Operations and Management (O&M) turn cruise has been delayed for at least 30 days due to travel and personnel restrictions imposed to stem the spread of the virus COVID-19.
The 16-day cruise was set to depart on 31 March from Newport, Oregon aboard the R/V Sikuliaq to service the array off the Oregon and Washington coasts. The R/V Sikuliaq is part of the US academic research fleet managed by UNOLS (the University-National Oceanographic Laboratory System). UNOLS imposed a 30-day suspension in fleet operations on 13 March to help ensure the safety of the ship’s crew and science party and to mitigate the risk of virus spread. Rescheduling of activities will commence once the situation stabilizes and UNOLS sees a path forward to re-start research vessel operations safely.
Upcoming O&M cruises for the Pioneer, Irminger, and Papa Arrays also are scheduled aboard UNOLS vessels (R/V Neil Armstrong and R/V Sikuliaq). These cruises fall outside of the UNOLS current 30-day suspension so cruise preparation continues.
We do not anticipate that cruise schedule changes will affect the collection nor dissemination of OOI data, which will continue to be available for users here.
Read More
Metadata Review Improves OOI Data
OOI’s data teams have just completed an extensive, year-long review of critical metadata to ensure the quality and usability of data for OOI data users. The review covered data collected through the end of 2019 and included instrument calibration coefficients, instrument deployment assignments, and deployment dates. Moving forward, all metadata verification will conform to the standards established during the review.
“Our reason for undertaking this review was no more complicated than to make the data better for our data users,” explains Jeffrey Glatstein, Senior Manager of Cyberinfrastructure and OOI Data Delivery Lead. “It is the first time since the inception of the program that we’ve really gone in and looked at the metadata from top to bottom. If there was a calibration that was off, a depth missing, or something misspelled, we found it.
“This intense and deliberative review process brought historic metadata up to current standards to ensure continuity, completeness of records, and consistency in how metadata are reported now and moving forward.”
The data teams used a combination of human review and an automated script development process to identify and correct data issues. The human-in-the-loop (HITL) process ensured that two sets of eyes verified each metadata product, whenever possible, while the scripts performed automated verification and generated reports to pass back into the HITL workflow.
“This initiative is part of ongoing OOI efforts to make its data more accessible, user friendly, and integrated into ongoing science,” adds Glatstein.
Check Previously Downloaded Data
The OOI Data Portal operates on a process-on-demand model, which means that data downloaded prior to the end of 2019 should be checked to see if relevant metadata has been modified.
Users can check to see if changes were made to relevant metadata by clicking here. This link provides a searchable database by array, platform, and instrument to help ensure that previously downloaded data are correct or if they need to be re-downloaded so users are working with the best available data. The OOI data teams are continuing to verify the historical deployment assignments/dates, and the results will be updated accordingly
[feature]A Gargantuan Effort
As part of the transition of OOI to 2.0 in October 2018, the RCA data team initiated a comprehensive audit of all critical metadata to ensure that data products served by the OOI Cyberinfrastructure system meet Quality Assurance/Quality Control standards set by the program and expected from the user community. This daunting task included the examination of over 700 calibration files from 2013 to the present. The results of this audit were used to aid in evaluation of current processes and guide in adapting workflows to improve QA/QC efforts and communication to the users, a vital component to building confidence in the OOI datasets as reliable and valuable resources that can be used in scientific research and education.
Wendi Ruef, Research Scientist, Regional Cabled Array
The CGSN Data Team worked carefully and methodically through thousands of files containing over 30,000 calibration coefficients and other critical metadata. We now have a high level of confidence in past metadata and a strong process for continued review going forward.
Al Plueddemann, Chief Scientist, Coastal Global Scale Nodes
[/feature] Read More