
Science Highlights
New Hints When Axial Might Erupt: Precursor Events Detected Through Machine Learning
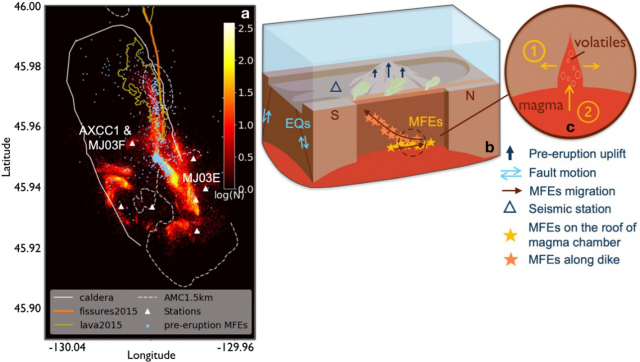
A recent paper by Wang et al., “Volcanic precursor revealed by machine learning offers new eruption forecasting capability” [1] describes the characterization of time-dependent spectral features of earthquakes at Axial Seamount prior to the 2015 using unsupervised machine learning (this method applies algorithms to analyze data without humans in the loop). A major finding from this work is the identification of a distinct burst of mixed-frequency earthquake (MEF) signals that rapidly increased 15 hours prior to the start of the eruption, peaked one hour before lavas reached the seafloor, and earthquakes at Axial Seamount prior to the 2015 using unsupervised machine learning (this method applies algorithms to analyze data without humans in the loop). A major finding from this work is the identification of a distinct burst of mixed-frequency earthquake (MEF) signals that rapidly increased 15 hours prior to the start of the eruption, peaked one hour before lavas reached the seafloor, and migrated along pre-existing faults. The earthquakes are thought to reflect brittle failure driven by magma migration and/or degassing of volatiles. The source mantle beneath Axial Seamount contains extremely high CO2 concentrations leading to high concentrations in the melts [3,4]. MEFs were detected for months prior to the eruption, which could result from volatile release associated with inflation of the sills that feed Axial [5]. Importantly, the identification of these signals may help forecasting of the upcoming Axial eruption and may also be applied to other active volcanoes.
The authors utilized a wealth of geophysical data from the past decade to present an integrated view of Axial (Figure 1) including a subset of earthquake data 4 months prior to the eruption (67,767 out of their >240,000 earthquake catalogue from the RCA seismic array [2]), coupled with bottom pressure from BOTPT instruments at the Central Caldera and Eastern Caldera sites, and 3D modeling.
[caption id="attachment_34973" align="alignnone" width="640"]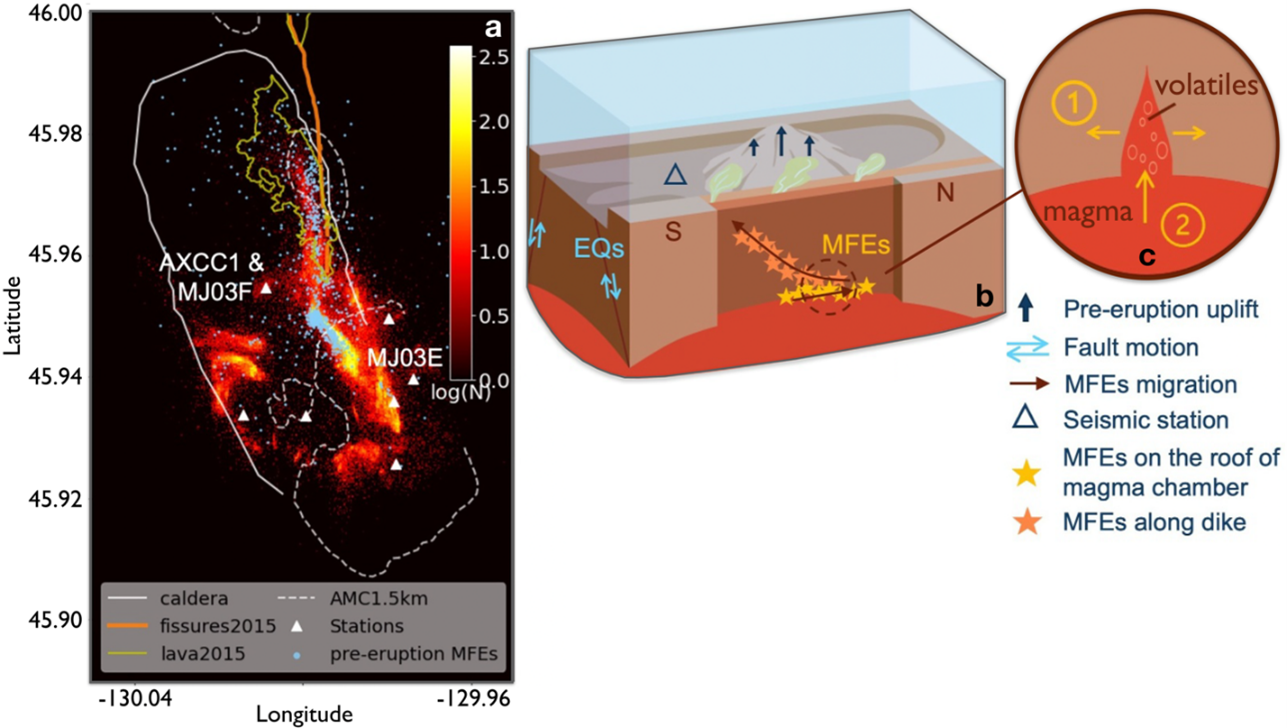 After Wang et al., 2024 [1] Figures 1 and 4: a) Heatmap of earthquake density at Axial Seamount from Nov 2014 to Dec 2021 [2]. Image highlights mixed‐frequency earthquakes (MFEs – light blue dots) one day before the eruption, the caldera rim (white solid line), the 1.5 km depth contour of the Axial magma chamber (AMC)(dashed white line), eruptive fissures (orange lines), lava flows of the 2015 eruption (yellow lines), the location of the RCA short-period seismometer array (white triangles),broadband seismometer AXCC1 and bottom pressure tilt instruments (MJ03E and MJ03F. Heatmap shows the number of earthquakes in each 25 m × 25 m bins. b) Cartoon summarizing observations. Tidally‐driven earthquakes occur on caldera ring faults, while the MFEs track movement of volatiles and magma prior to the eruption. c) possible mechanisms of the MFEs. ① and ② correspond to crack opening and volatile/magma influx processes.[/caption]___________________
References:
[1] Wang, K., F. Waldhouser, M. Tolstoy, D. Schaff, T. Sawi, W.S.D. Wilcock, and Y.J. Tan (2024) Volcanic precursor revealed by machine learning offers new eruption forecasting capability. Geophyiscal Research Letters, 51 (19) https://doi.org/10.1029/2024GL108631.
[2] Wang, K., F. Waldhouser, D.P. Schaff, M. Tolstoy, W.S.D. Wilcock, and Y.J. Tan (2024) Real-time detection of volcanic unrest and eruption at Axial Seamount using machine learning. Seismological Research Letters, 95, 2651–2662, doi: 10.1785/0220240086.
[3] Helo, C., M.-A. Longpre, N. Shimizu, D.A. Clague and J. Stix. (2011) Explosive eruptions at mid-ocean ridges driven by CO2-rich magmas. Nature Geoscience. 4, 260–263 (2011). https://doi.org/10.1038/ngeo1104.
[4] Dixon, J. E., E. Stolper, E., and J.R. Delaney (1988). Infrared spectroscopic measurements of CO2 and H2O in Juan de Fuca Ridge basaltic glasses. Earth and Planetary Science Letters, 90(1), 87–104. https://doi.org/10.1016/0012‐821x(88)90114‐8.
Read MoreDeep-Ocean Vertical Structure
It is often assumed that, at frequencies below inertial, the vertical structure of horizontal velocity and vertical displacement can be reasonably described by a single dynamical mode, e.g. the lowest order flat-bottom baroclinic mode. This is appealing because it would mean that first-order predictions of deep-ocean velocity structure could be determined from knowledge of density and surface currents. However, there is a relative paucity of full ocean depth data to test this idea. A study by Toole et al. (2023) used full ocean depth data from five sites – four of which are Ocean Observatories Initiative (OOI) arrays (Station Papa, Irminger Sea, Argentine Basin and Southern Ocean) – to address the question “does subinertial ocean variability have a dominant vertical structure?”
Data analysis was challenging, because it involved working with gappy records as well as combining information from multiple instruments on different moorings. As noted by the authors, “no single OOI mooring sampled velocity, temperature and salinity over full depth.” Wire-following profiler data from Hybrid Profiler Moorings were combined with ADCP and fixed-depth CTD data from adjacent moorings. While the authors note that “depth-time contour plots of the velocity data from each OOI site clearly reveal the shortcomings of the datasets” they also recognized that despite the shortcomings, “these observations constitute some of the only full-depth observations of horizontal velocity and vertical displacement from the open ocean.”
It was possible to obtain 2-3 years (non-contiguous in some cases) of near-full ocean depth data from each site. Inertial and tidal variability was removed, and the data were filtered over 100 hr (~4 days). Empirical Orthogonal Function (EOF) decomposition was used to identify an orthogonal basis set that described horizontal velocity and vertical displacement. In addition, dynamical modes were determined for three cases: flat bottom, sloping bottom and rough bottom. Note that computing the dynamical modes requires the vertical density profile, which was taken as the mean over each deployment. Analysis was focused on the lowest modes, which accounted for the majority of the variance.
The results (Figure 32) showed that there is an EOF consistent with a dynamical mode at most sites. However, the appropriate dynamical mode is different for each site – no single dynamical accounted for a dominant fraction of variability across all sites. The authors note that differences in bathymetry, stratification and local forcing complicate the picture, with different dynamical processes dominating at different sites. Prior studies (not full ocean depth) that appear to show a “universal” vertical structure may be misleading
This project shows the potential for OOI data, with appropriate processing and analysis, to provide unique insights into ocean structure and dynamics. The researchers have made the combined vertical profile data available to the community on the Woods Hole Open Access Server. The dataset DOI (https://doi.org/10.26025/1912/66426) is also linked here: https://oceanobservatories.org/community-data-tools/community-datasets/.
[caption id="attachment_34586" align="alignnone" width="624"] Mode 1 EOFs for velocity (u, red; v blue; cm/s) and vertical displacement (black, decameters) for OOI arrays at (from left) Argentine Basin, Southern Ocean, Station Papa and Irminger Sea. Adapted from Toole et al., 2023.[/caption]
___________________
References:
Toole, J.M, R.C. Musgrave, E.C. Fine, J.M. Steinberg and R.A. Krishfield, 2023. On the Vertical Structure of Deep-Ocean Subinertial Variability, J. Phys. Oceanogr., 53(12), 2913-2932. DOI: 10.1175/JPO-D-23-0011.1.
Read MoreSubsurface Acoustic Ducts in the Northern California Current System
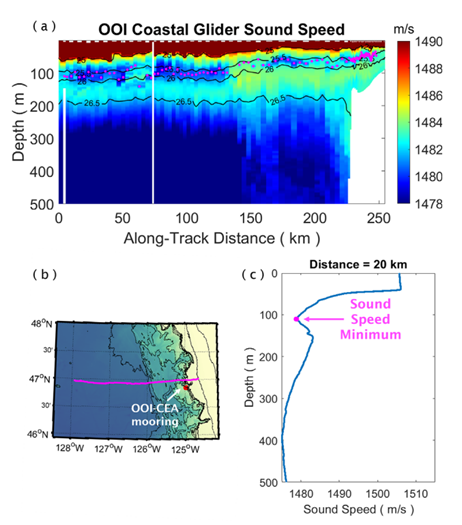
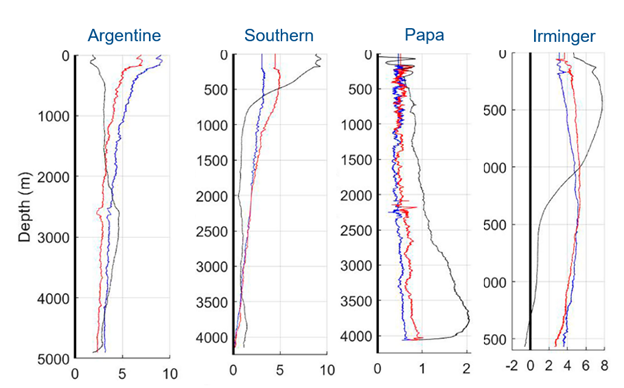
Xu et al.’s analysis of the hydrographic data recorded along the U.S. Pacific Northwest coastline leads to the identification of a secondary subsurface acoustic duct. A numerical simulation based on the sound-speed field determined from OOI Coastal Endurance and APL-UW glider CTD data suggests that the presence of the duct has major impact on sound propagation at a mid-range frequency of 3.5 kHz in the upper ocean (Figure 31). Specifically, the ducting effect is evident in the trapping of sound energy and the consequent reduction in transmission loss within the duct. Glider observations show that the duct is a large-scale phenomenon that extends hundreds of kilometers from the outer continental shelf to regions offshore of the continental slope. The axis of the duct shoals onshore from between 80 and 100 m depth offshore of the continental slope to less than 60 m over the shelf. Analysis of the sound-speed profiles determined from glider CTD data suggests that the prevalence of the duct decreases onshore, from over 40% in regions offshore of the continental slope to less than 5% over the shelf. In addition, analysis of the long-term time series of sound-speed profiles determined from the CTD data recorded over the shelf slope off the Washington Coast suggests that the duct is more prevalent in summer to fall than in winter to spring. Furthermore, examination of concurrent OOI Coastal Endurance Array (Washington Offshore Profiling Mooring) observations of sound speed and flow velocity indicates that the duct observed over the shelf slope is associated with a vertically sheared along-slope velocity profile, characterized by equatorward near-surface flow overlaying poleward subsurface flow.
[caption id="attachment_34581" align="alignnone" width="462"] (adapted from Fig. 3 of Xu et al., 2024) (a) The sound-speed field obtained from the CTD data recorded by an OOI-CEA coastal glider during 06-16 October 2018. The contour lines are potential density (in kg/m3). The magenta dots mark the locations of the local sound-speed minima along the axis of the subsurface duct. (b) The trajectory of the Seaglider. The red dot marks the location of the OOI-CEA Washington Offshore profiler mooring. The bathymetry contour lines mark seafloor depths in 100 m increments between 10 and 500 m and then in 500 m increments between 500 and 3000 m. (c) The vertical sound-speed profile at 20 km along-track distance. The local sound-speed minimum at the axis of the duct is labeled.[/caption]
___________________
References:
Guangyu Xu, Ramsey R. Harcourt, Dajun Tang, Brian T. Hefner, Eric I. Thorsos, John B. Mickett; Subsurface acoustic ducts in the Northern California current system. J. Acoust. Soc. Am. 1 March 2024; 155 (3): 1881–1894. https://doi.org/10.1121/10.0024146
Read MoreAxial Seamount: The Phoenix Rises
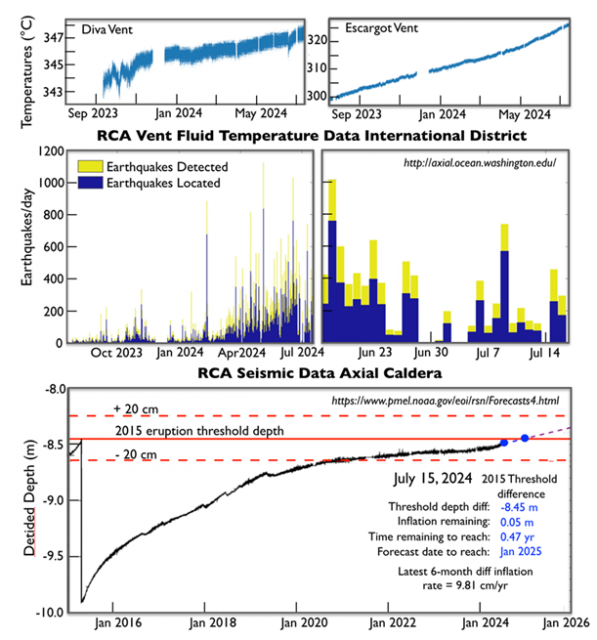
Regional Cabled Array live data feeds from the bottom pressure tilt, seismic, and temperature-resistivity instruments are capturing a marked increase activity at Axial Seamount with total seafloor uplift approaching the threshold depth for the 2015 eruption. As noted by W. Chadwick (OSU), whose website provides daily forecasts, the average differential inflation rate has almost doubled in the last six months. Bottom pressure tilt data at the Central and Eastern Caldera sites, show a marked increase in uplift beginning in April increasing from ~ 6 cm/yr to ~10 cm/year. The increase in uplift rates is coincident with a dramatic increase in seismic activity [viewable on daily plots of earthquakes accessible on W. Wilcock’s Axial Earthquake Catalogue (UW)] with >1000 earthquakes in a 24 hr period also occurring in April: seismic activity remains, high, but has not reached the 1000’s per day as detected prior to the April 2015 eruption (Wilcock et al, 2016). The hydrothermal system in the International District Hydrothermal Field, located on the eastern rift zone within Axial Caldera, is also responding to this increased activity. Fluid temperatures measured by the temperature-resistivity sensor in a parasitic orifice on the side of the hydrothermal vent Escargot show an increase in the past 6 months, with a marked change in the past 3 months (Courtesy of W. Ruef, UW). Excitement is building as we watch this dynamic volcano respond to melt migration 2 km below the seafloor – January 2025 is not far away.
[caption id="attachment_34576" align="alignnone" width="597"] RCA bottom pressure tilt data Central Caldera Axial Seamount[/caption]
Read More Widespread and Increasing Near-bottom Hypoxia in Pacific NW Coastal Ocean
Barth et al. (2024) examined the 2021 summer upwelling season off the United States Pacific Northwest coast. Upwelling was unusually strong leading to widespread near-bottom, low-oxygen waters. During summer 2021, an unprecedented number of ship- and underwater glider-based measurements of dissolved oxygen were made in this region. Near-bottom hypoxia, that is dissolved oxygen less than 61 µmol kg−1 and harmful to marine animals, was observed over nearly half of the continental shelf inshore of the 200-m isobath, covering 15,500 square kilometers. A mid-shelf ribbon with near-bottom, dissolved oxygen less than 50 µmol kg−1 extended for 450 km off north-central Oregon and Washington. Spatial patterns in near-bottom oxygen are related to the continental shelf width and other features of the region. Maps of near-bottom oxygen since 1950 show a consistent trend toward lower oxygen levels over time. The fraction of near-bottom water inshore of the 200-m isobath that is hypoxic on average during the summer upwelling season increases over time from nearly absent (2%) in 1950–1980, to 24% in 2009–2018, compared with 56% during the anomalously strong upwelling conditions in 2021. Widespread and increasing near-bottom hypoxia is consistent with increased upwelling-favorable wind forcing under climate change.
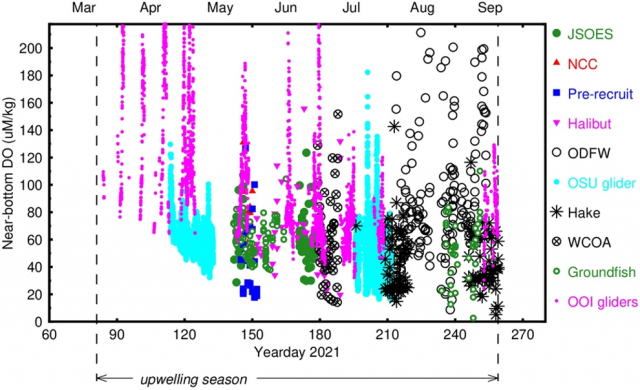
As part of their analysis, Barth et al. (2024) used NSF OOI glider data from 2021 along the Newport Hydrographic Line along with other data indicated in Fig x.. Near-bottom dissolved oxygen data from each survey as a function of time show the typical decrease of minimum values as the summer hypoxia season proceeds (Fig. x). High DO values are measured by the OOI gliders early in the upwelling season when winds were relaxed or downwelling-favorable early in the upwelling season, and by the Oregon Department of Fisheries and Wildlife (ODFW) survey that focused on very shallow (water depths of 50 m or less), inshore waters.
[media-caption path="https://oceanobservatories.org/wp-content/uploads/2024/05/Endurance-Figure.png" link="#"]Figure x Near-bottom dissolved oxygen as a function of time during the 2021 summer upwelling season.[/media-caption]__________________
Reference:
Barth, J.A., Pierce, S.D., Carter, B.R. et al. Widespread and increasing near-bottom hypoxia in the coastal ocean off the United States Pacific Northwest. Sci Rep 14, 3798 (2024). https://doi.org/10.1038/s41598-024-54476-0
Read MoreOOI Data Sonification
The assumption that quantitative data can be well represented not only in charts and graphs, but by increasingly sophisticated visual displays, is often taken for granted. However, researchers, instructors, and curators of museums and science centers also recognize that even the most sophisticated visual displays are inaccessible to those with low-vision or blindness. There is also the potential for alternative data presentation methods to improve understanding of complex data for sighted individuals. With these considerations in mind, a team led by Dr. Bower (WHOI) has pursued the creation of auditory displays or “data sonifications” using multi-disciplinary U.S. National Science Foundation Ocean Observatories Initiative (OOI) data sets as the basis. The results to date from the NSF-funded data sonification project are reported in a recent publication by Smith et al. (2024).
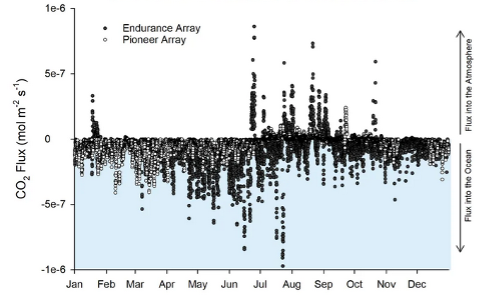
[media-caption path="https://oceanobservatories.org/wp-content/uploads/2024/05/Data-Sonification-figure.png" link="#"]Figure 1. Time series data from two data nuggets created by Ocean Data Labs that were used for sonification. Surface meteorology during the passage of hurricane Hermine over the Pioneer Array in 2016 (upper). The CO2 flux between ocean and atmosphere for both Pioneer (open circles) and Endurance Arrays during 2017 (lower).[/media-caption]Data sonification involves the mapping of quantitative data from its original form to audio signals in order to communicate complex information content. The project team was interested in using actual ocean data spanning a variety of oceanographic disciplines. Time series data produced by OOI sensors provide an excellent starting point. In particular, the Ocean Data Labs group at Rutgers has reviewed OOI data and created a set of “data nuggets” that are appropriate for sonification (Greengrove et al., 2020). The data nuggets comprise a broad range of oceanographic phenomena observed by OOI sensors, including response to a storm, the diurnal migration of zooplankton, a volcanic eruption, and the flux of CO2 between ocean and atmosphere.
The project team used a rigorous approach to developing and refining the auditory presentations. Starting with a set of learning objectives for each data nugget, a multi-step process was used to create the sonification. First, oceanographers were interviewed to establish the important points to be conveyed for a given data nugget. Next, classroom instructors were interviewed to get feedback on the most effective approaches to using sound to explain data properties. A sound designer then created an initial mapping of the data to sound, which was reviewed by a representative group of researchers, instructors, and blind and visually impaired listeners. After additional rounds of refinement and feedback, the prototype sonifications are now available. Two auditory displays utilizing Pioneer Array data (Fig. 1) are available at https://doi.org/10.5281/zenodo.8162769 and https://doi.org/10.5281/zenodo.8173880 for CO2 flux and storm response, respectively. Other examples can be found in Smith et al. (2024). The sonifications will be evaluated broadly using an on-line survey and by a “live audience” at museums and science centers.
This project is unique in exploiting the rich OOI data set and making ocean science highlights available to a broad community of students and the general public. A significant aspect of the work, as pointed out by the authors, is the systematic and inclusive approach used to develop the data sonifications. Results of the museum testing phase in 2024 will be awaited with great anticipation.
___________________
References:
Greengrove, C., S. Lichtenwalner, H.I. Palevsky, A. Pfeiffer-Herbert, S. Severmann, D. Soule, S. Murphy, L.M. Smith and K. Yarincik, 2020. Using authenticated data from NSF’s Ocean Observatories Initiative in undergraduate teaching, Oceanography, 33(1), 62-73.
Smith, L.M., A. Bower, J. Roberts, J. Bellona and J. Li, 2024. Expanding access to ocean science through inclusively designed data sonifications, Oceanography, 36(4), 96-101.
Read More
QARTOD Flag Statistics Using Cloud-Based Resources and Zarr Data Formats
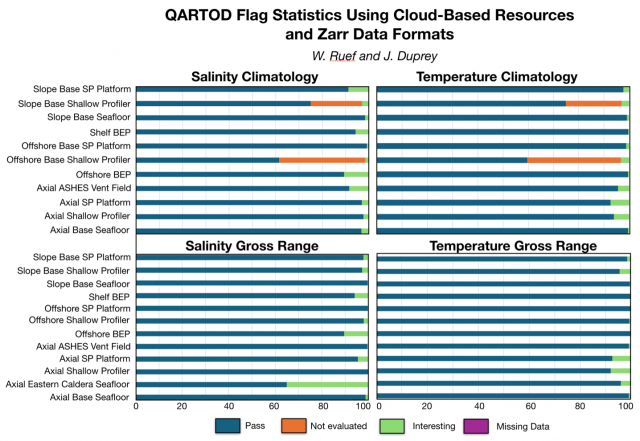
Central to the Regional Cabled Array (RCA) Quality Assurance/Quality Control (QA/QC) workflow is a cloud-based data harvest and visualization platform that allows for efficient and timely review of the high-frequency and high-density time series data streaming from RCA instruments. A key component of this workflow is a Zarr-based version of the OOI RCA data, a cloud optimized file format that stores metadata separately, allowing data chunks to be retrieved without loading the entire dataset. Using Zarr files and Amazon Web Services (AWS) cloud computing resources for QA/QC has made it possible to create a dashboard that is refreshed daily for multiple high-density datasets and parameters. This also results in minimization of both costs and OOI-Cyberinfrastructure load by appending only new data daily, with a full dataset refresh occurring only when necessary. Because the Zarr files contain time-series data records that include all variables served through M2M (Machine to Machine Learning), this workflow also allows for the efficient deep data review that is currently required for compiling and reviewing QARTOD (Quality Assurance/Quality Control for Real-Time Oceanographic Data) data flag tables.
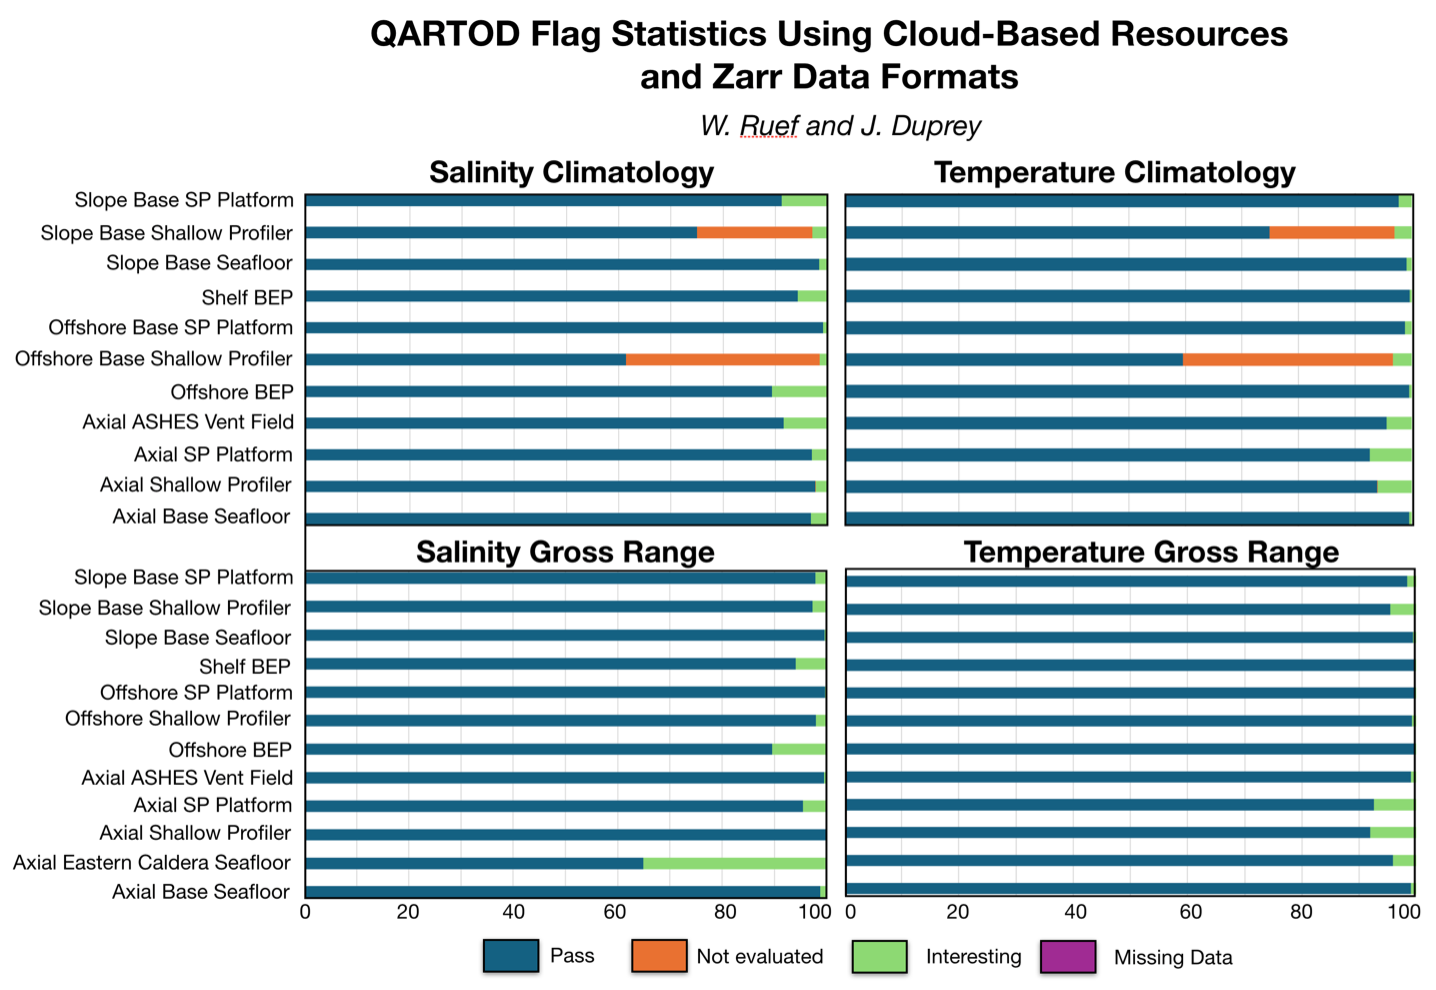
With the existing Zarr files, we were able to quickly access all active QARTOD flags in the RCA data streams for gross range and climatology and produce basic summary statistics for each parameter using minimal AWS cloud and data team resources. The figures above include the results from CTD (Conductivity, Depth, and Temperature) streams across the RCA for temperature and salinity, for both gross range and climatology QARTOD tests. In this initial compilation over 90% of all data points pass the gross range tests for temperature, and all except 2 pass gross range tests for salinity. Similar results were seen with the climatology tests, with nearly all streams having less than 10% of data points flagged as “suspect or interesting”. Most of the flags for non-passing data points in the climatology results were values of “not evaluated” in the Offshore and Slope Base Shallow Profiler streams. Our first set of investigations will focus on these streams to identify the cause for these flags. A suspected cause may be that the isoclines in the water column are not being accurately represented in the climatology depth bins.
Read More
Diel Vertical Migrators Respond to Short-Term Upwelling Events
Sato and Benoit-Bird, in their 2024 publication, explore how animals remain in a productive yet highly advective environment in the Northern California Current System using NSF OOI Regional Cabled Array (RCA) and Endurance Array (EA) data from the Oregon Shelf site. They characterized fish biomass using upward-looking active bio-acoustic sonar data from the RCA and interpreted results in consideration of upwelling and downwelling using EA wind data and combined cross-shelf velocity data from the RCA and EA.
Acoustic scatterers, consistent with swim bladder-bearing fish, were only present during the downwelling season as these animals avoided the cold waters associated with strong upwelling conditions in summer and fall. Fish responded to short-term upwelling events by increasing the frequency of diel vertical migration. Throughout the study, their vertical positions corresponded to the depth of minimum cross-shelf transport, providing a mechanism for retention. The observed behavioral response highlights the importance of studying ecological processes at short timescales and the ability of pelagic organisms to control their horizontal distributions through fine-tuned diel vertical migration in response to upwelling.
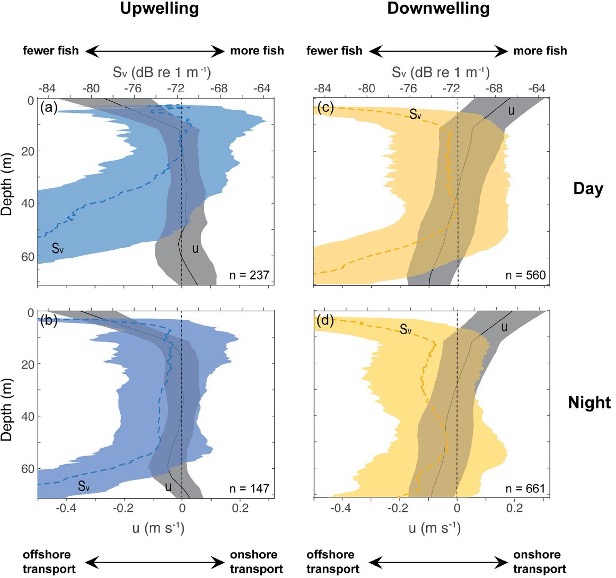
Time series data provided by the combined EA and RCA data made it possible for Sato and Benoit-Bird to perform consistent statistical analyses of bio-acoustic sonar, wind and ocean velocity data [Figure 22, after Figure 4, Sato and Benoit-Bird (2023)]. The vertical positions of scattering layers relative to the cross-shelf velocities revealed the careful positioning of animals at the depth of minimum onshore- offshore transport. The authors focused on cross-shelf transport, the most significant mechanism affecting population dynamics of pelagic organisms. During strong upwelling periods, cross-shelf velocities were strong near the surface and became nearly zero below 15-m depth. The peak scattering layers were in the upper 20 m of the water column during daytime, but organisms avoided the strong offshore currents at the surface (Figure 22a). At night, the scattering layers expanded their vertical distributions, but avoided the region nearest the bottom where onshore currents were strong (Figure 22b). During downwelling periods, scattering layers were located at the depth of minimal transport during day and night and animals avoided strong onshore currents near the surface and offshore currents near the bottom (Figures 22c and 22d).
[media-caption path="https://oceanobservatories.org/wp-content/uploads/2024/02/Science-Highlight-Feb-2024.jpg" link="#"]Figure 22: The influence of upwelling and downwelling on diel vertical migration[/media-caption]Sato and Benoit-Bird show that animals respond to the risk of offshore advection through active changes in their vertical movement that depend on upwelling conditions at daily time scales. Rapid behavioral response of animals to short-term upwelling events highlights their ability to finely tune their vertical positions relative to physical forcing which ultimately controls their horizontal distributions. This work expands our understanding of the ecological role of diel vertical migration beyond its role as a predator avoidance strategy and reveals a tight coupling between animal behavior and physical forcing.
Vertical profiles of cross-shelf velocities (u; gray, solid lines) and volume backscattering strength (Sv; colors, dotted lines), shown as mean ± standard deviations, during (a, b) strong upwelling periods with diel vertical migration and (c, d) strong downwelling periods without diel vertical migration. Data points qualified for strong upwelling and downwelling periods were selected from the time series over 14 months. Negative values in u indicate offshore transport and positive values indicate onshore transport, and larger Sv values suggest higher density of swim bladdered fish.
Read More
Soundscape Ecology Through Automated Acoustic-Based Biodiversity Indices
Soundscape Ecology Through Use of Automated Acoustic-Based Biodiversity Indices: A Test Using RCA Broadband Hydrophone Data. Adapted by OOI from Ferguson et al., 2023.
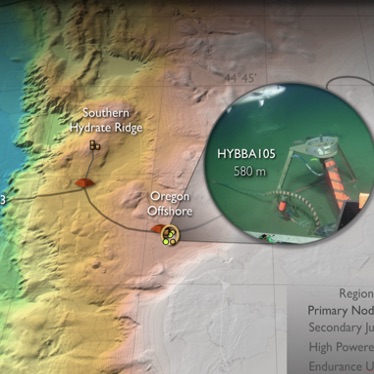
[media-caption path="https://oceanobservatories.org/wp-content/uploads/2023/07/Screenshot-2023-07-27-at-3.53.41-PM.png" link="#"]Figure a) Location of Regional Cabled Array broadband hydrophones used in this study. b) Acoustic Complexity Index associated with mammal calls, fish sounds, and anthropogenic noise. (After Ferguson et al., 2023).[/media-caption]Ferguson’s et al., 2003 paper explores the use of myriad biodiversity indices, generated by automated acoustic classifications, using data from three of the Regional Cabled Array (RCA) broadband hydrophones. As the authors point out, human in-the-loop evaluation of marine species and anthropogenic noise from very large data volumes generated by passive acoustic sensors is formidable. Yet, identification of marine organisms and anthropogenic noise is increasingly important for biodiversity conservation and ecosystem monitoring. Automated biodiversity indices have been utilized in terrestrial environments, but only limited studies have used machine learning to study soundscape ecology in marine systems. This study used broadband hydrophone (HYDBBA) data from Slope Base on the Shallow Profiler Mooring (200 m water depth and ~ 100 km offshore), at Oregon Offshore (580 m water depth and ~ 72 km offshore), and the Oregon Shelf site (80 m water depth and ~ 16 km offshore) (Figure 28a) to examine seven diversity indices. Note, these study sites are valuable to making progress in soundscape ecology because the Cascadia Margin is characterized by very high biological productivity impacted by the California current, it is the site of intense shipping lanes, and because of the availability of continuous, real-time acoustic data streams provide by the RCA.
In this initial study, Ferguson et al., evaluated one month of data from the three sites: January 2017 for HYBDDA 103 and 106 and April 2018 for HYBDDA 105. Five minute files were used with 7,101 files for Slope Base, 4,725 files for Oregon Offshore, and 6,410 files for the Oregon Shelf. Data from these instruments had been previously annotated, providing ground truthing for machine learning results. Periods of vocalization of marine mammals occurred less frequently at Slope Base. Three months of data were reviewed to examine periods of mammal vocalizations and anthropogenic sounds.
Identifying the relationship between numerous acoustic indices and species characteristics is complex and requires attention to a significant number of factors and computation of multiple tests, as described in detail in this paper. The Acoustic Complexity Index (ACI, Figure 28b), is generated from an algorithm to quantify biological sounds based on intensity, it is the most commonly used index to assess acoustic indices in marine systems, and has been demonstrated useful in identifying species diversity. Results from this work show that ACI measurements increased during vocalizations by dolphins and sperm whales. However, evaluation of the seven indices show that biodiversity cannot be explicitly determined from any single acoustic index. A significant finding from this study is that true assessment of large-scale ecosystem health and changes in indicator species, which may be due to differences in seasonal and interannual variability, requires co-located physical and chemical oceanographic data. The authors note that the RCA and Endurance Array instrumentation provides “an ideal scenario for accurately monitoring system health”.
_______________________________________________
Ferguson, E.L., H.M. Clayton, and T. Sakai (2023) Acoustic Indices Respond to Marine Mammal Vocalizations and Sources of Anthropogenic Noise. Frontiers in Marine Science. 10:1025464; doi: 10.3389/fmars.2023.1025464.
Read MoreThe Great Salinity Anomaly of 2015-2020
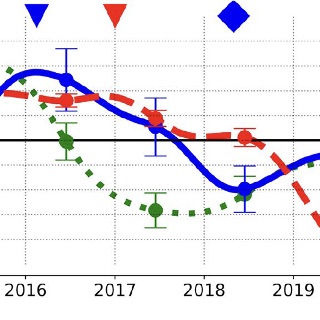
The Great Salinity Anomaly of 2015-2020. Adapted by OOI from Biló et al., 2022.
[media-caption path="https://oceanobservatories.org/wp-content/uploads/2023/07/Bilo-.png" link="#"]Figure: Time series of salinity anomalies from OSNAP moorings near the Reykjanes Ridge (RR) and within the western boundary current of the Irminger Sea (CF6), and from OOI Flanking Mooring (FLB) in the Irminger Sea (FLB). The eighteen-month low-passed anomalies are averaged between 0 and 200 m depth and computed relative to the mean of the moored data record. Error bars show 95% confidence intervals for annual salinity averages. The blue (red) triangles and diamonds represent the start and end of the freshening period in the CF6 (FLB) records, respectively.[/media-caption]Unusual surface freshening episodes in the Subpolar North Atlantic have been documented since the 1960s when the term Great Salinity Anomaly (GSA) was coined to refer to the first documented event (Dickson et al., 1988). GSAs are of great importance because the reduction in surface density of North Atlantic surface waters increases vertical stratification, suppresses deep water formation, and weakens the Atlantic Meridional Overturning Circulation (AMOC). Deep (700-1000 m) wintertime convection in the Irminger and Labrador Seas creates the water mass constituting the northern portion of the AMOC’s lower limb, which transports cold water back to southern latitudes. Thus, sustained changes to deep water formation due to a GSA will impact the global climate system.
New work by Bilo et al. (2022) argues that there has been another GSA during 2015-2020, with significant salinity reduction in the upper 200 m of the Iceland Basin and Irminger Sea. The authors use hydrographic data and moored observations to document the spatial extent and propagation pathways of the GSA.
Hydrographic data come from the Argo float monthly climatology and from UK Met Office Hadley Centre “enhanced” version 4 (EN4) historical hydrography. These spatial data sets allow the basin-wide salinity changes to be diagnosed, and show that between 2015 and 2020 the upper 200 m of the central Irminger Sea freshened by 0.1-0.2 PSU. The observed freshening rate of up to 0.04 PSU per year is among the fastest salinity decreases ever recorded in the region. The regional maps show the freshening first in the Iceland Basin and later in the Irminger Sea.
Moored observations come from the Overturning in the Subpolar North Atlantic Program (OSNAP) and from the OOI Irminger Sea Array. Two OSNAP moorings are evaluated, one on the eastern side of the Irminger Sea near the Reykjanes Ridge and one on the western side within the southward-flowing boundary current. OOI Flanking Mooring B was used to represent conditions in the central Irminger Sea. The results (Figure above) show a salinity minimum near the Reykjanes Ridge in 2017 followed by a minimum at the western boundary in 2018 and finally a significant (~0.1 PSU) salinity reduction in the Irminger Sea interior in 2019. Estimated transit times from the mooring data indicate that the salinity signal is advected quickly (months) by Irminger Sea boundary currents after crossing the Reykjanes Ridge and then spreads more slowly to the interior, taking of order two years to impact the central Irminger Sea.
The authors note that although climatologies are important to determine regional changes, these data are mostly limited to deep water. Moorings can provide data within the boundary currents, as well as well-resolved temporal evolution at multiple locations. This underscores the importance of a hybrid ocean observing system combining historical climatologies, broad spatial coverage (Argo), and time series data (OSNAP, OOI).
_______________________________________________
Biló, T.C., F. Straneo, J. Holte and I. Le Bras, (2022). Arrival of new Great Salinity Anomaly weakens convection in the Irminger Sea. Geophysical Research Letters, 49, e2022GL098857, doi:10.1029/2022GL098857.
Dickson, R.R., J. Meincke, S.-A. Malmberg, and A.J. Lee (1988). The great salinity anomaly in the Northern North Atlantic 1968–1982″. Progress in Oceanography, 20 (2): 103–151, doi:10.1016/0079-6611(88)90049-3.
Read More