
Science Highlights
A Three Stream Ocean Optics Model
A Three Stream Ocean Optics Model: Regional Implementation and Validation. Adapted by OOI from Miller M., 2022.
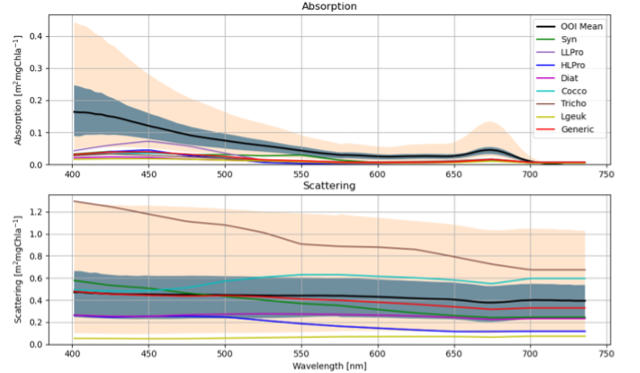
[media-caption path="https://oceanobservatories.org/wp-content/uploads/2023/07/EA-science-highlight.png" link="#"](Figure 3.10 from Miller (2022) Top: The black line shows the mean OOI absorption as a function of wavelength for OOI Endurance CSPP Oregon shelf deployment 15 (August – Sept 2019). The gray shading shows the OOI absorption extent between the 20% and 80 % quantiles. The tan shading shows the maximum and minimum extent of OOI absorption. The colored lines correspond to the modeled absorption for different single species approximations. Bottom: Same as top, but for scattering instead of absorption.[/media-caption]Miles Miller used OOI data as part of this MS thesis awarded September 2022 from the Univ. California, Santa Cruz. The goal of his work was to develop the potential to estimate phytoplankton community structure from remotely sensed optical information and not direct in situ phytoplankton observations. As a step towards this goal, he estimated phytoplankton community structure using spectrally dependent optical absorption and scattering data from an AC-S on the Oregon Shelf profiler. Miller developed linear relationships between modeled phytoplankton absorption and scattering and corresponding observations and solved them by constrained least squares inversion over a field of thirteen wavelengths using six phytoplankton types. He solved the problem for independent absorption and scattering as well as coupled absorption and scattering. He estimated phytoplankton communities as a function of profile depth and for multiple profiles in time.
The model produced accurate downward irradiance fields when using observed absorption and scattering profiles obtained from the Ocean Observatories Initiative’s Oregon Shelf Surface Piercing Profiler Mooring. Through this forward modeling-based comparison to observations it was found that the optical model can produce accurate profiles under certain conditions, making it promising for data assimilation of remote sensing reflectance as a function of wavelength. Miller identified several outstanding issues remaining to be addressed to move from using in situ measured absorption and scattering to estimates from remote sensing reflectance. Because the optical model accuracy is primarily dependent on absorption and scattering, he argued that remote sensing reflectance accuracy can be improved with enhanced phytoplankton community structure and CDOM estimations (see Figure 3.10 from Miller (2022). This figure shows that the modeled phytoplankton light attenuation agrees well with the measurements but that modeled absorption underestimates measurements. This underestimation hints that chromophoric dissolved organic matter (CDOM) is not being properly resolved as CDOM affects only total absorption and not scattering.
_________________________________________
Miller, M. (2022). A Three Stream Ocean Optics Model: Regional Implementation and Validation (master’s thesis). University of California, Santa Cruz. 62 pp.
Read MoreLong-Term Monitoring of Gas Emissions at Southern Hydrate Ridge
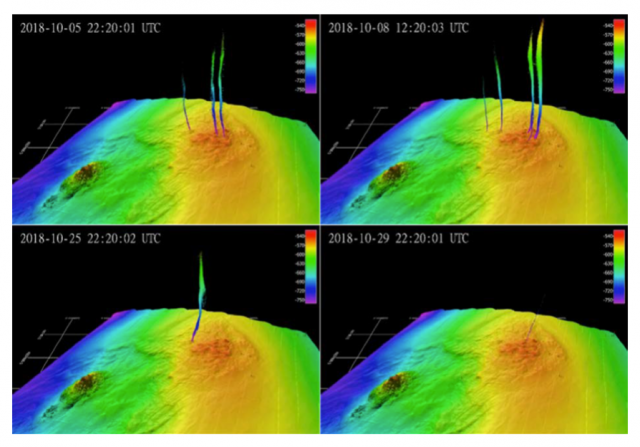
Identifying the parameters that control or influence seabed methane release is important to refining understanding of the carbon cycle. Data from the Regional Cabled Array are providing time-series required to quantify the flux of methane from the seafloor.
Read MoreFacilitating Observatory-Based Subseafloor Science
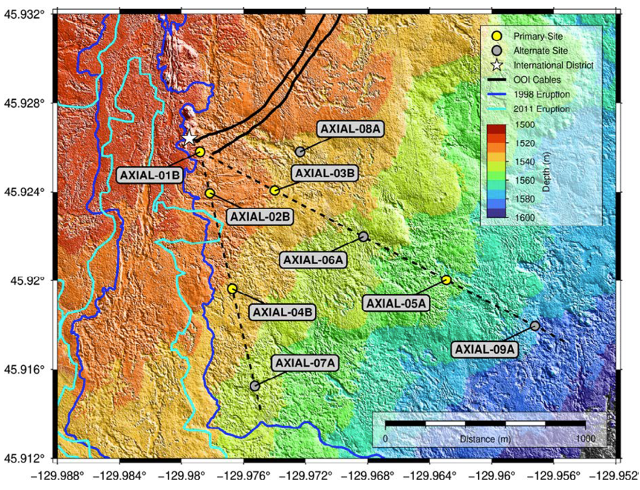
Data flowing from the Regional Cabled Array forms an unparalleled foundation to understand the relationships between microbial, hydrological, geochemical, and geophysical processes in active oceanic crust. Proposed Axial drilling will provide a unique opportunity to determine the nature of subseafloor hydrological properties and develop a 3-D understanding of subseafloor processes in unsedimented crust.
Read MoreDiscovery of Axial Seamount Deep Melt-Mush Feeder Conduit
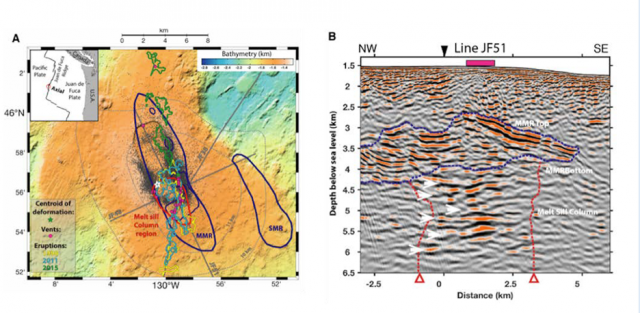
Recent observations at Axial Seamount provide new seismic images of the deep magma plumbing system, revealing a stacked sill complex beneath the main magma reservoir of this submarine volcano. The discovery of this deep melt-mush conduit at Axial, where long-term monitoring observations are supported by the Regional Cabled Array, is providing new understanding of magmatic systems on Earth.
Read MoreA Data Assimilative Reanalysis at the New England Shelf Pioneer Array
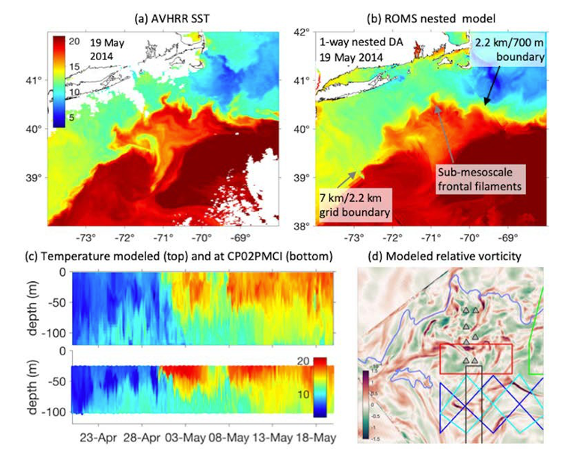
Scientists undertook a four-year retrospective reanalysis of ocean circulation at the Pioneer Coastal Array site. The system captures circulation features that characterize the inhomogeneous, rapidly evolving, and ephemeral submesoscale circulation.
Read MoreShelfbreak Productivity Interdisciplinary Research
The continental shelfbreak of the Mid-Atlantic Bight supports a productive and diverse ecosystem, driven by primary production by phytoplankton. The Coastal Pioneer Array provided unprecedented spatial and temporal resolution of the frontal system, including a four-dimensional context to conduct a detailed study of frontal dynamics and plankton communities.
Read MoreShelf Water Subduction and Cross-Shelf Exchange
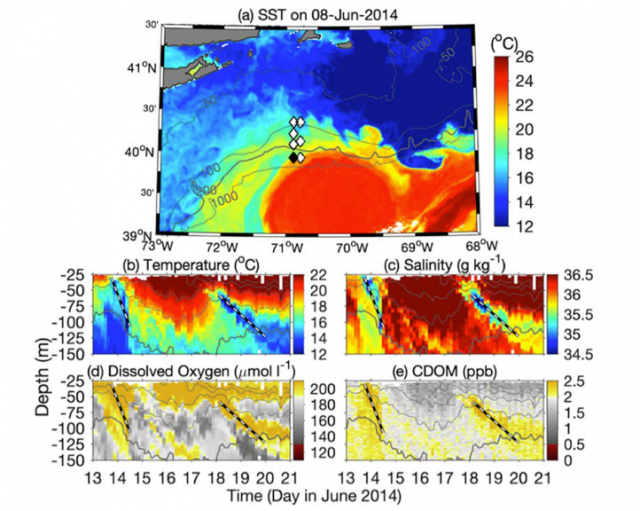
In recent years, the Gulf Stream in the Northwest Atlantic has become increasingly unstable and is shedding more warm core rings in the Slope Sea.The Coastal Pioneer Array at the Mid-Atlantic Bight shelf edge identified a form of offshore transport of water for the first time, supporting an ocean model to study the dynamics of the shelf-water offshore transport.
Read MoreForecasting Hypoxia to Support the Dungeness Crab Fishery
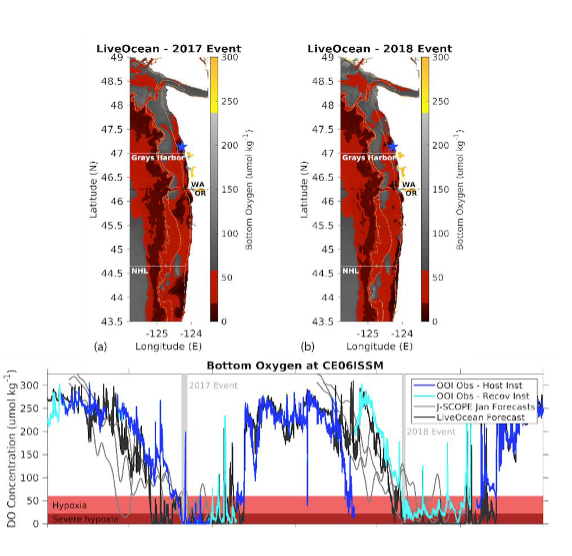
Hypoxia is regularly experienced in Washington and Oregon waters and has been linked to mass mortality events of hypoxia-intolerant species, including the valuable Dungeness crab. The Coastal Endurance Array is aiding the development of a hypoxia forecasting system in this region.
Read MoreIdentifying Impacts of Ocean Acidification and Hypoxia
Ocean acidification has emerged as a leading threat to marine ecosystems, and the fisheries and shellfish growers that depend on a productive and vibrant ocean. The Coastal Endurance Array in the Pacific Northwest array is situated in an epicenter for early impacts from the co-occurrence of ocean acidification and hypoxia.
Read MoreDrivers of Ocean Overturning Circulation Revealed
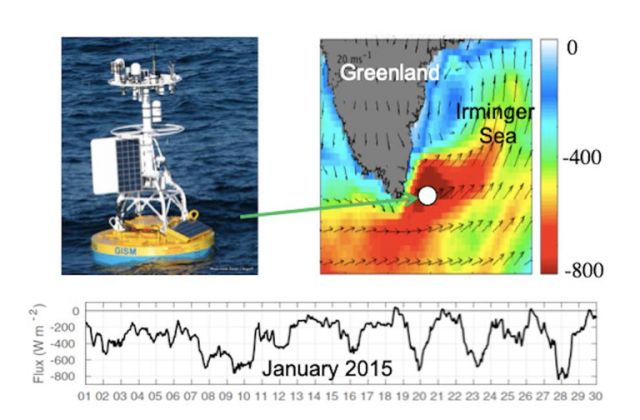
rminger Surface Mooring data were used to identify a new mechanism by which the atmosphere controls ocean heat loss leading to dense water formation. The results are particularly important as the connection between air-sea exchanges and the ocean circulation is still poorly understood, hindering attempts to understand the climate change induced slowdown of the Atlantic circulation.
Read More