Technical Innovations
Axial Seamount Biology Catalog Live
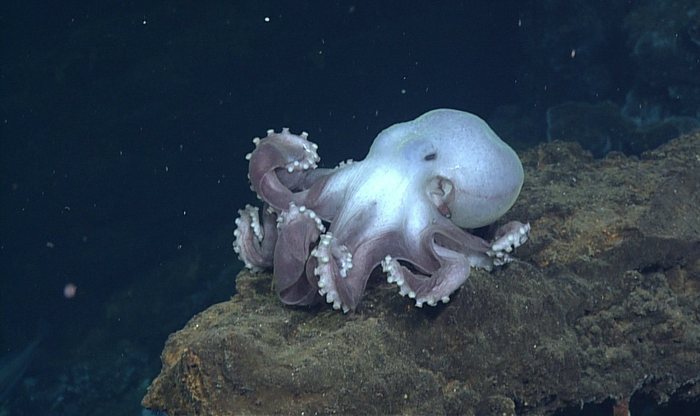
The Axial Seamount Biology Catalog is a collection of stunning video and still imagery obtained during the Construction and Operation and Maintenance phases of the OOI Cabled Array spanning 2011 to 2016. The catalog currently contains 39 unique faunal entries, 63 videos, and 62 images.
Read MoreVIDEO: Pioneer Observatory Investigates the Continental Shelfbreak
Axial Seamount Hydrothermal Vent Time-Lapse Videos
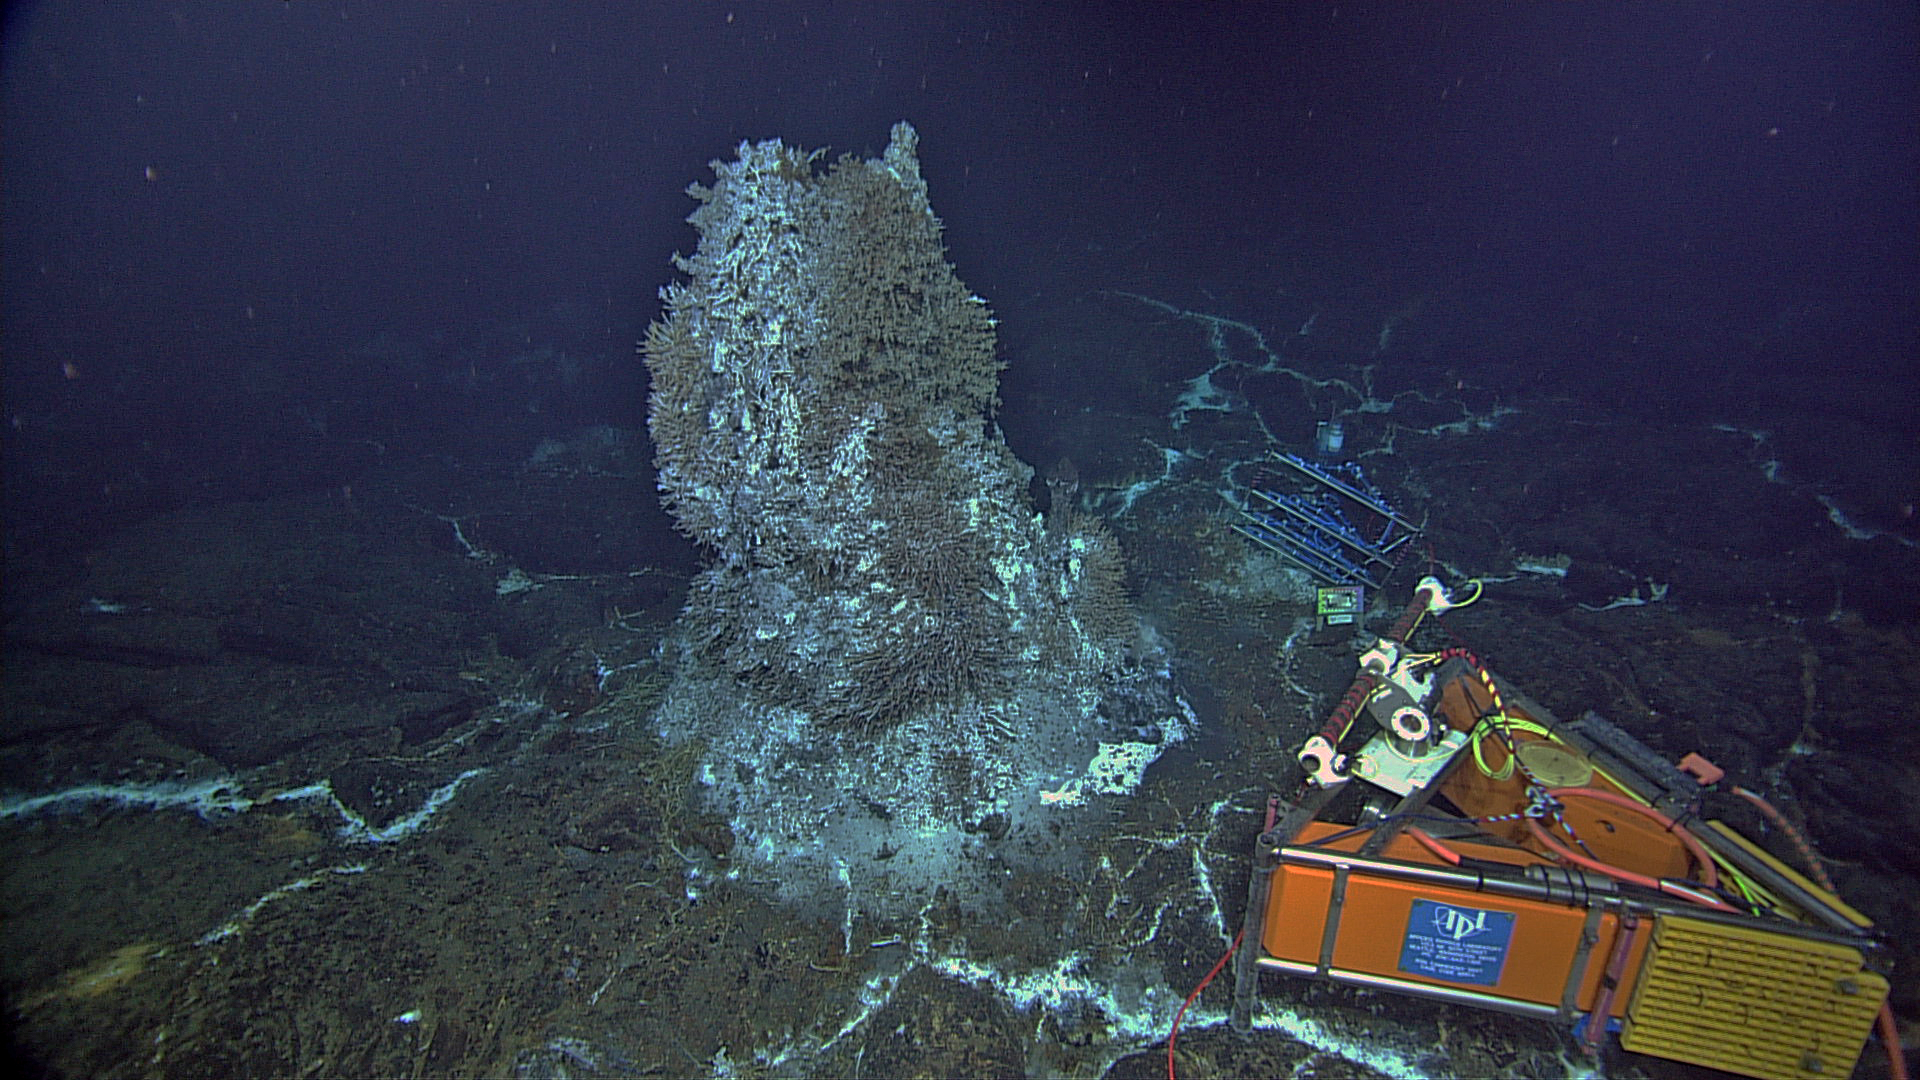
Undergraduate students at Rutgers University have used still frames extracted from the HD Video camera (CAMHD) to compile time-lapse videos of the hydrothermal vent, under the direction of the OOI Data Team. There are 7 biological scenes of interest, captured during the pan/zoom routine of each video. The students are helping produce metadata by time-stamping each scene of interest in every video file on the archive. The students then ran code provided by the OOI Data Team to produce time-lapse videos and watch the vent change over time at each of the scenes of interest. More videos and additional post-processing techniques will be added over time, using open-access tools.
Scene 1
Scene 3
Scene 5
Scene 6
Scene 7
Scene 8
Successful SME Evaluation – Spectrophotometer (OPTAA)
Because of the great diversity of the sensor types deployed by the OOI, it is understood that the familiarity and knowledge of the OOI program scientists and the data team members may not be sufficient to fully investigate and evaluate all types of data being collected. In order to validate the data from these instruments, we reached out to the experts in the field, or as we like to call them “SMEs” (Subject Matter Experts).
For this task, the OOI team asked the SMEs to take a segment of raw data from a specific instrument, and to apply their knowledge and processing tools together with the requisite calibration, sampling, and metadata to produce a calibrated, engineering units version of the data and assess its validity. Assessing validity means answering whether or not the instrument is working properly and yielding data that is realistic. It also means examining whether or not the sampling protocol implemented for the deployment is appropriate to achieve the scientific goals of deploying that instrument.
One of the instruments examined was the WET Labs AC-S Spectrophotometer deployed on the Endurance Array Washington Offshore Surface Mooring on the west coast. Our SME for this instrument was Emmanuel Boss (University of Maine), an expert in the use of optical instrumentation to study the properties of material suspended in seawater.
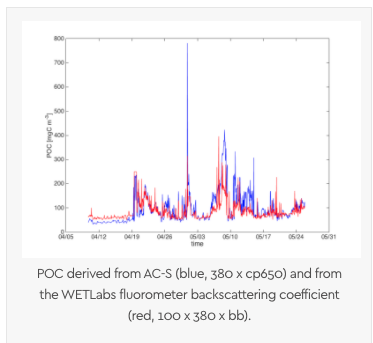
With the data team’s help, Dr. Boss verified 1.5 months of data (April-May 2015) at this site with successful results. He was able to process and plot the data using the raw data and vendor calibration files from the AC-S, salinity and temperature from a collocated CTD data to correct absorption and attenuation median spectra and scattering, and data from a collocated fluorometer to cross-check the chlorophyll and POC results.
Consistency between the sensors suggests that they did not foul during the deployment. Not only did his results show that accurate data was being produced by all the sensors in question, but the AC-S (an extremely sensitive instrument normally deployed for very short periods of time) did not drift noticeably during the deployment period, a notable achievement.
[twocol_one] [caption id="attachment_10536" align="alignnone" width="500"]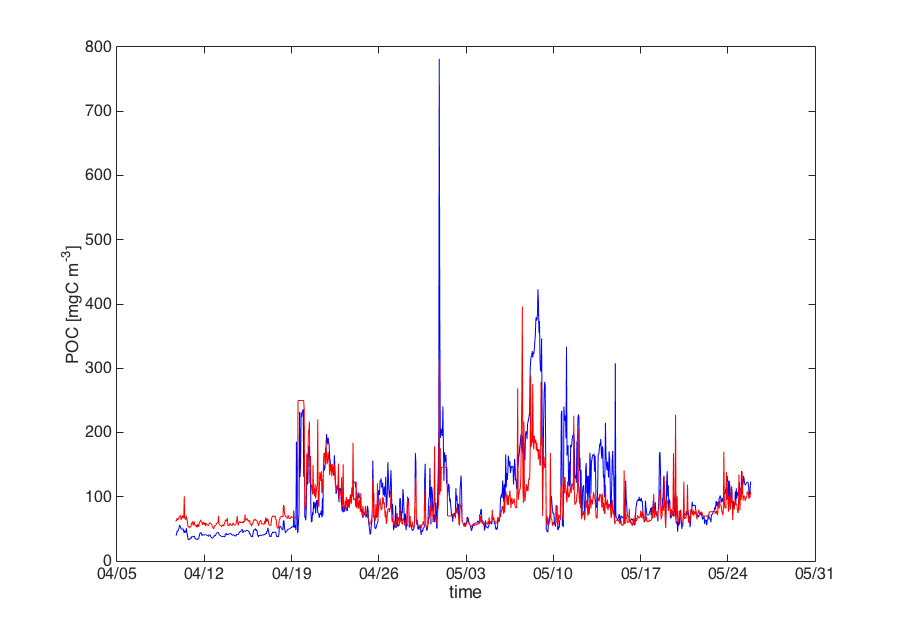 POC derived from AC-S (blue, 380 x cp650) and from the WETLabs fluorometer backscattering coefficient (red, 100 x 380 x bb).[/caption]
[/twocol_one] [twocol_one_last]
[caption id="attachment_10535" align="alignleft" width="500"]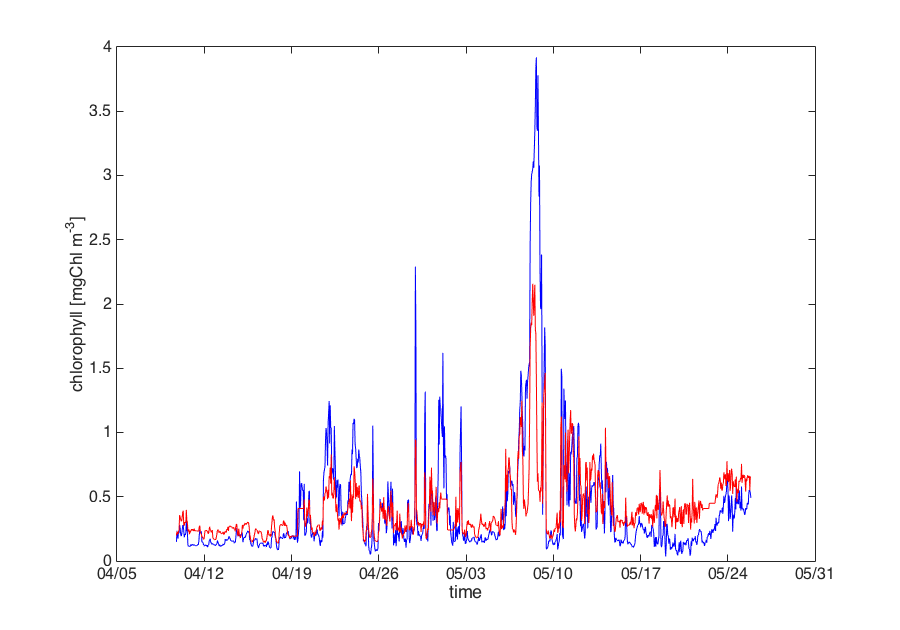 Chlorophyll based on AC-S (blue) and on a collocated WETLabs fluorometer (red, calibration x 0.5).[/caption]
[/twocol_one_last]
Dr. Boss stated “The fact that we can do this closure exercise gives me confidence that we should be able to see when fouling or drift become an issue.” He did caution that this analysis represented a very small data set at one location at a specific time, under limited ambient temperature and trophic conditions. “While very encouraging, much more work will need to be done to establish how representative it is,” he noted.
The data team is working on using these results to compare with the processed data being delivered by the OOI software, and are continuing to pursue similar efforts for additional instruments with the help of our other volunteer SMEs. We look forward to being able to tell similar success stories for other OOI instruments.
Read More
