
Technical Innovations
New Controller Latest in OOI Innovations
Having equipment in the water around the clock for six months at a time provides many challenges for the land-based OOI engineering team charged with keeping the equipment operational so there is a continual flow of data to shore. Maintaining consistent, reliable power for the ocean observing equipment is at the top of this list of challenges.
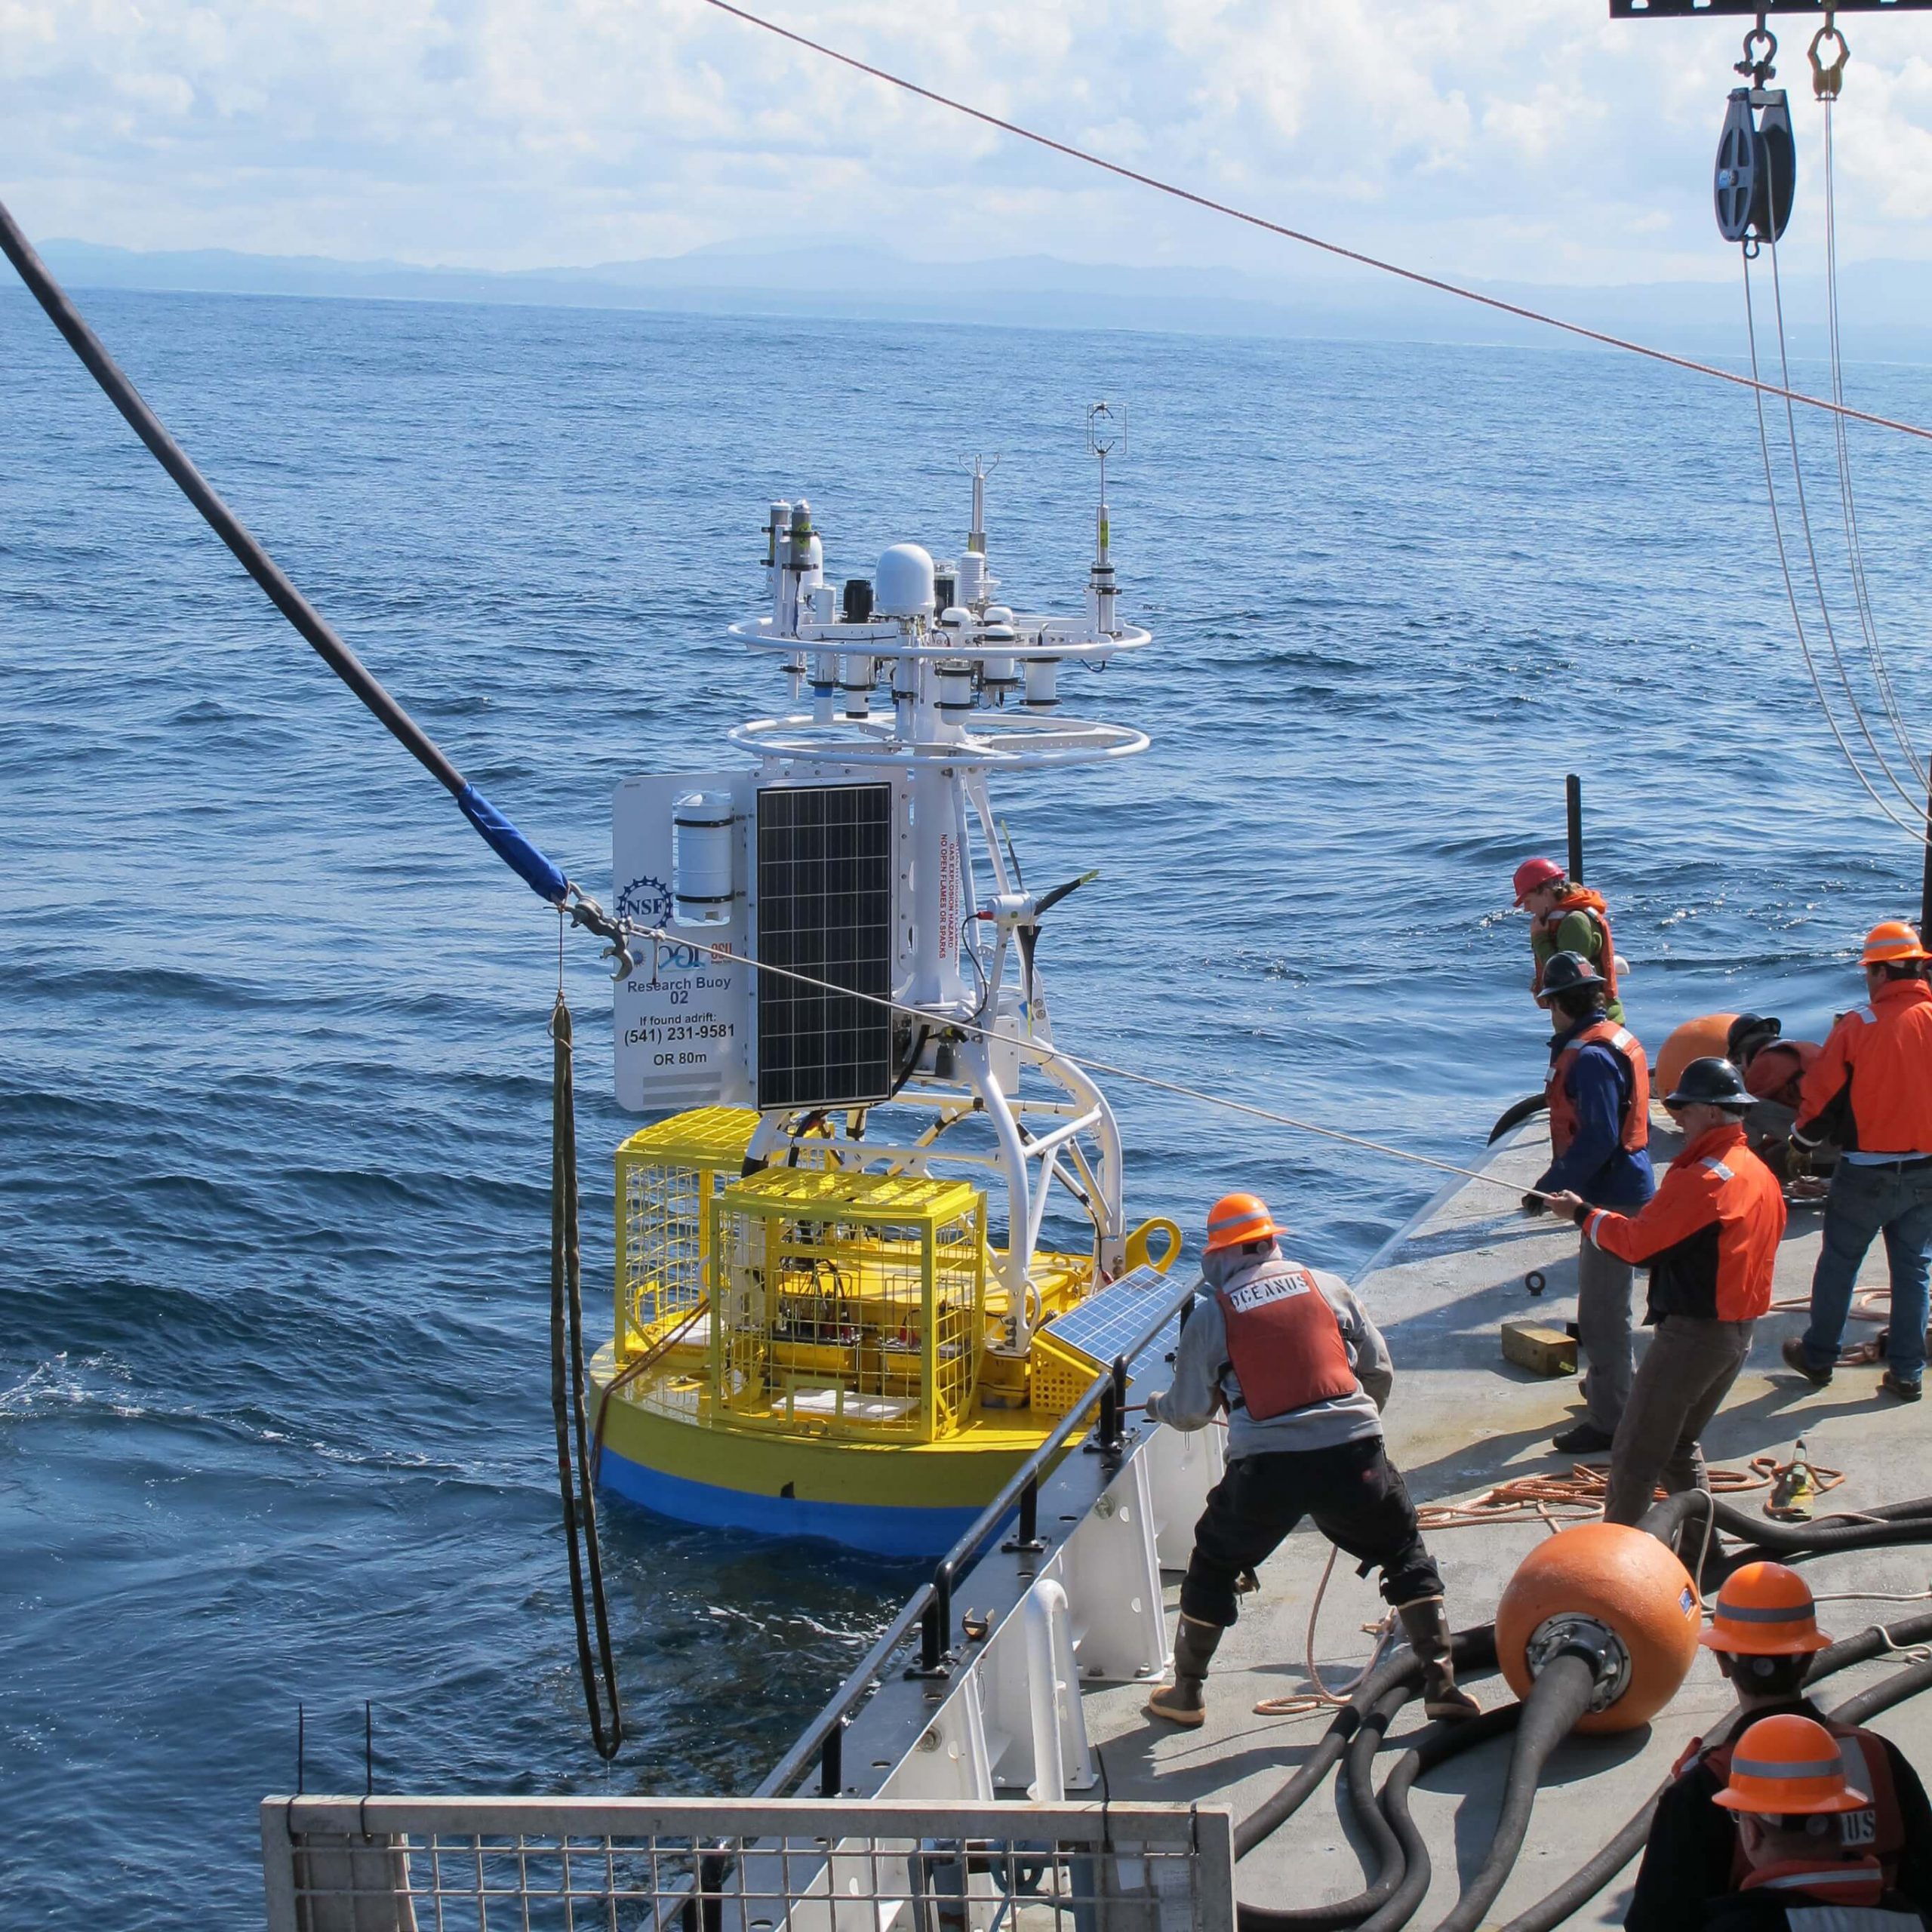
OOI’s data-collecting instruments attached to the moorings run on batteries charged by renewable wind and solar energy. OOI is in the process of replacing the current solar panels with new panels that are more efficient at generating energy, even when shaded. To supplement this upgrade, the OOI arrays are also being outfitted with a brand-new solar controller to manage the energy going into the batteries. Like with the new solar panels, OOI engineers looked for a controller that was available commercially for easier repair and replacement.
“What was important to us was finding a way to use these new solar panels in the best, most optimal way,” said Woods Hole Oceanographic Institution (WHOI) engineer Marshall Swartz. “We looked for a company that would help us specify and build a customized algorithm for a controller that would optimize the functionality of the panels by taking into account battery temperatures.”
[media-caption path="/wp-content/uploads/2021/12/DSC0486-2.jpeg" link="#"]Buoys get quite the workout when they are in the water for six months and more. Powered by wind, solar, and batteries, OOI has recently improved the way energy from the solar panels is managed with new controllers. Credit: ©WHOI, Darlene Trew Crist. [/media-caption]
Some larger, older controllers can consume up to 3-5% of the energy coming into the device, but the new controller is smaller and more efficient, helping to optimize the amount of energy harvested.
Temperature conditions play a big role in how effectively the energy is managed. Changing battery temperatures require the controller to adjust its charge settings to maintain battery life and capacity. The controllers used on OOI moorings sense battery temperature and automatically adjust to assure best conditions to assure reliable operation.
“It’s really essential for us to maintain the proper charge levels for existing temperature conditions,” said Swartz. The OOI buoys encounter a wide range of temperatures: from subfreezing temperatures up to 40°C (over 100°F) when a buoy is sitting in the parking lot before it is deployed. When the buoys are deployed, water temperatures can vary widely from -1 to 33°C (~30 to 91°F), depending on seasonal conditions.
The new controller automatically regulates the amount of electricity going into the battery under such varying temperature conditions. If the wind turbines are generating more energy than the battery needs, for example, the controllers direct excess power into an external load that dissipates heat and adds resistance to the spinning of the wind turbines, preventing the turbines from spinning too fast, possibly damaging their bearings.
“As parts of the OOI infrastructure need replacing or to be upgraded, this offers us the opportunity to find more efficient, and often times, off-the-shelf, less-expensive replacements that will help us keep the arrays functioning and data flowing,” Swartz said. “It’s a winning combination for all parts of the operation.”
Read More
Irminger Sea Array Overcomes Challenging Conditions to Provide Climate Insights
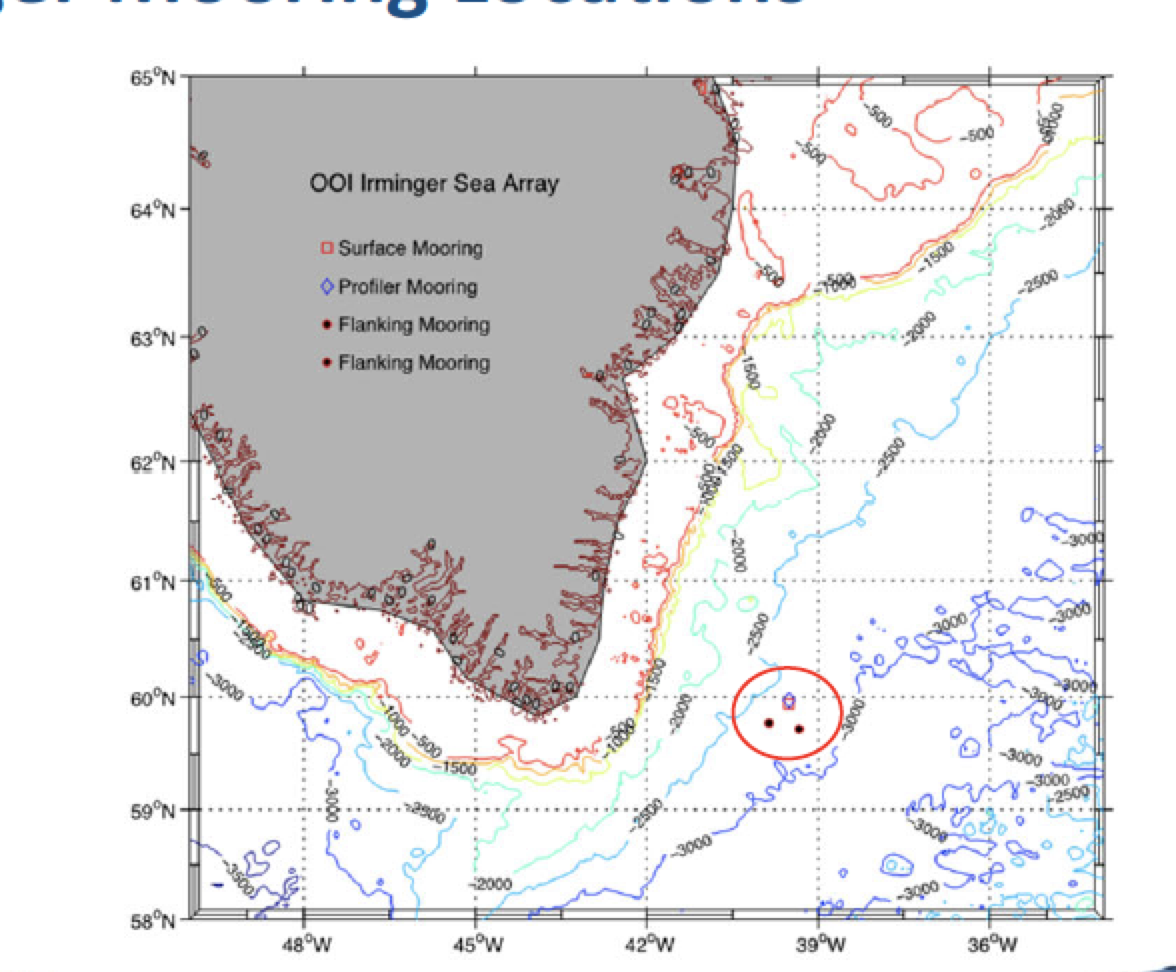
Deployed 140 miles east of the southern tip of Greenland and three miles south of the Arctic Circle, the Irminger Sea surface mooring floats on a cold empty sea named for a Danish naval admiral few people have heard of, in a location that few people could point to on a North Atlantic chart. The Irminger Sea is delineated less by coastlines or geographic basins and more by what is taking place within the deep ocean here, processes only visible with the aid of deep-sea instruments. To oceanographers and climate scientists the region is a confluence of ocean currents where heat carried from the topics gets extracted and cold water sinks into abyss like few other places worldwide and with climate-changing impacts.
Like most high-latitude oceans, storms are frequent and strong. Some storms migrate northeast from the mid-latitudes. Other storms are born here and then mature to impressively violent conditions influenced by the distant high mountains and massive Greenland icecap. Gale-force winds and steep-faced ocean waves spread east over a wide cone from the tip of Cape Farewell. The ice pack around Greenland ejects icebergs, some washing far out to sea where they threaten vessels. Cold air and sea spray build layers of heavy ice on exposed surfaces and instrument sensors. Other oceans can be found with higher waves, some have colder weather, but in few places do storms intensify so quickly, occur as often, and happen in a place so vital to planetary climate. Right where the storm forces are the strongest is also the perfect place for a tower packed with weather instruments.
The Irminger Sea mooring is designed to collect data in this stormy world where meteorological and ocean measurements, especially at the surface, are rare and hard to sustain. The mooring is recovered and a new one put in its place once a year, typically during the short summer month of July when weather conditions are calmest. At more than 4 meters high, the surface mooring tower is heavily instrumented with meteorological sensors and communication antennas, and the surface float is filled with data loggers and redundant computing elements and controllers that collect, store, and transmit data to shore. In total about four tons of floating equipment is anchored to the bottom by a 1.5-mile cable studded with dozens of instruments sampling the deep interior of this sea. To power everything, the buoy float is packed with rechargeable batteries, fueled by solar panels and wind turbines on the buoy tower. Strong winds are usually welcome because they rapidly re-charge the battery packs. Sometimes, however, these can be too much of a good thing.
[media-caption path="/wp-content/uploads/2021/12/Irminger-storm-waves.png" link="#"]Storm waves captured by the Irminger Sea tower camera #5 on 2019-03-19 at 09:01:00 UTC during a typical bad weather day. Observations made by the WAVSS instrument (from 09:00 to 09:20 UTC) report significant wave heights around 5 m (16 ft) and maximum heights of 21 m (69 ft). Records from a second accelerometer (MOPAK) report a wave ~5 m high passing at 09:01 UTC, possibly the same one in this photo. About half-a minute later, at 09:01:30 UTC, the MOPAK recorded a wave >20 m (no image).[/media-caption]
A recent storm during October 18-19, 2021, was one such time. The mooring was battered by wind speeds exceeding 35 knots (gale force) for almost 24 hours, with some topping out above 50 knots. Heavy storm seas built up and stacked upon themselves for hours. At the storm’s peak, about one third of the highest waves were above 15 m (49 ft). Picture heaving an 8000 lb. surface mooring 80 ft up and down on a tilt-a-whirl ride that never stops. Waves this high can bring tons of water crashing down. Towering waves were recorded, some reaching up to 20-25 m (66-82 ft), so high they approached the limits of our instruments.
The Irminger Sea continues to test our ability to “weather harden” instruments in stormy parts of the world. From November to March, daylight is fleeting, the sun hovers near the horizon and solar panels trickle out only a few milliamps. For the next few months, many of the instruments in the ocean interior and on the tower will continue to sample, each instrument powered by its own small battery. The Irminger surface mooring will communicate once each day, a tiny burst of data with vital signs, until spring returns and the sun revives the cold battery packs.
[media-caption path="/wp-content/uploads/2021/12/Ice-near-mooring-.png" link="#"]Ice near the Irminger Sea mooring 2019-04-02. Credit: @WHOI, Peter Brickley.[/media-caption]
The 2021 storm demonstrated, yet again, the challenges of working in the Irminger Sea. Yet, it also demonstrated the remarkable robustness of the OOI moorings in such extreme conditions. Ocean and meteorological measurements gathered by the Irminger Sea mooring during such storm events are extremely valuable for understanding oceanography and climate processes. Equally important is the invaluable experience gained that will drive continued improvement in the accuracy and durability of instruments deployed under such extreme conditions, with consequent increases in knowledge.
Written by Peter J. Brickley, PhD, Senior Engineer, AOPE Dept., Woods Hole Oceanographic Institution and OOI’s Coastal and Global Scale Nodes Observatory Operations Lead
Read More
RCA Recording Swarm of Earthquakes in Real Time

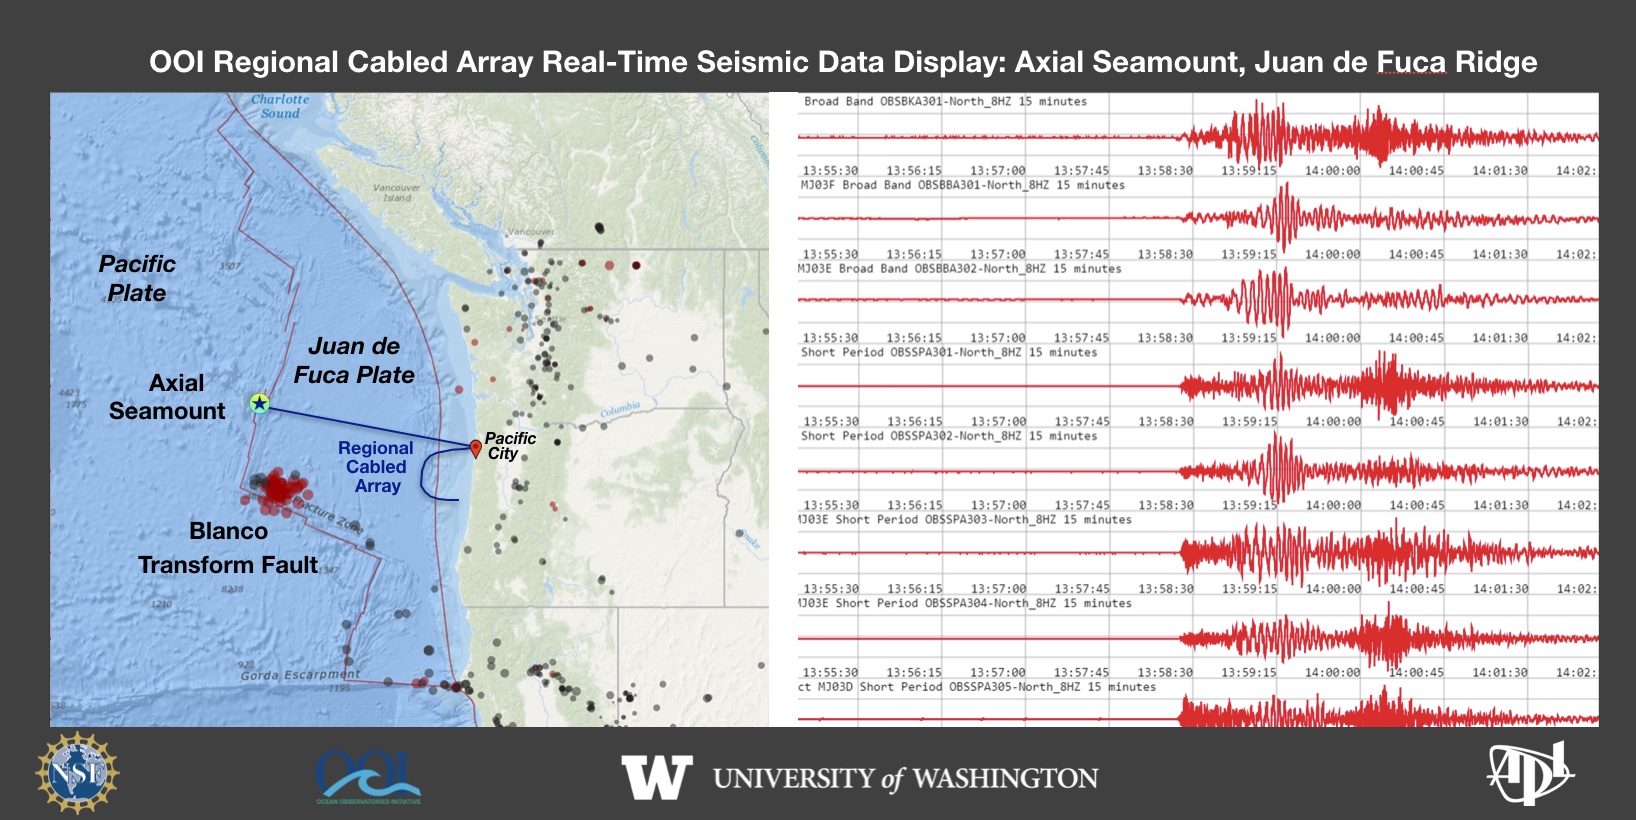 On December 7, 2021 a swarm of earthquakes began on the Blanco Transform Fault, a major plate boundary at the southern end of the Juan de Fuca Plate. The ongoing seismic swarm is being tracked live by the National Science Foundation’s underwater observatory, the Regional Cabled Array (RCA). The RCA is a component of NSF’s Ocean Observatories Initiative and is operated and maintained by the University of Washington. It includes ~900 km of high power and high bandwidth submarine fiber optic cables that stretch from Pacific City, OR out to the most active volcano off the coast “Axial Seamount” that erupted in 1998, 2011 and again in 2015. A second cable heads south along the Cascadia Subduction Zone and turns east along the Cascadia Margin off Newport, OR. Over 150 instruments on the seafloor and on instrumented moorings provide real-time data flow to shore at the speed of light. A suite of seismometers at the summit of Axial Seamount lit up on December 7, 2021 as the seismic swarm began along the Blanco. This live feed was developed by the UW Applied Physics Laboratory.
Read More
Endurance Array to Provide Hourly Meteorological Data
On 11 October 2021, the National Oceanic and Atmospheric Administration (NOAA)requested that OOI’s Coastal Endurance Array buoys provide hourly meteorological data to the National Data Buoy Center (NDBC) because a nearby NDBC buoy (46029, Columbia River bar) had gone offline. OOI buoy data are typically telemetered every two hours due to sampling schedule and bandwidth constraints (the actual sampling rate is higher).
Endurance Array team members examined sampling and telemetry schedules for the Endurance offshore coastal surface moorings to see if they could accommodate NOAA’s request. The team concluded that meteorological data from the moorings could be updated hourly while still meeting OOI sampling requirements.
“To help ensure continuity of data to the NDBC, we plan to distribute hourly meteorological data from the Endurance Array Oregon and Washington offshore sites for the duration of the outage at NBDC 46029,” said Edward Dever, lead of the Coastal Endurance Team. “We’re pleased to respond to NOAA’s request and hope these data prove useful to operational weather forecasts and marine safety.” The Oregon and Washington offshore sites have NDBC buoys designations of 46098 and 46100, respectively.
The Endurance Array team will continue to review the performance of the buoys and ensure the updated telemetry schedule does not impact OOI sampling. If data users do experience any impacts from this change in sampling frequency, please contact Jon Fram at Jonathan.Fram@oregonstate.edu.
Read MoreJupyter Notebook Produces Quality Flags for pH Data
OOI uses the SAMI2-pH sensor from Sunburst Sensors, LLC to measure seawater pH throughout the different arrays. Assessing the data quality from this instrument is an involved process as there are multiple parameters produced by the instrument that are then used to calculate the seawater pH. These measurements are subject to different sources of error, and those errors can propagate through the calculations to create an erroneous seawater pH value. Based upon the vendor documentation and MATLAB code Sunburst provides to convert the raw measurements, OOI data team members have created a set of rules from those different measurements to flag the pH data as either pass, suspect or fail.
The resulting flags can be used to remove failed data from further analysis. They can also be used to help generate annotations for further Human in the Loop (HITL) QC checks of the data to help refine quality metrics for the data. OOI team member, Chris Wingard (OSU), has written up the QC process as a Python Jupyter notebook. This notebook and other example notebooks are freely available to the scientific community via the OOI GitHub site (within the OOI Data Team Python toolbox accessed from https://oceanobservatories.org/community-tools/ ).
In this notebook, Wingard shows how the quality rules can be used to remove bad pH data from a time series, and how they can be used to then create annotations. The impact of using these flags is shown with a set of before and after plots of the seawater pH as a function of temperature. The quality controlled data can then be used to estimate the seasonal cycle of pH to set climatological quality control flags.
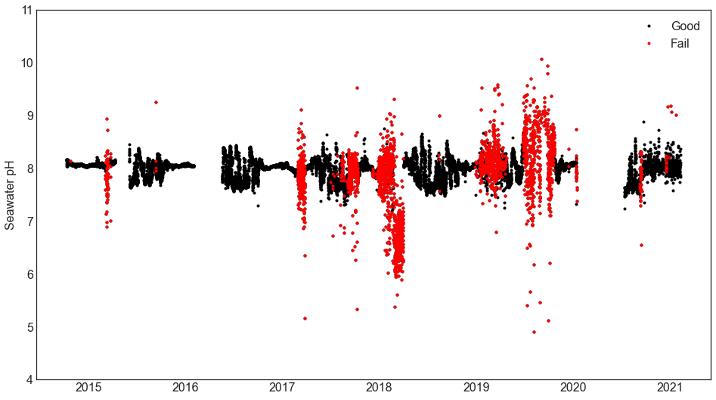
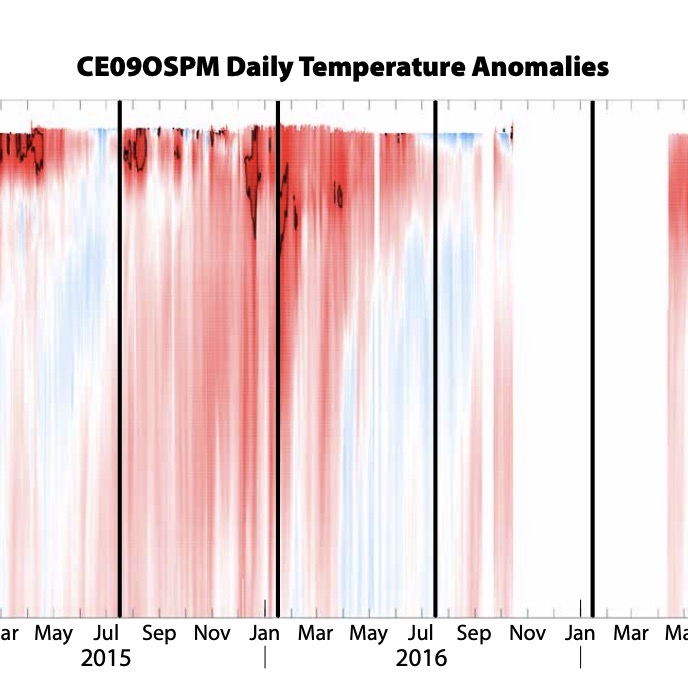
Here an example is shown using data from a pH sensor on the Oregon Inshore Surface Mooring (CE01ISSM) near surface instrument frame (NSIF), deployed at 7 m depth (site depth is 25 m).
[media-caption path="https://oceanobservatories.org/wp-content/uploads/2021/07/EA-Highlight.png" link="#"]Figure 25: pH data from the Oregon Inshore Surface Mooring (CE01ISSM) near surface instrument frame (NSIF). Good data are shown in black, failed data in red. Note that simple range tests on the final calculated pH are often not enough to distinguish good from failed data. The automated QC processing examines intermediate measurements and fails data if intermediate measurements are outside acceptable ranges and propagated to final measurements.[/media-caption] [media-caption path="https://oceanobservatories.org/wp-content/uploads/2021/07/EA-highlight-2.png" link="#"]Figure 26: Good data together with annual cycles (red) constructed with available good data from initial deployment through 2021. Data which falls outside three standard deviations of the climatology is flagged as suspect. The climatological tests are used to flag suspect data. Simple range tests for suspect (cyan) and failed (magenta) data are also shown. The annual cycle at this site is strongly influenced by annual summer upwelling and winter storms and river plumes. The summer decrease in pH is consistent with cold, relatively acidic upwelled water high in CO2 (see e.g., Evans et al., 2011)[/media-caption]
Evans, W., B. Hales, and P. G. Strutton (2011), Seasonal cycle of surface ocean pCO2on the Oregon shelf,J. Geophys. Res., 116, C05012, doi:10.1029/2010JC006625.
Read MoreSeismic Hazards Around the Globe: A Visualization Tool to Bring RCA Data into the Classroom
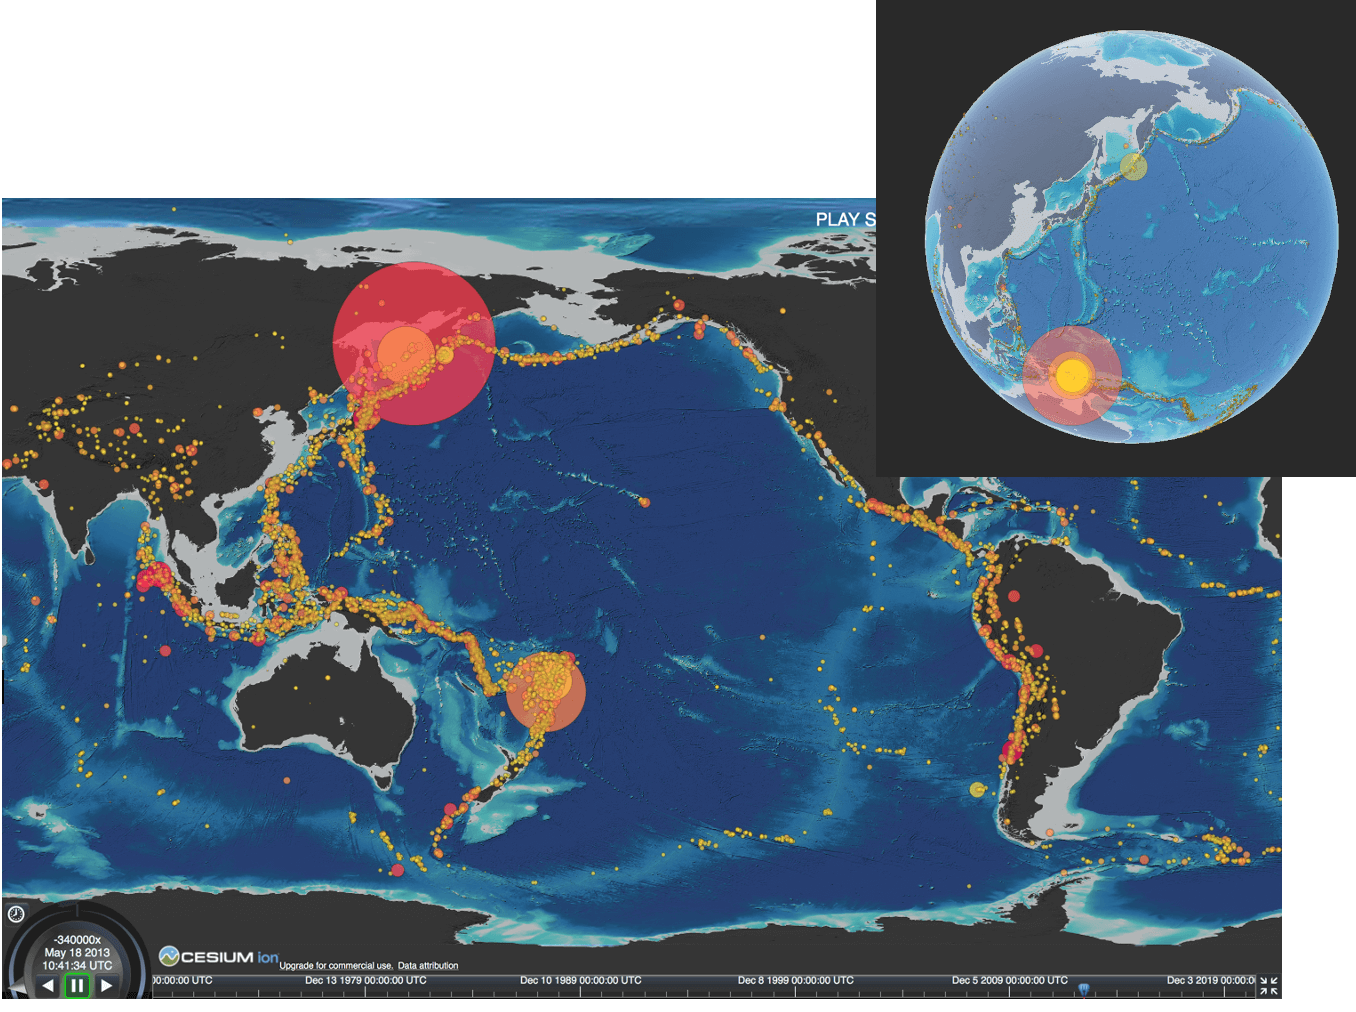
As part of the continuing University of Washington engagement effort, and in preparation for the new National Science Foundation K12 education award focused on bringing OOI data into the classroom, Kelley collaborated with the Center for Environmental Visualization within the School of Oceanography to generate an earthquake exploration tool focused on seismic events within the global oceans from 1970 to present. We anticipate that one of the curriculum modules developed for the K12 program will be focused on geohazards, with an emphasis on the Cascadia Subduction Zone within the context of the “ring of fire.” A video of this animation is hosted on interactive oceans and a direct link to the developmental site is provided above. The animation will be used in a Queens College physical geology class this next year that has 150 students (Dr. Dax Soule). This effort is also in preparation for completing a similar visualization focused on Axial Seamount and Regional Cabled Array seismic data.
The data sets used for this effort include a map centered on the Pacific Ocean that shows the distribution of earthquakes of magnitude ≥6 in the U.S. Geological Survey catalog from 1970 through 2021. The topographic dataset is licensed under Creative Commons CC BY-4.0. The data were formatted to match the JSON format recommended for use of global visualization using the ‘Cesium’ interactive virtual earth viewer promoted within its 3D geospatial visualization for the web toolset. The Cesium JavaScript API was utilized to implement algorithms for procedural color determination based on magnitude and hypocenter point radius animation based on the date-time of the earthquake event. The resultant animation is highly interactive, allowing the user to choose a 3D global view or a flat view, and viewing speeds of 1-8 times. In addition, the field of view can be changed to move to a specific area of interest and includes zoom capabilities. A sliding time bar allows the user to focus in on particular items of interest.
Read More
Shade and Poop at Sea: Increasing Solar Panel Efficiency
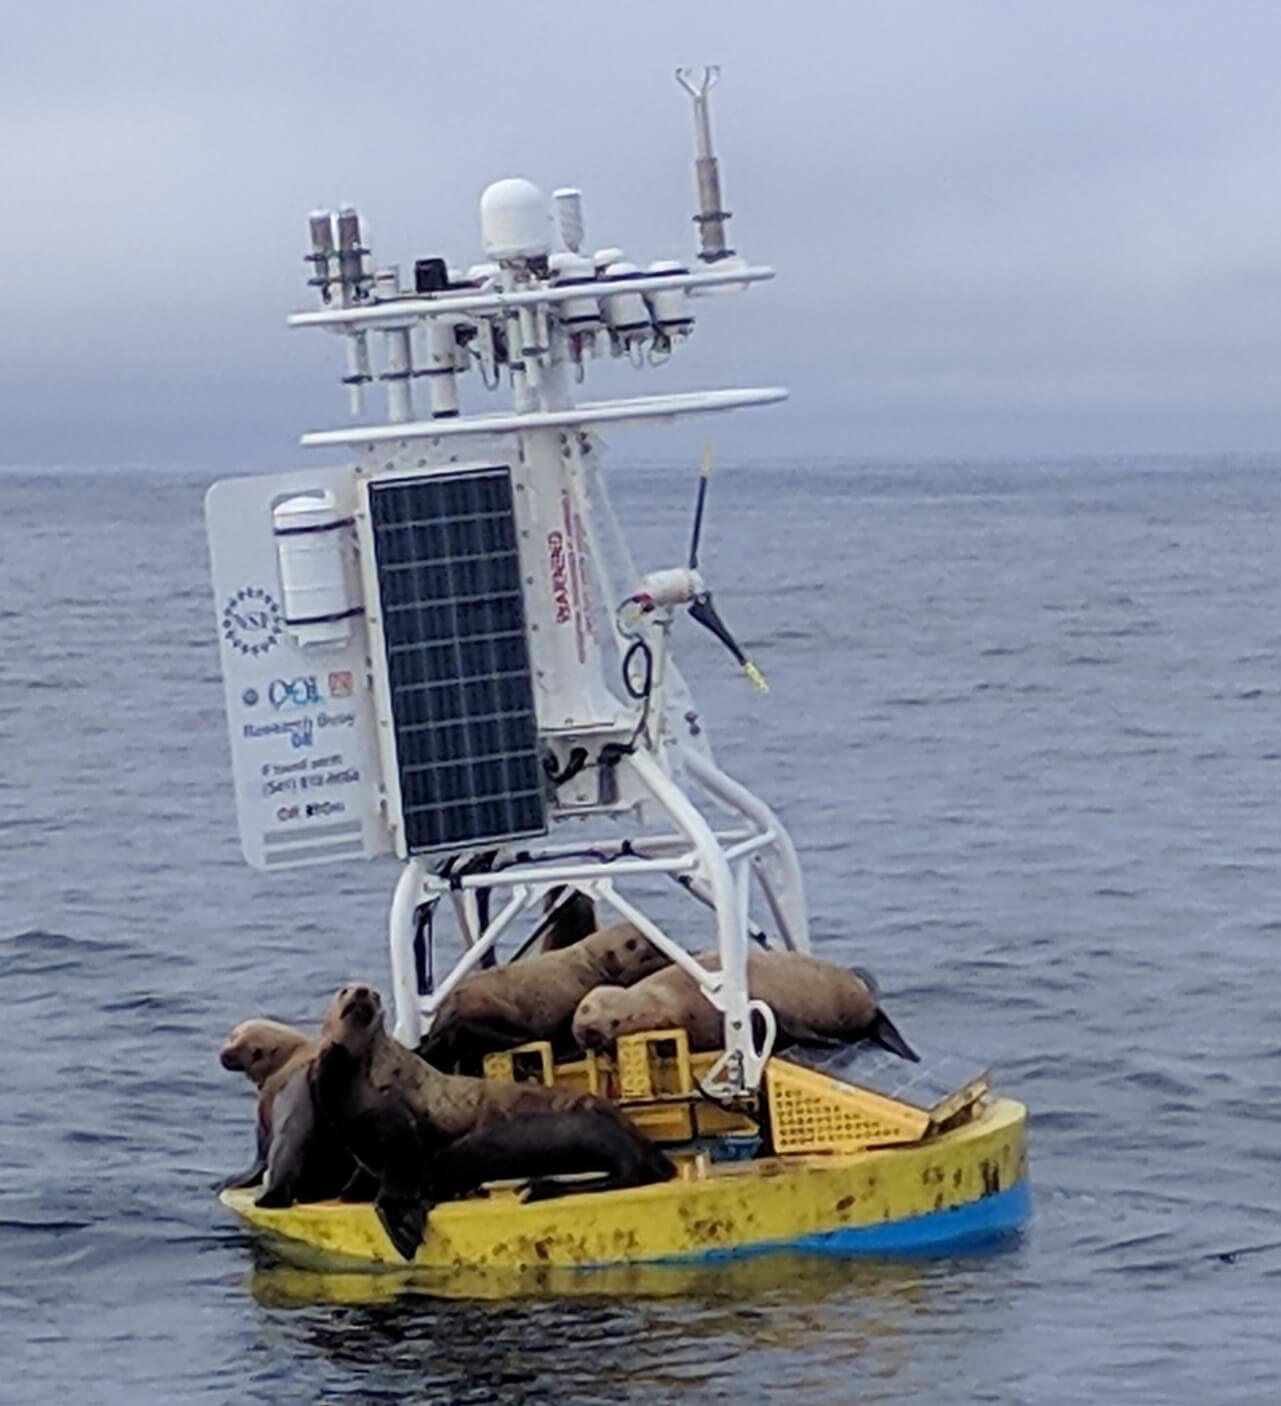
Sea lions intermittently visit the Coastal Endurance Array moorings off the coast of Oregon, where they lounge, bask in the sun, and “do their business.” These visits create two problems for the optimum functioning of the instrumented arrays. Because sea lions are heavy, some weighing up to 2,500 pounds, the solar panels upon which they rest need to be strong enough to bear this weight. And, excrement left behind by these itinerant visitors smears and shades the solar panels, making less power available for the ocean observing instrument attached to the arrays.
This intermittent excrement-related shading compounds an existing shading problem caused by the perpetual movement of the moorings. The halos at the top of the moorings cast shadows over the panels below, resulting in a significant power loss. If ten percent of a solar panel is covered in shadow, for example, its output can drop by as much as 70 percent. When sea lions take refuge on the solar panels this loss is exacerbated. Their excrement, at times, can cover up to 30 percent of the panels, virtually wiping out the power generating capability of the panels. Luckily, this coverage results in only a temporary power shortage as wind and seawater ultimately wash away the remains of these visits.
OOI Engineers John Reine and Marshall Swartz of OOI’s Engineering Team put their heads together to tackle these problems. They first addressed the shading issue.
“These moorings are never still,” explained John Reine, Senior Engineer and lead of OOI’s Electrical Refurbishment Team. “In response to wave and wind-driven motion, the masts are always going back and forth, about three times per minute, casting shadows as they move. So this constant movement of shade, no shade, shade, no shade, produces a sort of alternating current from the panels. I went to Marshall and asked how do we fix this?” (John Reine explains the problems and fixes in the video below).
[embed]https://youtu.be/1d6QQJfHqik[/embed]Solar panels are made up of lots of little solar cells, normally connected to each other so the power flows seamlessly from cell to cell. The Engineering Team recognized that by modifying the panel’s internal circuitry, it could easily harvest more of the available light. They proposed a solution to triple the number of bypass diodes, switches that would ignore shaded cells and move the power to the next operational cell in this field of cells. The manufacturer built a prototype based on an high efficiency cell design, inserting additional diodes, and tested the upgraded array. Tests at the manufacturer’s verification facility and at WHOI showed the modified design exceeded expectations.
Timing was opportune. The original solar panels had exceeded their design lifetime and needed to be replaced, but were no longer in production. The team seized on this opportunity to seek out panels incorporating more efficient cells, wired into a circuit proven to minimize shading energy losses, while also bearing the weight of the itinerant visitors.
The task fell to Swartz to find a solar manufacturer able to incorporate the bypass diodes into the panel design. He worked under the proviso that OOI prefers to buy things off the shelf so as to make repair and replacement easy, affordable, and virtually seamless, when needed.
“Such off-the-shelf solutions have worked out well for us,” said Swartz. “As it turned out, we found a supplier, SBM Solar, in North Carolina that does a lot of work with the military, including high-efficiency solar panels. Working with the president and chief engineer of the company, who was very willing to help us customize a product, we came up with a design having a string of 36 cells in the panel. We specified circuitry with bypass diodes so that when any group of four cells gets shaded, they are bypassed and the rest of the cells in the panel can continue to provide unrestricted power to the buoy.
“Just by making this small change, we significantly improved the total energy harvest in a simulated condition by 50 percent, “ Swartz added. What this means in practical terms is that the solar panels can now harvest useful power from almost any light condition –whether it is the reflected light off the surface of the water, low incidence light at sunset, and light that is filtered through the clouds during an early gray day.
Jokingly, he added, “ These panels basically follow the principle of ‘whenever I have the opportunity to make electricity, I’m going to do it’.”
The new panels also passed the weight-bearing problem for the array’s visitors. While the old panels were glass and subject to occasional cracking, the new panels are an aluminum polyester Teflon sandwich, with the solar cells in between the top and bottom layers. This new configuration is much lighter (27 pounds vs 45 pounds for the glass panels), more rugged, and more resilient to the ever-changing at-sea conditions than the glass version it is replacing.
The new panels are also flexible, rather than rigid like glass, which created another challenge to for the Engineering Team. They designed a special back for the panel with struts to provide greater support and more weight distribution as the 2,500-pound visitors flop onto the arrays. The lighter weight of the panels is giving the team more flexibility in placement of the panels on the moorings.
Said Reine, “We are so pleased to have these new and improved “off-the-shelf” solar panels operational. Two panels are now in place on Pioneer Array moorings, and another eight panels have been shipped to the Endurance Array, where they will be greeted by their 2,500-pound interlopers.”
[embed]http://https://youtu.be/1d6QQJfHqik[/embed] Read More
Protocol for the Assessment and Correction of Surface Water and Air pCO2 Measurements

As part of the Endurance Array, surface buoy partial pressure CO2 (pCO2) measurements are made using the Pro-Oceanus CO2-Pro Atmosphere pCO2 sensor. This sensor measures the partial pressure of CO2 gas in both surface water and air, allowing for surface flux calculations. Both the air and water measurements, and the flux estimates, are available through the OOI Data Portal.
Wingard et al. (2020) reported on the surface water and air pCO2 data returned for the first four years of Endurance Array operations and described a protocol based on cross-comparisons to independent, shipboard (both CTD samples and underway flow-thru systems) pCO2 measurements, data available from the Lamont-Doherty Earth Observatory (LDEO) V2018 pCO2 database (Takahashi et al., 2019), data from the NOAA Earth System Research Laboratory (ESRL) Global Monitoring Division (GMD) Carbon Cycle Greenhouse Gases (CCGG) data repositories (NOAA ESRL Global Monitoring Division, 2016), and a high-resolution monthly pCO2 climatology for the coastal ocean (Laruelle et al., 2017).
Use of independent sources of pCO2 data, such as the discrete sample data and the LDEO V2018 database, are critical to validating the surface water pCO2 measurements. The overlapping deployment structure employed by OOI (newly refurbished and calibrated instruments deployed next to older instruments) provides an additional means to validate the surface water and air pCO2 measurements (see Fig xx).
The comparison shows overall quality of the surface water pCO2 measurements collected by the OOI Endurance Array is very high. Beyond a simple smoothing filter and application of human in the loop flags, no further corrections are required to the data. OOI Endurance Array data provide a novel source of high-resolution (hourly), near-continuous surface water pCO2 measurements in the coastal regions off the Oregon and Washington coasts. While there are multiple gaps in the air pCO2 measurements (greater than 33% of the total record), the potential exists for the creation of a common, combined daily averaged air pCO2 record that could help to address these gaps.
This assessment gives confidence to the data on the portal as well as the export of OOI Endurance Array data via the NANOOS Visualization System and the Global Ocean Acidification Observing System Data Portal (GOA-ON).
Read More
Coastal and Global profiler mooring analysis MATLAB-based tools
https://bitbucket.org/ooicgsn/mmp_toolbox/src/master/, 8 May 2020
The McLane Moored Profiler is used on the Global profiler moorings, Pioneer and Endurance coastal profiler moorings, and, as a modified McLane Profiler, on the Regional Cabled Cable Array deep profiler moorings. Its water column measurements contribute to the OOI science goals of Climate Variability, Ocean Circulation, and Ecosystems; Turbulent Mixing and Biophysical Interactions; and Coastal Ocean Dynamics and Ecosystems. For example, Barth et al., 2018 used the Endurance Washington offshore profiler moorings to characterize the subsurface temperature response to the recent warm blob event (Figure to right).
While profiler mooring data are available via the OOI Data Portal, the Data Portal does not provide a tool to easily analyze and visualize profiler data. In response to this need and to user requests for profiler analysis tools, Endurance Array staff have developed a MATLAB-based toolbox called radMMP. This toolbox allows users to easily import and visualize a WFP data set. It has been thoroughly tested with Endurance and Pioneer profiler mooring data and has been uploaded to the publicly available CGSN Bitbucket website (https://bitbucket.org/ooicgsn/mmp_toolbox/src/master/) along with comprehensive tutorial information. Using this toolbox, the Endurance Array data team has completed annotations for all Endurance Array profiler mooring since the initial deployment. While the toolbox was initially developed for the coastal profiler mooring, it is being extended to the global profiler mooring and should be adaptable to the Regional Cabled Array deep profiler moorings.
Read MoreNew Computer Vision Routine Developed for CAMHD Time-Lapse Video
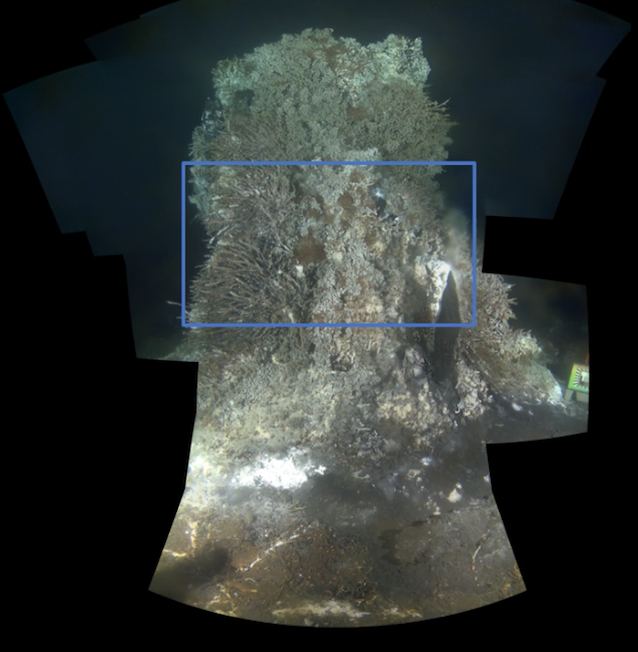
A new computer vision routine, developed by Aaron Marburg at UW-APL and aided by Tim Crone at LDEO and Friedrich Knuth at Rutgers, is now able to correctly identify and tag scenes of scientific interest in the CAMHD video stream. These scenes were previously being manually identified by students at Rutgers University, a process which has been greatly accelerated by the team’s work. With this enhanced metadata record, a brand new set of time lapse videos has been created, displaying a frame captured every three hours from November, 2015 to July, 2016. There are 9 scenes of scientific interest, which are recorded at two or three zoom levels, depending on the camera routine. The naming convention for the videos is deployment_(dx) position_(px) zoom-level_(zx). For more information on the different scene tags, see the regions description on GitHub.
Position: 0
[threecol_one]Zoom Level: 0
[/threecol_one]
[threecol_one]
Zoom Level: 1
[/threecol_one]
[threecol_one_last]
Zoom Level: 2
[/threecol_one_last]
Position: 1
[threecol_one]
Zoom Level: 0
[/threecol_one]
[threecol_one_last]
Zoom Level: 1
[/threecol_one_last]
Position: 2
[threecol_one]
Zoom Level: 0
[/threecol_one]
[threecol_one_last]
Zoom Level: 1
[/threecol_one_last]
Position: 3
[threecol_one]
Zoom Level: 0
[/threecol_one]
[threecol_one]
Zoom Level: 1
[/threecol_one]
[threecol_one_last]
Zoom Level: 2
[/threecol_one_last]
Position: 4
[threecol_one]
Zoom Level: 0
[/threecol_one]
[threecol_one]
Zoom Level: 1
[/threecol_one]
[threecol_one_last]
Zoom Level: 2
[/threecol_one_last]
Position: 5
[threecol_one]
Zoom Level: 0
[/threecol_one]
[threecol_one]
Zoom Level: 1
[/threecol_one]
[threecol_one_last]
Zoom Level: 2
[/threecol_one_last]
Position: 6
[threecol_one]
Zoom Level: 0
[/threecol_one]
[threecol_one]
Zoom Level: 1
[/threecol_one]
[threecol_one_last]
Zoom Level: 2
[/threecol_one_last]
Position: 7
[threecol_one]
Zoom Level: 0
[/threecol_one]
[threecol_one_last]
Zoom Level: 1
[/threecol_one_last]
Position: 8
[threecol_one]
Zoom Level: 0
[/threecol_one]
[threecol_one_last]
Zoom Level: 1
[/threecol_one_last]
Resources
Raw Data Archive – Access to raw video data files in .mp4 and .mov format
Live Video Feed – Live video from Axial Seamount, every 3 hours for 15 minutes
CamHDAnalysis – Computer vision routine used to create metadata and time lapse videos
CamHD Compute Engine – Open access processing platform to use and develop CAMHD processing code
Download Time-Lapse Videos – Shared drive that permits download of the time-lapse videos displayed above
References
Crone, T.J., Marburg A., Knuth F. A, Using the OOI Cabled Array HD Camera to Explore Geophysical and Oceanographic Problems at Axial Seamount, presented at the 2016 Fall Meeting, AGU, San Francisco, CA
Knuth, F. A., Marburg, A., Crone, T. J. (2017) Deriving Quantitative Metrics from OOI High-Definition Video Data for the Purpose of Automated QA/QC, Oceans 2017 MTS/IEEE, Anchorage, AK, September 18-21
Knuth, F.A., Marburg, A., Belabassi L., Garzio, L., Smith, M., Vardaro, M. (2016) Automated QA/QC and Time Series Analysis on OOI High-Definition Video Data. Oceans 2016 MTS/IEEE Proceedings.
Marburg, A., Knuth, F. A., Crone, T. J. (2017) Cloud-Accelerated Analysis of Subsea High-Definition Camera Data, Oceans 2017 MTS/IEEE, Anchorage, AK, September 18-21
Funding
National Science Foundation, Cloud-Capable Tools for MG&G- Related Image Analysis of OOI HD Camera Video, Award #1700923
For additional information please contact: help@oceanobservatories.org
Read More