
Posts Tagged ‘Axial Seamount’
Axial On-line Workshop
Workshop Focus: Sharing recent results of research conducted at Axial Seamount
Convenors: Bill Chadwick, Oregon State University, William Wilcock, University of Washington,
and Graham Kent, University of Nevada, Reno.
Contact amber.coogan@whoi.edu for Zoom link.
Each presentation time-slot is 15 min (10-min for a talk, followed by 5-min for discussion)
AGENDA OF PRESENTATIONS
DAY 1 – Tuesday, October 7, Times are US west-coast time (UTC-7hrs)
07:00 – Welcome, Introduction, House-keeping info – Bill Chadwick (Oregon State Univ.)
07:05 – Current state of the OOI-Regional Cabled Array at Axial – Deb Kelley (Univ. of
Washington)
07:20 – Real-time monitoring of earthquakes in space & time at Axial – Felix Waldhauser
(Lamont-Doherty Earth Observatory, Columbia Univ.)
07:35 – Results from the 2022-2024 OBS experiment at Axial – Kaiwen Wang (LDEO and
Chinese Academy of Sciences, Beijing) and Meritxell Colet (LDEO, Columbia Univ.)
07:50 – Impulsive lava flow seismic events and precursory volcanic tremor associated
with the 2015 eruption – Yen Joe Tan (The Chinese Univ. of Hong Kong)
08:05 – Automated focal mechanisms for earthquakes at Axial – Maochuan Zhang (Univ. of
Washington)
08:20 – Inflation since the 2015 eruption and relation to seismicity and eruption
forecasting – Bill Chadwick (Oregon State Univ.)
08:35 – A physics-based failure model for forecasting volcanic eruptions – Qinghua Lei
(Uppsala University, Sweden)
08:50 – Inflation from repeat AUV multibeam sonar mapping & deformation modeling –
Scott Nooner (Univ. of North Carolina, Wilmington)
09:05 – 10 minute BREAK
09:15 – Assessing the use of a cabled bottom pressure recorder as a new reference site
for mobile pressure recorder surveys at Axial Seamount – Camille Sullivan (Univ. of
North Carolina, Wilmington)
09:30 – Modeling dike intrusion at the beginning of the 2015 eruption – Kendal Ward (Univ.
of North Carolina, Wilmington)
09:45 – Insights on the recent inflation of Axial Seamount from horizontal geodesy –
Maleen Kidiwela (Univ. of Washington)
10:00 – Petrologic constraints on magma storage and pathways – Dave Clague (Monterey
Bay Aquarium Research Institute, MBARI)
10:15 – Evidence for the ~1200 yrs BP age of the most recent caldera collapse at Axial –
Dave Clague (Monterey Bay Aquarium Research Institute, MBARI)
10:30 – Tephra deposits on Axial’s caldera rim, in relation to the most recent caldera
collapse event – Ryan Portner (San Jose State Univ. / Univ. of Bergen, Norway)
10:45 – Lightning talk (5-min): Using oxygen isotopes in olivine to trace magma
assimilation – Juliette Pin (University of Nevada, Reno)
10:50 – TIME SLOT FOR DISCUSSION (10 min)
11:00 – END OF DAY 1
AGENDA OF PRESENTATIONS
DAY 2 – Wednesday, October 8, Times are US west-coast time (UTC-7hrs)
07:00 – Welcome, Introduction, House-keeping info – Bill Chadwick (Oregon State Univ.)
07:05 – New view of the subsurface at Axial from the 2019 3D Multi-Channel Seismic
(MCS) survey (deep structure) – Graham Kent (Univ of Nevada, Reno / IPGP, Paris)
07:20 – New view of the subsurface at Axial from the 2019 3D MCS survey (shallow
structure) – Satish Singh (IPGP, Paris)
07:35 – MCS time-lapse analysis across the 3 different datasets – Yan Zhao (IPGP, Paris)
07:50 – Dynamic Magmatic Movement in the Deep Crust of the Axial Seamount – Li Wang
(Nanjing University, China)
08:05 – On poroelastic inversion of the geodetic time-series at Axial – Yang Liao (Woods
Hole Oceanographic Institute)
08:20 – Temporal variation of vent temperatures and crustal permeability in relation to the
volcano deformation cycle at Axial Seamount – Guangyu Xu (Univ. of Washington)
08:35 – Temperature time series and sonar imaging of hydrothermal plumes – Karen Bemis
(Rutgers Univ).
08:50 – 10-minute BREAK
09:05 – Hydrothermal chemistry – Dave Butterfield (Univ. of Washington, NOAA/PMEL)
09:15 – Subseafloor hydrology, methanogenesis, and carbon fractionation – Jim Holden
(Univ. of Massachusetts at Amherst)
09:30 – 2011 and 2015 eruption event timing from lava 210Po-210Pb Radiometric Dating –
Kenna Rubin (Univ. of Rhode Island)
09:45 – Lightning talk (5-min): Upcoming multi-span DAS experiment on the OOI-RCA –
William Wilcock (Univ. of Washington)
09:50 – Lightning talk (5-min): A comparison of calibrated pressure measurements at the
central caldera site – Yoichiro Dobash (Univ. of Washington)
09:55 – Open sharing of information about upcoming field work or planned projects related to
Axial Seamount (all)
10:00 – TIME SLOT FOR GENERAL DISCUSSION (duration flexible)
10:30 – END OF DAY 2; END OF WORKSHOP
The Pacific Northwest’s most active underwater volcano is getting ready to erupt

Three hundred miles off the coast of Oregon and more than 4,900 feet below the surface of the Pacific Ocean, one of the Pacific Northwest’s least famous — but most active — volcanoes is showing signs that it will soon erupt for the first time since 2015.
Read more from the University of Washington’s College of the Environment.
Read MoreRegional Cabled Array Tracks Axial Seamount’s Impending Eruption
The Regional Cabled Array, a network of over 660 miles of undersea cables with more than 140 monitoring instruments, provides real-time data on the Axial Seamount, making it the most extensively studied undersea volcano. This system has detected magma reservoir inflation and increased seismic activity, key indicators that an eruption is likely before the end of 2025.
Read more from the Herald-Tribune.
Read MoreRegional Cabled Array: Monitoring Axial Seamount in Real Time
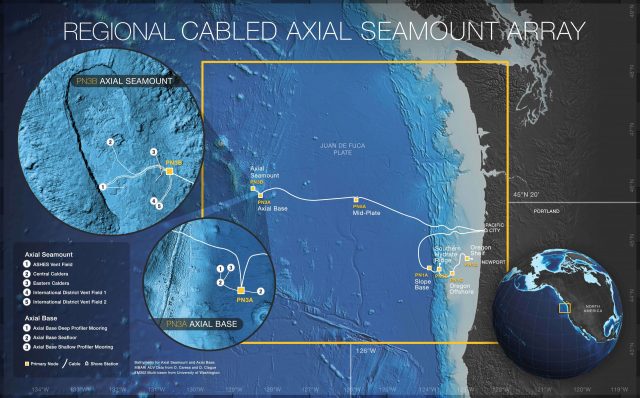
The Regional Cabled Array (RCA) is the world’s most extensive undersea volcano monitoring system, located off the Oregon coast. Operated by the University of Washington as part of the Ocean Observatories Initiative (OOI), the RCA features a network of submarine cables extending 200 miles offshore from Pacific City and Newport. This system monitors the Axial Seamount, a submarine volcano expected to erupt this year.
In a recent interview, Deb Kelley, OOI Principal Investigator and Director at the University of Washington School of Oceanography, discussed how the RCA collects near-time data to track seismic activity, hydrothermal systems, and chemical changes associated with volcanic activity. The RCA’s data supports long-term research on ocean dynamics and tectonic processes, providing critical insights into the Earth’s underwater systems.
Watch the full interview with KPTV FOX 12 here: https://www.youtube.com/watch?v=PUJMTdka8KI
[caption id="attachment_35589" align="alignnone" width="640"] Credit: Center for Environmental Visualization, University of Washington[/caption]
Read More New Hints When Axial Might Erupt: Precursor Events Detected Through Machine Learning
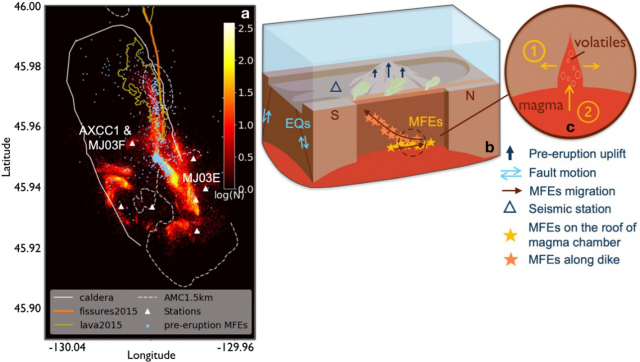
A recent paper by Wang et al., “Volcanic precursor revealed by machine learning offers new eruption forecasting capability” [1] describes the characterization of time-dependent spectral features of earthquakes at Axial Seamount prior to the 2015 using unsupervised machine learning (this method applies algorithms to analyze data without humans in the loop). A major finding from this work is the identification of a distinct burst of mixed-frequency earthquake (MEF) signals that rapidly increased 15 hours prior to the start of the eruption, peaked one hour before lavas reached the seafloor, and earthquakes at Axial Seamount prior to the 2015 using unsupervised machine learning (this method applies algorithms to analyze data without humans in the loop). A major finding from this work is the identification of a distinct burst of mixed-frequency earthquake (MEF) signals that rapidly increased 15 hours prior to the start of the eruption, peaked one hour before lavas reached the seafloor, and migrated along pre-existing faults. The earthquakes are thought to reflect brittle failure driven by magma migration and/or degassing of volatiles. The source mantle beneath Axial Seamount contains extremely high CO2 concentrations leading to high concentrations in the melts [3,4]. MEFs were detected for months prior to the eruption, which could result from volatile release associated with inflation of the sills that feed Axial [5]. Importantly, the identification of these signals may help forecasting of the upcoming Axial eruption and may also be applied to other active volcanoes.
The authors utilized a wealth of geophysical data from the past decade to present an integrated view of Axial (Figure 1) including a subset of earthquake data 4 months prior to the eruption (67,767 out of their >240,000 earthquake catalogue from the RCA seismic array [2]), coupled with bottom pressure from BOTPT instruments at the Central Caldera and Eastern Caldera sites, and 3D modeling.
[caption id="attachment_34973" align="alignnone" width="640"]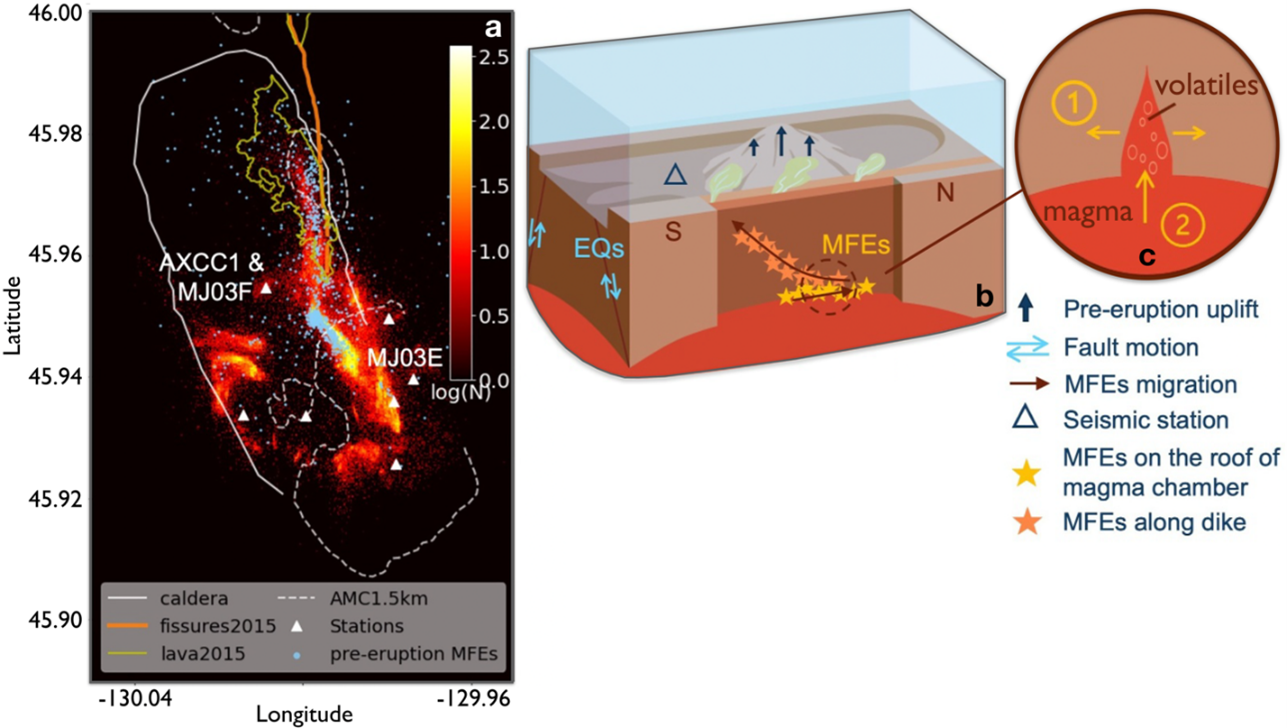 After Wang et al., 2024 [1] Figures 1 and 4: a) Heatmap of earthquake density at Axial Seamount from Nov 2014 to Dec 2021 [2]. Image highlights mixed‐frequency earthquakes (MFEs – light blue dots) one day before the eruption, the caldera rim (white solid line), the 1.5 km depth contour of the Axial magma chamber (AMC)(dashed white line), eruptive fissures (orange lines), lava flows of the 2015 eruption (yellow lines), the location of the RCA short-period seismometer array (white triangles),broadband seismometer AXCC1 and bottom pressure tilt instruments (MJ03E and MJ03F. Heatmap shows the number of earthquakes in each 25 m × 25 m bins. b) Cartoon summarizing observations. Tidally‐driven earthquakes occur on caldera ring faults, while the MFEs track movement of volatiles and magma prior to the eruption. c) possible mechanisms of the MFEs. ① and ② correspond to crack opening and volatile/magma influx processes.[/caption]___________________
References:
[1] Wang, K., F. Waldhouser, M. Tolstoy, D. Schaff, T. Sawi, W.S.D. Wilcock, and Y.J. Tan (2024) Volcanic precursor revealed by machine learning offers new eruption forecasting capability. Geophyiscal Research Letters, 51 (19) https://doi.org/10.1029/2024GL108631.
[2] Wang, K., F. Waldhouser, D.P. Schaff, M. Tolstoy, W.S.D. Wilcock, and Y.J. Tan (2024) Real-time detection of volcanic unrest and eruption at Axial Seamount using machine learning. Seismological Research Letters, 95, 2651–2662, doi: 10.1785/0220240086.
[3] Helo, C., M.-A. Longpre, N. Shimizu, D.A. Clague and J. Stix. (2011) Explosive eruptions at mid-ocean ridges driven by CO2-rich magmas. Nature Geoscience. 4, 260–263 (2011). https://doi.org/10.1038/ngeo1104.
[4] Dixon, J. E., E. Stolper, E., and J.R. Delaney (1988). Infrared spectroscopic measurements of CO2 and H2O in Juan de Fuca Ridge basaltic glasses. Earth and Planetary Science Letters, 90(1), 87–104. https://doi.org/10.1016/0012‐821x(88)90114‐8.
Read MoreDeep-Sea Biodiversity: VIAME and OOI JupyterHub Accelerate Research
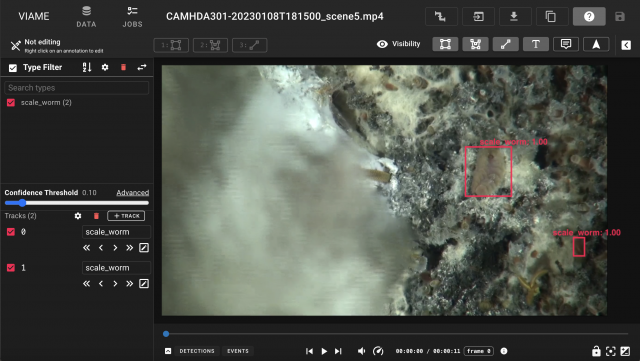
Off the coast of Oregon, the Axial Seamount on the Juan de Fuca Ridge hosts the ASHES vent field, a site rich in hydrothermal activity and diverse marine life. Principal Investigators, Dax Soule and Karen Bemis, and their teams are leveraging footage from past expeditions, captured by the OOI CamHD video archive, to study species diversity and abundance in this extreme environment.
With hundreds of terabytes of video data available, manual analysis is impractical. To address this, master’s student Julia Sandke and a team of undergraduate researchers are utilizing VIAME (Video and Image Analytics for a Marine Environment), a tool that helps build machine learning datasets by automating the annotation and classification of vent organisms. The goal is to use these datasets to train models that can autonomously analyze species diversity and abundance.
The integration of VIAME’s directories into the OOI JupyterHub environment, along with the addition of Nvidia L40S GPUs, has been a pivotal advancement. Previously, the team faced long delays using the shared VIAME web interface. Now, with dedicated resources in JupyterHub and the enhanced power of GPUs, they can significantly speed up machine learning processes, such as video training and data analysis, which once took days to complete.
This new computational power allows the team to begin unlocking the wealth of data in the CamHD archive, delving deeper into the species diversity around these vents. The long-term goal of the project is to use computer vision and machine learning to develop models that can track species abundance and predict key changes in the ecosystem. For example, these models could forecast where target species may appear after volcanic eruptions at Axial Seamount, providing researchers crucial insights into the shifting biological landscape of hydrothermal vent environments.
[caption id="attachment_34847" align="alignnone" width="640"]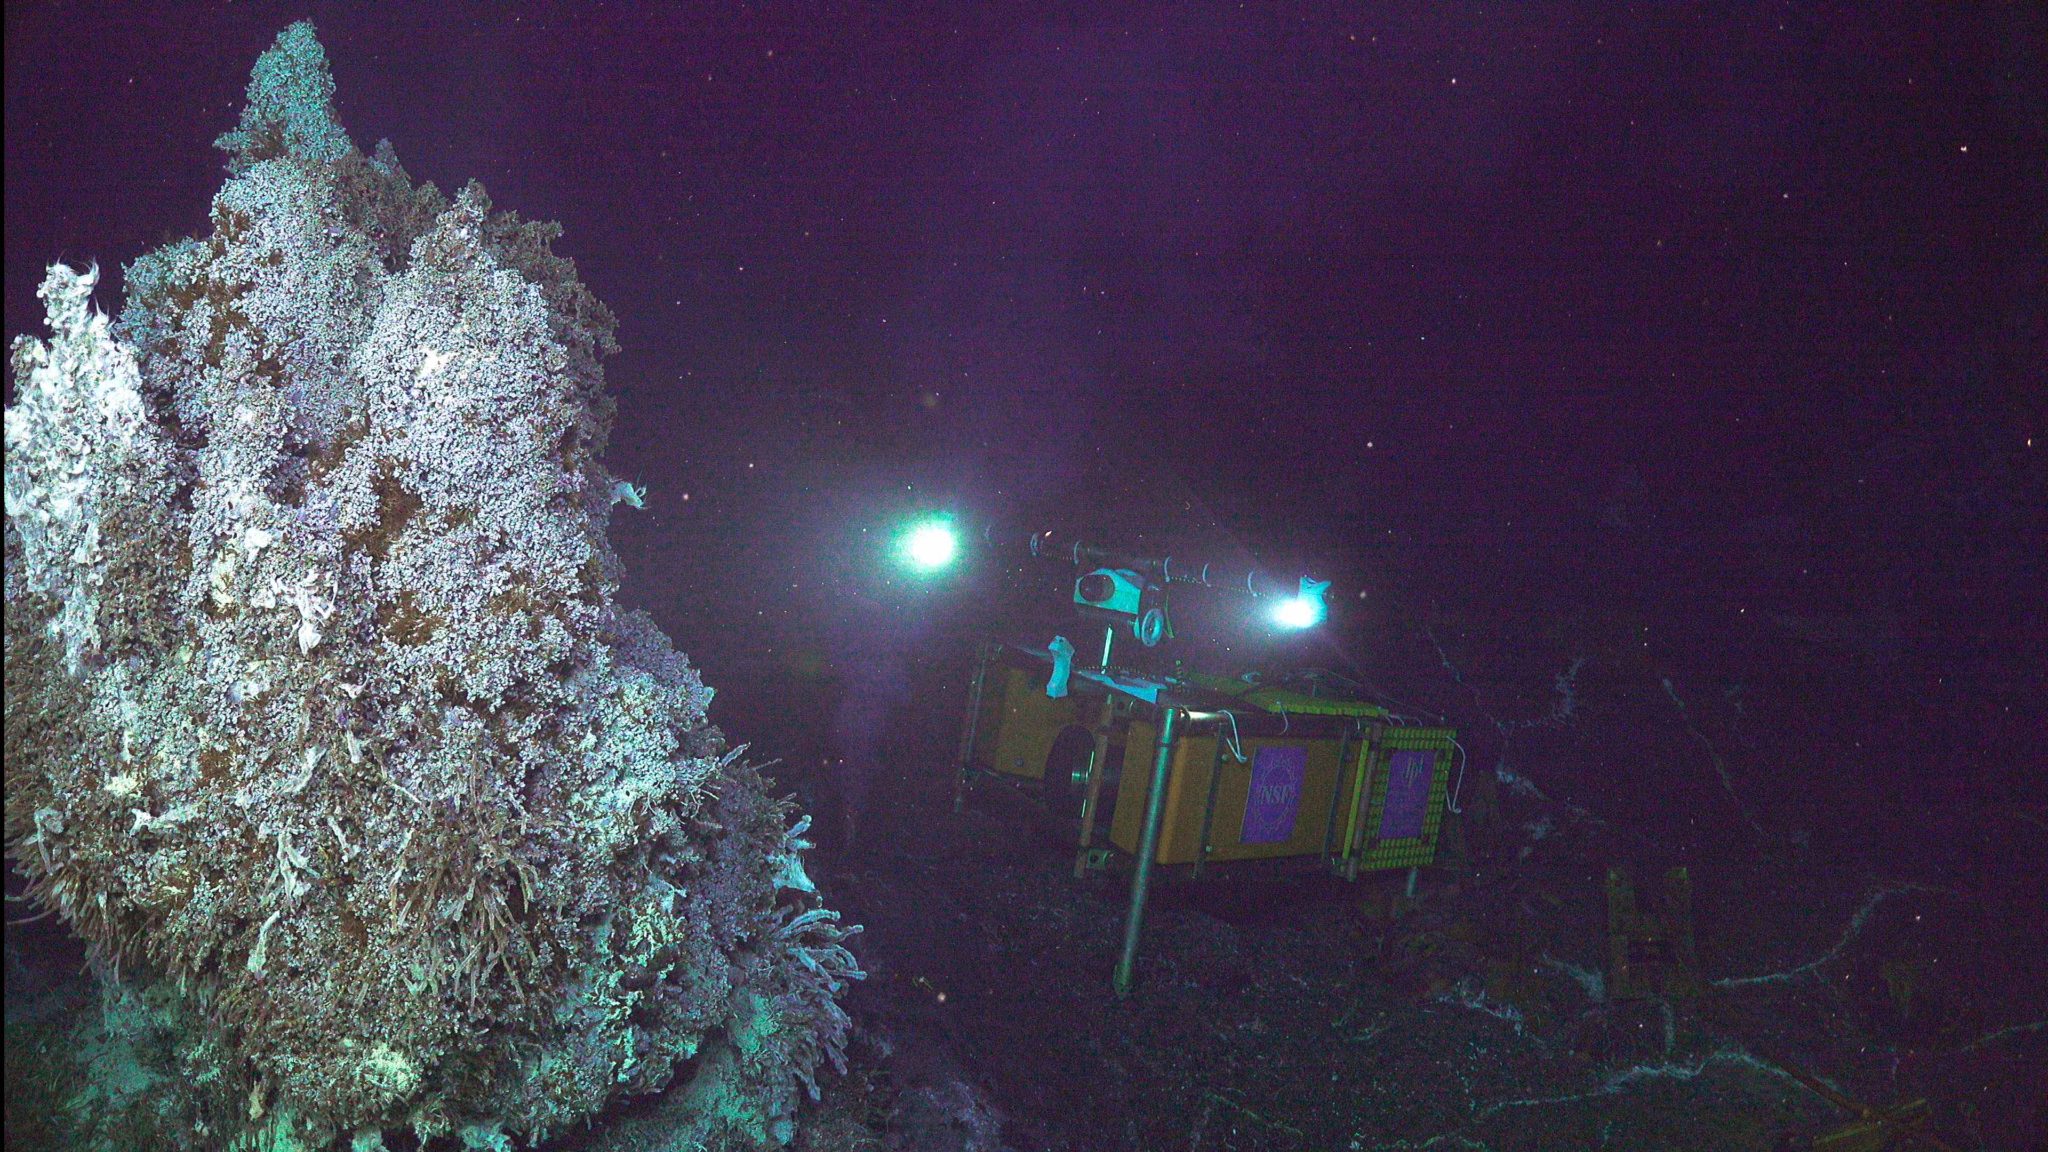 Credit: UW/NSF-OOI/WHOI; J2-1613. V24[/caption]
Read More
Credit: UW/NSF-OOI/WHOI; J2-1613. V24[/caption]
Read More Axial Seamount: The Phoenix Rises
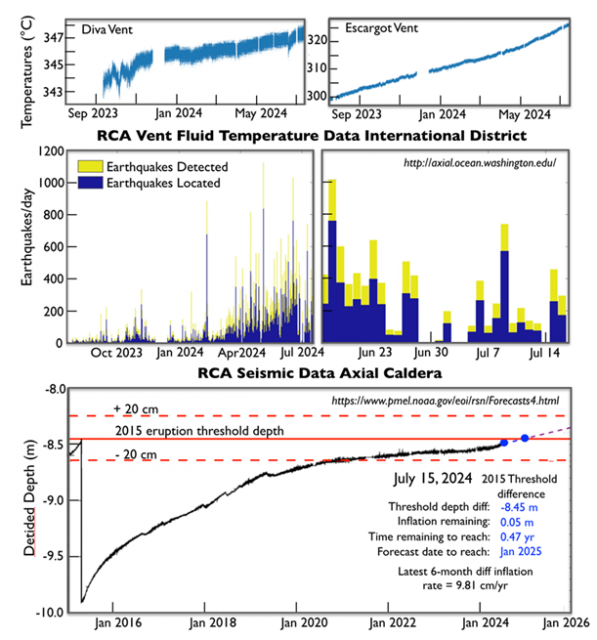
Regional Cabled Array live data feeds from the bottom pressure tilt, seismic, and temperature-resistivity instruments are capturing a marked increase activity at Axial Seamount with total seafloor uplift approaching the threshold depth for the 2015 eruption. As noted by W. Chadwick (OSU), whose website provides daily forecasts, the average differential inflation rate has almost doubled in the last six months. Bottom pressure tilt data at the Central and Eastern Caldera sites, show a marked increase in uplift beginning in April increasing from ~ 6 cm/yr to ~10 cm/year. The increase in uplift rates is coincident with a dramatic increase in seismic activity [viewable on daily plots of earthquakes accessible on W. Wilcock’s Axial Earthquake Catalogue (UW)] with >1000 earthquakes in a 24 hr period also occurring in April: seismic activity remains, high, but has not reached the 1000’s per day as detected prior to the April 2015 eruption (Wilcock et al, 2016). The hydrothermal system in the International District Hydrothermal Field, located on the eastern rift zone within Axial Caldera, is also responding to this increased activity. Fluid temperatures measured by the temperature-resistivity sensor in a parasitic orifice on the side of the hydrothermal vent Escargot show an increase in the past 6 months, with a marked change in the past 3 months (Courtesy of W. Ruef, UW). Excitement is building as we watch this dynamic volcano respond to melt migration 2 km below the seafloor – January 2025 is not far away.
[caption id="attachment_34576" align="alignnone" width="597"] RCA bottom pressure tilt data Central Caldera Axial Seamount[/caption]
Read More Off We Go – Will Axial Seamount Surprise Us?

– Deborah Kelley, School of Oceanography Director at UW & Principal Investigator, OOI
The UW Regional Cabled Array team from the School of Oceanography and the Applied Physics Laboratory will once again have an exciting summer in the NE Pacific maintaining the National Science Foundations’ Regional Cabled Array (RCA) underwater observatory. This summer’s 37-day expedition (August 6-September 11) is especially exciting because we will be spending significant time directly viewing the highly active submarine volcano off our coast ‘Axial Seamount’, which erupted in 2015 and is poised to erupt anytime between now and sometime in 2025 (see Dr. Bill Chadwick’s blog).
The volcano, >300 miles offshore Oregon and Washington and nearly 1 mile beneath the ocean’s surface, has woken up over the past three months. Over 1000 earthquakes occurred in a single day in April and this week daily numbers are spiking at several hundred events each day (e.g >600 July 23)(see Dr. William Wilcock’s earthquake catalogue). Over this same period, the summit of the volcano began inflating at a more rapid rate as melt migrates into the shallow magma reservoir beneath the volcano. The summit of the volcano has already reached the depth it was at when it erupted in 1998 and 2011 and is approaching that of the 2015 eruption. That eruption resulted in a >400 ft thick lava flow (equivalent to ~ 2/3 up the height of Seattle’s Space Needle) and detection of over 30,000 explosions as the lava issued onto the seafloor. Temperatures in the underwater hot springs we will be visiting during the cruise are also rising — all pointing towards an immanent eruption.
The cruise will use the remotely operated vehicle (ROV) Jason and the global class research ship the R/V Atlantis operated by Woods Hole Oceanographic Institution. Excitement is building as our equipment is fully tested, safely packed away, and next week on its way via numerous 48 ft-long trucks to Newport, Oregon where we will begin mobilizing the ship starting August 6th. We are very much looking forward to working with 26 US and international students who are joining us on the expedition, working side-by-side scientists, engineers, and the ship and ROV teams.
This cruise is highly complex including berthing for 72 RCA folks during the three Legs of the cruise. A diverse array of >100 instruments, seafloor substations (junction boxes), and instrumented pods on the Shallow Profiler Moorings will be recovered and reinstalled, and tested. The cruise will also include turning instrumented vehicles on Deep Profiler Moorings. The vehicles make daily trips spanning up to ~18,000 ft as they traverse from the near seafloor environment to ~ 300 ft beneath the ocean’s surface.
The ship will be “packed to the gills” on each of the three legs that make up this expedition, carrying everything from state-of-the-art mooring components to sharpies. In addition to the core Ocean Observatories Initiative (OOI) work, seven days of the cruise will be dedicated to special programs funded by NSF to research scientists that involve turning of specialized instruments on the cable, recovery instruments and sampling of methane seeps at Southern Hydrate Ridge, and sampling of hydrothermal fluids for shore-based investigation of microbes and viruses in the extreme environments at Axial Seamount.
You will be able to watch our underwater operations live through streaming video as the ROV Jason works 1) 5000 ft down at the summit of Axial Seamount where we will see astounding seascapes of lava and numerous deep-sea active hot spring deposits that are home to some of the most bizarre creatures on Earth; 2) offshore Newport, Oregon to depths of ~250 ft to 10,000 ft in some of the most biologically productive waters in the oceans; and 3) sedimented sites on the Cascadia margin where methane-rich plumes jet from the seafloor. Here, methane seeps support dense bacterial mats and giant clams that thrive in the absence of sunlight on gases migrating through the seafloor.
An enhanced, high-bandwidth satellite connection from the R/V Atlantis will allow you to experience in real-time our deep-sea operations through live video streams to shore and onto this website.
The satellite feeds will allow scientists onboard to see data as new instruments are connected to the seafloor submarine fiber optic cables that bring the Internet into the ocean. During the cruise, engineers from the Applied Physics Lab will utilize the RCA operations center in the School of Oceanography where they will communicate directly with the instruments as they are installed, turn power on and off, and command and control instruments from hundreds of miles away and far offshore (including a resident cabled high definition camera that streams video live of an underwater hot spring at the summit of from Axial Seamount throughout the year). All total, the system hosts 150 instruments that stream data at the speed of light in real-time to shore 24/7, where they are stored and visualized through the OOI Cyberinfrastructure system at Oregon State University.
As always, it will be great to be away from the dock, smell the salt air again, and work beneath the waves on some of the most advanced technology in the oceans. For many students, these expeditions have changed their lives.
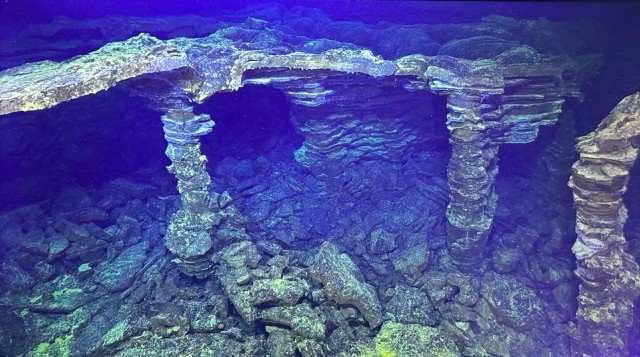
Read MoreClose-up View of An Active Hydrothermal Vent Now Easily Accessible
Now accessible on OOI’s Data Explorer: 47,000 hours of video from a high-definition (HD) camera at an active hydrothermal vent and underwater volcano, 1500 meters below the ocean’s surface!
The HD camera has been streaming live video since 2015, offering a close-up look at what’s been happening within the caldera of Axial Seamount, a highly active underwater volcano about 300 miles off the coast of Oregon. The SubC 1Cam video camera was modified by the Applied Physics Lab (APL) at the University of Washington for deployment on OOI’s Regional Cabled Array (RCA) in the NE Pacific Ocean. The camera is connected via a roughly 4 km dedicated 10 Gb extension cable that runs across the caldera from the camera in the ASHES vent field to Primary Node PN3B located near the eastern edge of the caldera. From there imagery are streamed at the speed of light over 521 km of submarine fiber optic cable to the shore station in Pacific City, OR.
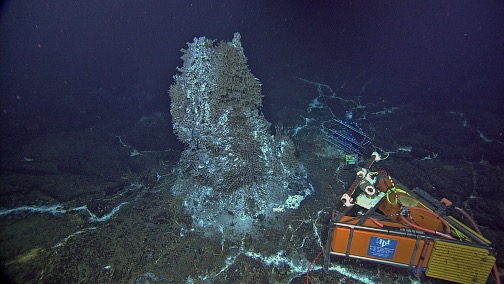
[media-caption path="https://oceanobservatories.org/wp-content/uploads/2024/05/HD-Camera.jpg" link="#"]The HD camera (orange triangular frame) images the 14 ft-tall actively venting hot spring deposit ‘Mushroom’ located within the caldera of Axial Seamount. Credit: NSF-OOI/UW/CSSF; Dive R1730; V14.[/media-caption]Up until recently, the footage has been available on the OOI raw data server in 14-minute increments as both high resolution MOV files and compressed MP4 formats, but the imagery was not easily reviewed or searchable. To make this unique nearly decade of footage more readily available to researchers, a new gallery feature on Data Explorer was created that allows researchers to easily view, search, and download the stunning video. All files created over each 24-hour period are used to create a sped-up, compressed, and time-stamped preview video allowing rapid overviews of daily events. Associated metadata and quick links provide access to the raw and log files, and a higher-resolution version of the preview is also available for download.
“The camera faces an active hydrothermal edifice called Mushroom that is completely encased in a dense biological community thriving in fluids emanating from the chimney walls,” explained Michael Vardaro, a research consultant for the RCA, who has been involved in OOI since construction began in 2011. “Mushroom hosts an active chemosynthetic community with 300 ºC hydrothermal fluids streaming out its top and from a small, highly dynamic chimney at its base. The camera allows the research community to see how the flow of hydrothermal fluid and the activity of all the different creatures living on it change over time, as well as the growth and evolution of the sulfide structure.”
Vardaro also said that the video allows viewers to watch what is happening in the short term. “You can catch predation events that include little scale worms nibbling on the gills of the tube worms. You can observe sea spiders [pycnogonids] crawling around the base of the chimney and watch as new vent openings develop. It’s a very changeable environment, because as the hydrothermal fluid hits the cold seawater, the metals and other chemicals dissolved in the superheated water precipitate out as solid minerals, creating fragile projections that then repeatedly crumble over time as the flow changes. The camera imagery provides important insights into linkages among geological, chemical and biological process at seismically active underwater volcano that has erupted in 1998, 2011, and 2015 and is poised to erupt again.”
[embed]https://youtu.be/oiDxkHWB3rI[/embed]The chimney stands about 14 feet high. The camera sits on a tripod at the base of the chimney with a pan and tilt unit. It follows an automated, 14-minute routine with the camera moving up, down and across the chimney and water column, stopping at pre-selected key areas of interest. What’s more, the APL team onshore can stop and alter the viewpoint if something interesting is happening or a question needs answering. “The Data Explorer now offers a hugely rich dataset of video footage extremely rare in mid-ocean ridge settings that offers a unique window into what is happening on the seafloor at an active hydrothermal vent site,” Vardaro added. “As development on the gallery continues, we also plan to add annotations and eventually incorporate machine learning and event detection to tag interesting biological features or significant changes to the site”.
In addition to the Data Explorer access, the live video stream is available every three hours for 14-minutes online (at 2:00, 5:00, 8:00, and 11:00 EDT & PDT). The camera also runs for 24 hours straight on the 10th and 20th of the month, with a 72-hour run on the 1st-3rd of the month as a means of gaining a fuller picture of activity at the site.
[embed]https://youtu.be/VjqduffxNyU[/embed]
Read More
Is Axial Seamount Napping?
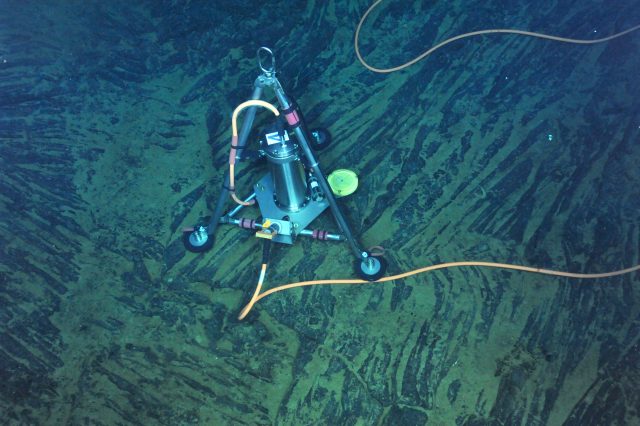
Oregon State University Researcher Bill Chadwick attempted to answer this question in a poster he presented at AGU in December 2023. Chadwick has been watching the “ups and downs” of Axial Seamount for more than 30 years, including its last eruption in 2015. He and other observers monitor the seamount’s activity using bottom pressure recorders (BPR) connected to the US National Science Foundation Ocean Observatories Initiative (NSF OOI) Regional Cabled Array (RCA), operated by the University of Washington, along with additional uncabled BPRs and Mobile Pressure Recorder surveys at an array of seafloor benchmarks every two years using a remotely operated vehicle.
[media-caption path="https://oceanobservatories.org/wp-content/uploads/2024/03/BPR-scaled.jpg" link="#"]A repeatable inflation-deflation cycle has been documented at Axial Seamount over the last 30 years, using autonomous, battery-powered Bottom Pressure Recorders (BPRs), and later cabled-BPRs like this one connected to the OOI-RCA. Credit: UW/NSF-OOI/CSSF, 2014.[/media-caption]“Axial Seamount has erupted three times in the last 25 years. As of March 2024, the seamount is 90-95% reinflated to the level it reached before the 2015 eruption, so we’re getting close to the eruption triggering point,” said Chadwick. “But on the other hand, the rate of inflation, which started high right after the 2015 eruption, has been decreasing and decreasing since then.”
The inflation rate reached nearly zero last summer (just slightly positive at ~1 cm/year, the lowest rate seen at Axial). “At that very low rate, it was hard to tell how long it would take to reach the 2015 inflation threshold,” Chadwick added.
Since October 2023, however, the rate of uplift has been slowly increasing. University of Washington Researcher William Wilcock’s Axial Seamount Earthquake Catalog page also indicates the seismicity has been on the rise since October 2023, with a large swarm of >600 events on 10 February.
“Since October 2023, the rate of inflation has increased a bit to 5-6 cm/yr, which is still quite low compared to rates we’ve seen over the last 25 years but seems to indicate that Axial may be coming out of its slumber of last summer,” Chadwick explained. “And the earthquake swarm on Feb 10 also seems to support that notion.”
Longer-term eruptive history documented by mapping and dating lava flows at the summit shows that Axial has produced at least 50 eruptions in the last 800 years, (Clague et al., 2013), an average of one every 15-18 years, suggesting that the current lull at Axial might not be long.
“I’m hoping that the rate of inflation will continue to increase, but it’s too early to tell. Anything could happen,“ Chadwick added. “I’m more hopeful than I was a year ago that the next eruption may not be too far off but only time will tell!”
[media-caption path="https://oceanobservatories.org/wp-content/uploads/2024/03/Chadwick-dots.jpg" link="#"]Map showing the locations of Mobile Pressure Recorder (MPR) benchmarks, as well as the autonomous and cabled Bottom Pressure Recorders (BPR). The red dots are the BPRs connected to OOI Regional Cabled Array.[/media-caption]
Reference: Clague, D.A., et al., (2013) Geologic history of the summit of Axial Seamount, Juan de Fuca Ridge, Geochem Geophys, Geosystems, doi: 10.1002/ggge.20240.
Read More