Posts Tagged ‘Coastal Endurance Array’
Shade and Poop at Sea: Increasing Solar Panel Efficiency
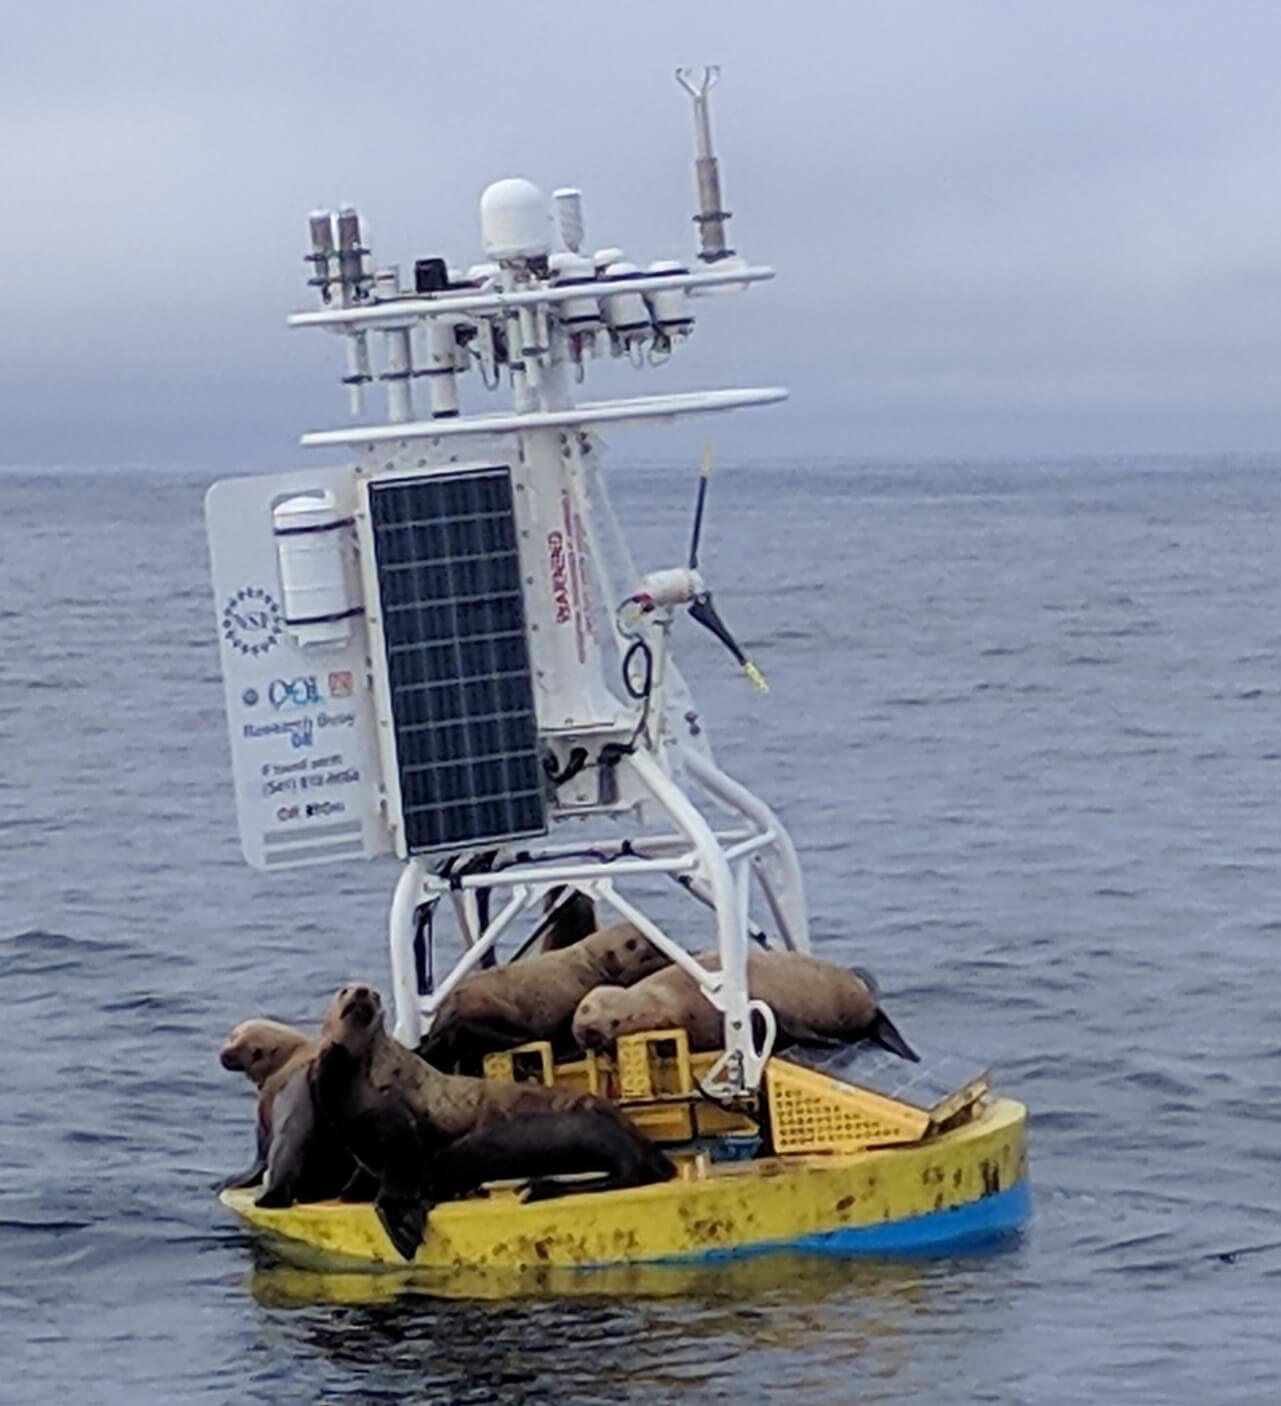
Sea lions intermittently visit the Coastal Endurance Array moorings off the coast of Oregon, where they lounge, bask in the sun, and “do their business.” These visits create two problems for the optimum functioning of the instrumented arrays. Because sea lions are heavy, some weighing up to 2,500 pounds, the solar panels upon which they rest need to be strong enough to bear this weight. And, excrement left behind by these itinerant visitors smears and shades the solar panels, making less power available for the ocean observing instrument attached to the arrays.
This intermittent excrement-related shading compounds an existing shading problem caused by the perpetual movement of the moorings. The halos at the top of the moorings cast shadows over the panels below, resulting in a significant power loss. If ten percent of a solar panel is covered in shadow, for example, its output can drop by as much as 70 percent. When sea lions take refuge on the solar panels this loss is exacerbated. Their excrement, at times, can cover up to 30 percent of the panels, virtually wiping out the power generating capability of the panels. Luckily, this coverage results in only a temporary power shortage as wind and seawater ultimately wash away the remains of these visits.
OOI Engineers John Reine and Marshall Swartz of OOI’s Engineering Team put their heads together to tackle these problems. They first addressed the shading issue.
“These moorings are never still,” explained John Reine, Senior Engineer and lead of OOI’s Electrical Refurbishment Team. “In response to wave and wind-driven motion, the masts are always going back and forth, about three times per minute, casting shadows as they move. So this constant movement of shade, no shade, shade, no shade, produces a sort of alternating current from the panels. I went to Marshall and asked how do we fix this?” (John Reine explains the problems and fixes in the video below).
[embed]https://youtu.be/1d6QQJfHqik[/embed]Solar panels are made up of lots of little solar cells, normally connected to each other so the power flows seamlessly from cell to cell. The Engineering Team recognized that by modifying the panel’s internal circuitry, it could easily harvest more of the available light. They proposed a solution to triple the number of bypass diodes, switches that would ignore shaded cells and move the power to the next operational cell in this field of cells. The manufacturer built a prototype based on an high efficiency cell design, inserting additional diodes, and tested the upgraded array. Tests at the manufacturer’s verification facility and at WHOI showed the modified design exceeded expectations.
Timing was opportune. The original solar panels had exceeded their design lifetime and needed to be replaced, but were no longer in production. The team seized on this opportunity to seek out panels incorporating more efficient cells, wired into a circuit proven to minimize shading energy losses, while also bearing the weight of the itinerant visitors.
The task fell to Swartz to find a solar manufacturer able to incorporate the bypass diodes into the panel design. He worked under the proviso that OOI prefers to buy things off the shelf so as to make repair and replacement easy, affordable, and virtually seamless, when needed.
“Such off-the-shelf solutions have worked out well for us,” said Swartz. “As it turned out, we found a supplier, SBM Solar, in North Carolina that does a lot of work with the military, including high-efficiency solar panels. Working with the president and chief engineer of the company, who was very willing to help us customize a product, we came up with a design having a string of 36 cells in the panel. We specified circuitry with bypass diodes so that when any group of four cells gets shaded, they are bypassed and the rest of the cells in the panel can continue to provide unrestricted power to the buoy.
“Just by making this small change, we significantly improved the total energy harvest in a simulated condition by 50 percent, “ Swartz added. What this means in practical terms is that the solar panels can now harvest useful power from almost any light condition –whether it is the reflected light off the surface of the water, low incidence light at sunset, and light that is filtered through the clouds during an early gray day.
Jokingly, he added, “ These panels basically follow the principle of ‘whenever I have the opportunity to make electricity, I’m going to do it’.”
The new panels also passed the weight-bearing problem for the array’s visitors. While the old panels were glass and subject to occasional cracking, the new panels are an aluminum polyester Teflon sandwich, with the solar cells in between the top and bottom layers. This new configuration is much lighter (27 pounds vs 45 pounds for the glass panels), more rugged, and more resilient to the ever-changing at-sea conditions than the glass version it is replacing.
The new panels are also flexible, rather than rigid like glass, which created another challenge to for the Engineering Team. They designed a special back for the panel with struts to provide greater support and more weight distribution as the 2,500-pound visitors flop onto the arrays. The lighter weight of the panels is giving the team more flexibility in placement of the panels on the moorings.
Said Reine, “We are so pleased to have these new and improved “off-the-shelf” solar panels operational. Two panels are now in place on Pioneer Array moorings, and another eight panels have been shipped to the Endurance Array, where they will be greeted by their 2,500-pound interlopers.”
[embed]http://https://youtu.be/1d6QQJfHqik[/embed] Read More
Low Dissolved Oxygen off Washington and Oregon Coast Impacted by Upwelling in 2017
In the summer of 2020, the Rutgers University Ocean Data Labs project worked with the Rutgers Research Internships in Ocean Science to support ten undergraduate students in a virtual Research Experiences for Undergraduates program. Rutgers led two weeks of research methods training and Python coding instruction. This was followed by six weeks of independent study with one of 13 research mentors.
Dr. Tom Connolly (Moss Landing Marine Labs, San Jose State University) advised Andrea Selkow from Austin College, Texas on her study of dissolved oxygen (DO) off the Washington and Oregon coasts using the OOI Endurance Array.
Selkow evaluated DO data from Endurance Array Surface Moorings during 2017 and 2018. She presented this work as a poster at the conclusion of her summer REU. Selkow focused on the question: Are there similarities in the dissolved oxygen concentrations off the coast of Oregon and Washington during a known low oxygen event? She also considered why there might exist differences based on the spatial variability of wind stress forcing, i.e., do the strong Oregon winds cause dissolved oxygen concentrations to be lower at the Oregon mooring compared to the Washington moorings. Finally, she reviewed the data and tried to answer whether the oxygen data were accurate or affected by biofouling.
She used datasets from the OR and WA Inshore Shelf Mooring time-series and WA Shelf Mooring time-series from Endurance Array. Her focus was on the seafloor data because that is where the lowest oxygen concentrations were expected to be observed.
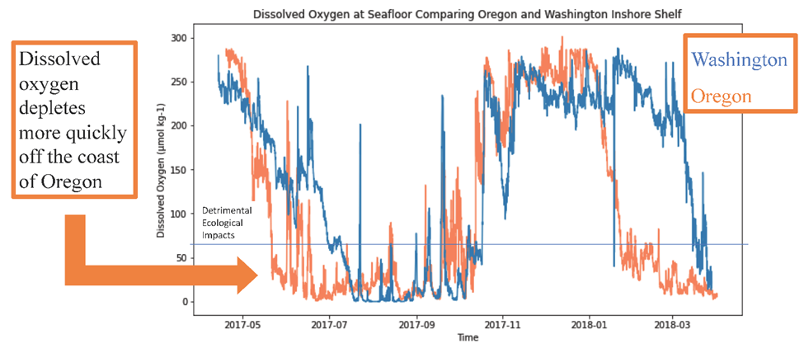
Selkow focused her attention on low DO observed in the summer of 2017. While Barth et al. (2018) presented a report on these data for one event in July 2017, she expanded the analysis to include the Washington shelf and inshore moorings. She plotted time series data and used cruise data to validate these time series. While overall seasonal trends in DO were similar, she found dissolved oxygen is routinely more quickly depleted off the coast of Oregon than Washington during a low oxygen event (Figure 25). She also looked at the cross-shelf variability in DO time series and found dissolved oxygen is more quickly depleted at the shelf mooring than at the inshore shelf mooring. Upwelling is known to drive the low oxygen events and she inferred that the weaker southward winds over the Washington shelf may be why DO decreases at a slower rate off Washington than Oregon.
References
Barth, J.A., J.P. Fram, E.P. Dever, C.M. Risien, C.E. Wingard, R.W. Collier, and T.D. Kearney. 2018. Warm blobs, low-oxygen events, and an eclipse: The Ocean Observatories Initiative Endurance Array captures them all. Oceanography 31(1):90–97,
Selkow, A. and T. Connelly. Low Dissolved Oxygen off Washington and Oregon Coast Impacted by Upwelling in 2017, Accessed 13 Jan 2021.
Read MoreEndurance Array Measures Impact of Forest Fire Smoke
On September 8th 2020, wildfires spread quickly across western Oregon causing tremendous damage and shrouding the region with smoke for more than a week. Smoke from these fires, driven by an extreme Santa Ana-type easterly wind event, could be seen from satellites (figure 1). The smoky air moved directly across the path of the Coastal Endurance Array. A data view of this phenomenon is available here.
[caption id="attachment_20182" align="aligncenter" width="450"]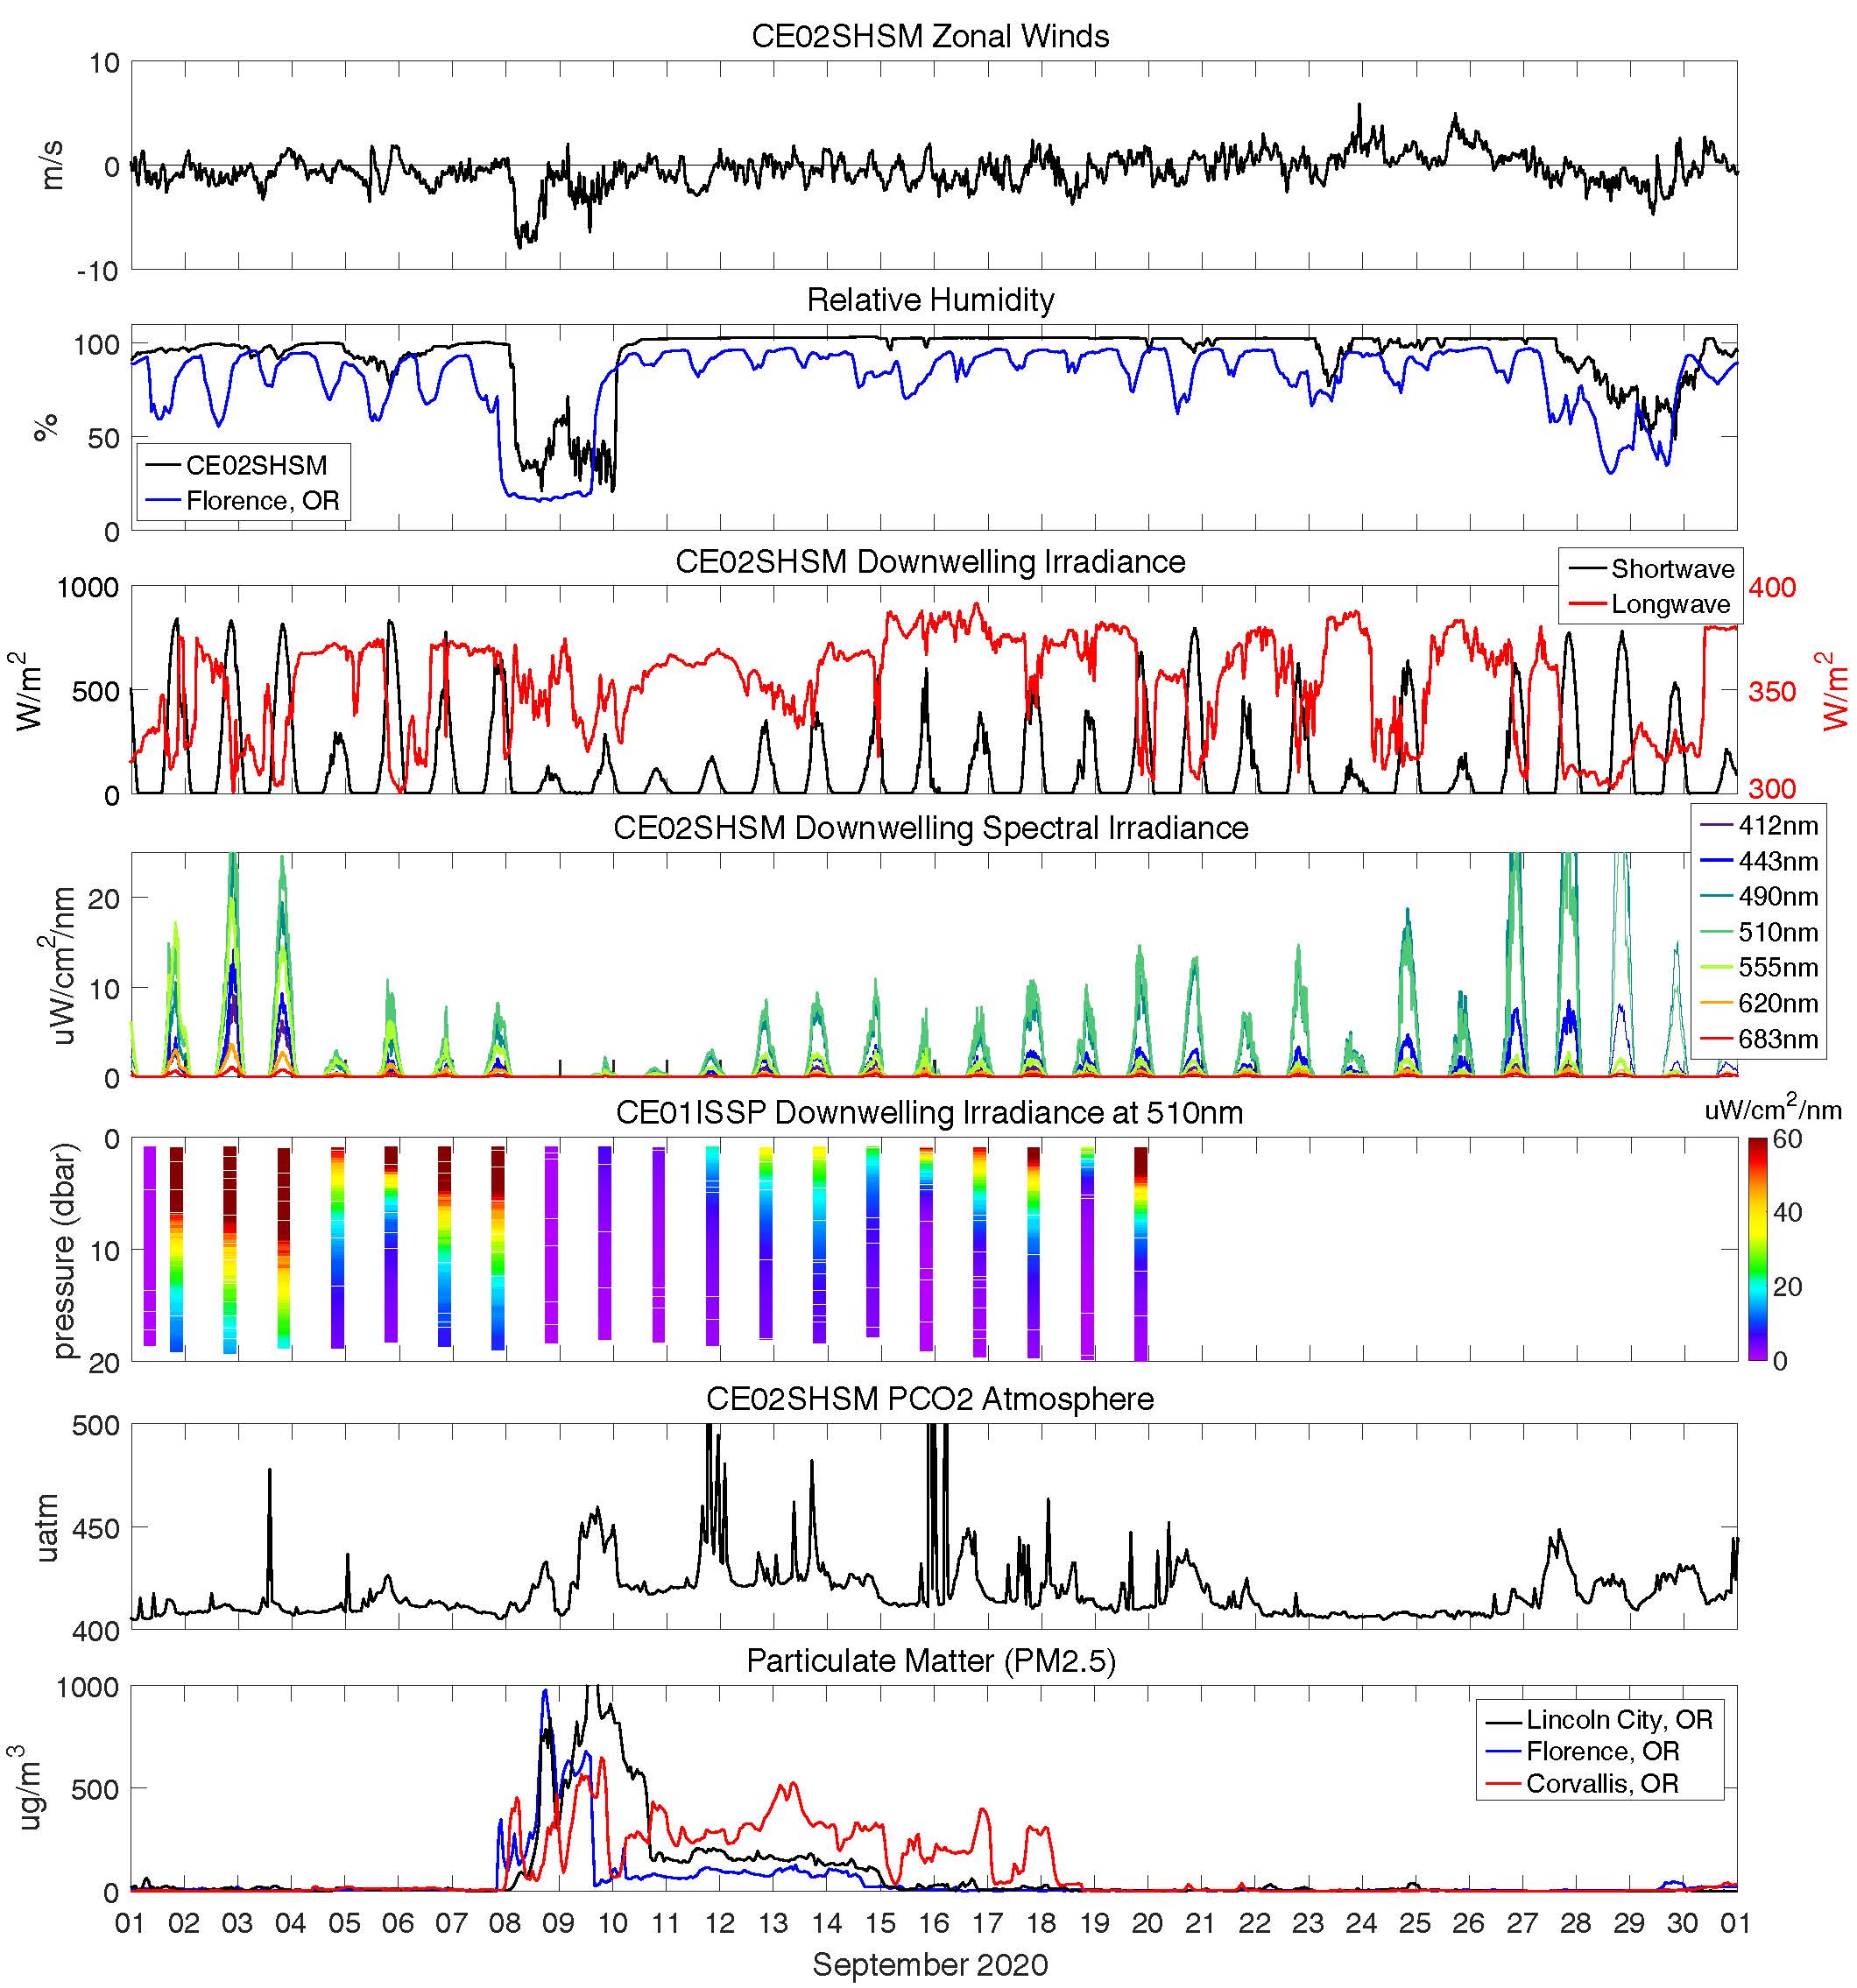 The impact of the strong, dry offshore winds was measured by Coastal Endurance Array sensors shown here.[/caption]
Beginning on the 8th, strong, dry offshore winds blew past the Oregon Shelf Surface Mooring (CE02SHSM) 10 nautical miles west of Newport, which measured the lowest relative humidity values (<18%) since it was first deployed in April 2015 (panels a & b). These winds were followed by a week of reduced sunlight (panel c). Six meters below the surface, sunlight was reduced by the red smoke more in some colors than in others (panel d). Closer to shore at the Oregon Inshore site, light levels were measured throughout the water column by an OOI coastal surface piercing profiler (panel e). The smoky air had relatively high concentrations of carbon dioxide (panel f). Other Coastal Endurance Array sensors, such as bioacoustic sonars, also may have measured additional effects from these fires.
At the coast, the smokiest air cleared after a few days, although air particulates were elevated for more than a week (panel g). During the worst of the smoke, the iconic bridge over Yaquina Bay in Newport was hardly visible (figure 2). In Corvallis, 100 km inland and in the center of the Willamette Valley, unhealthy air blanketed the town for 10 days. These measurements are but one example of the type and quality of data being continuously collected by the Coastal Endurance Array.
[caption id="attachment_20185" align="aligncenter" width="640"]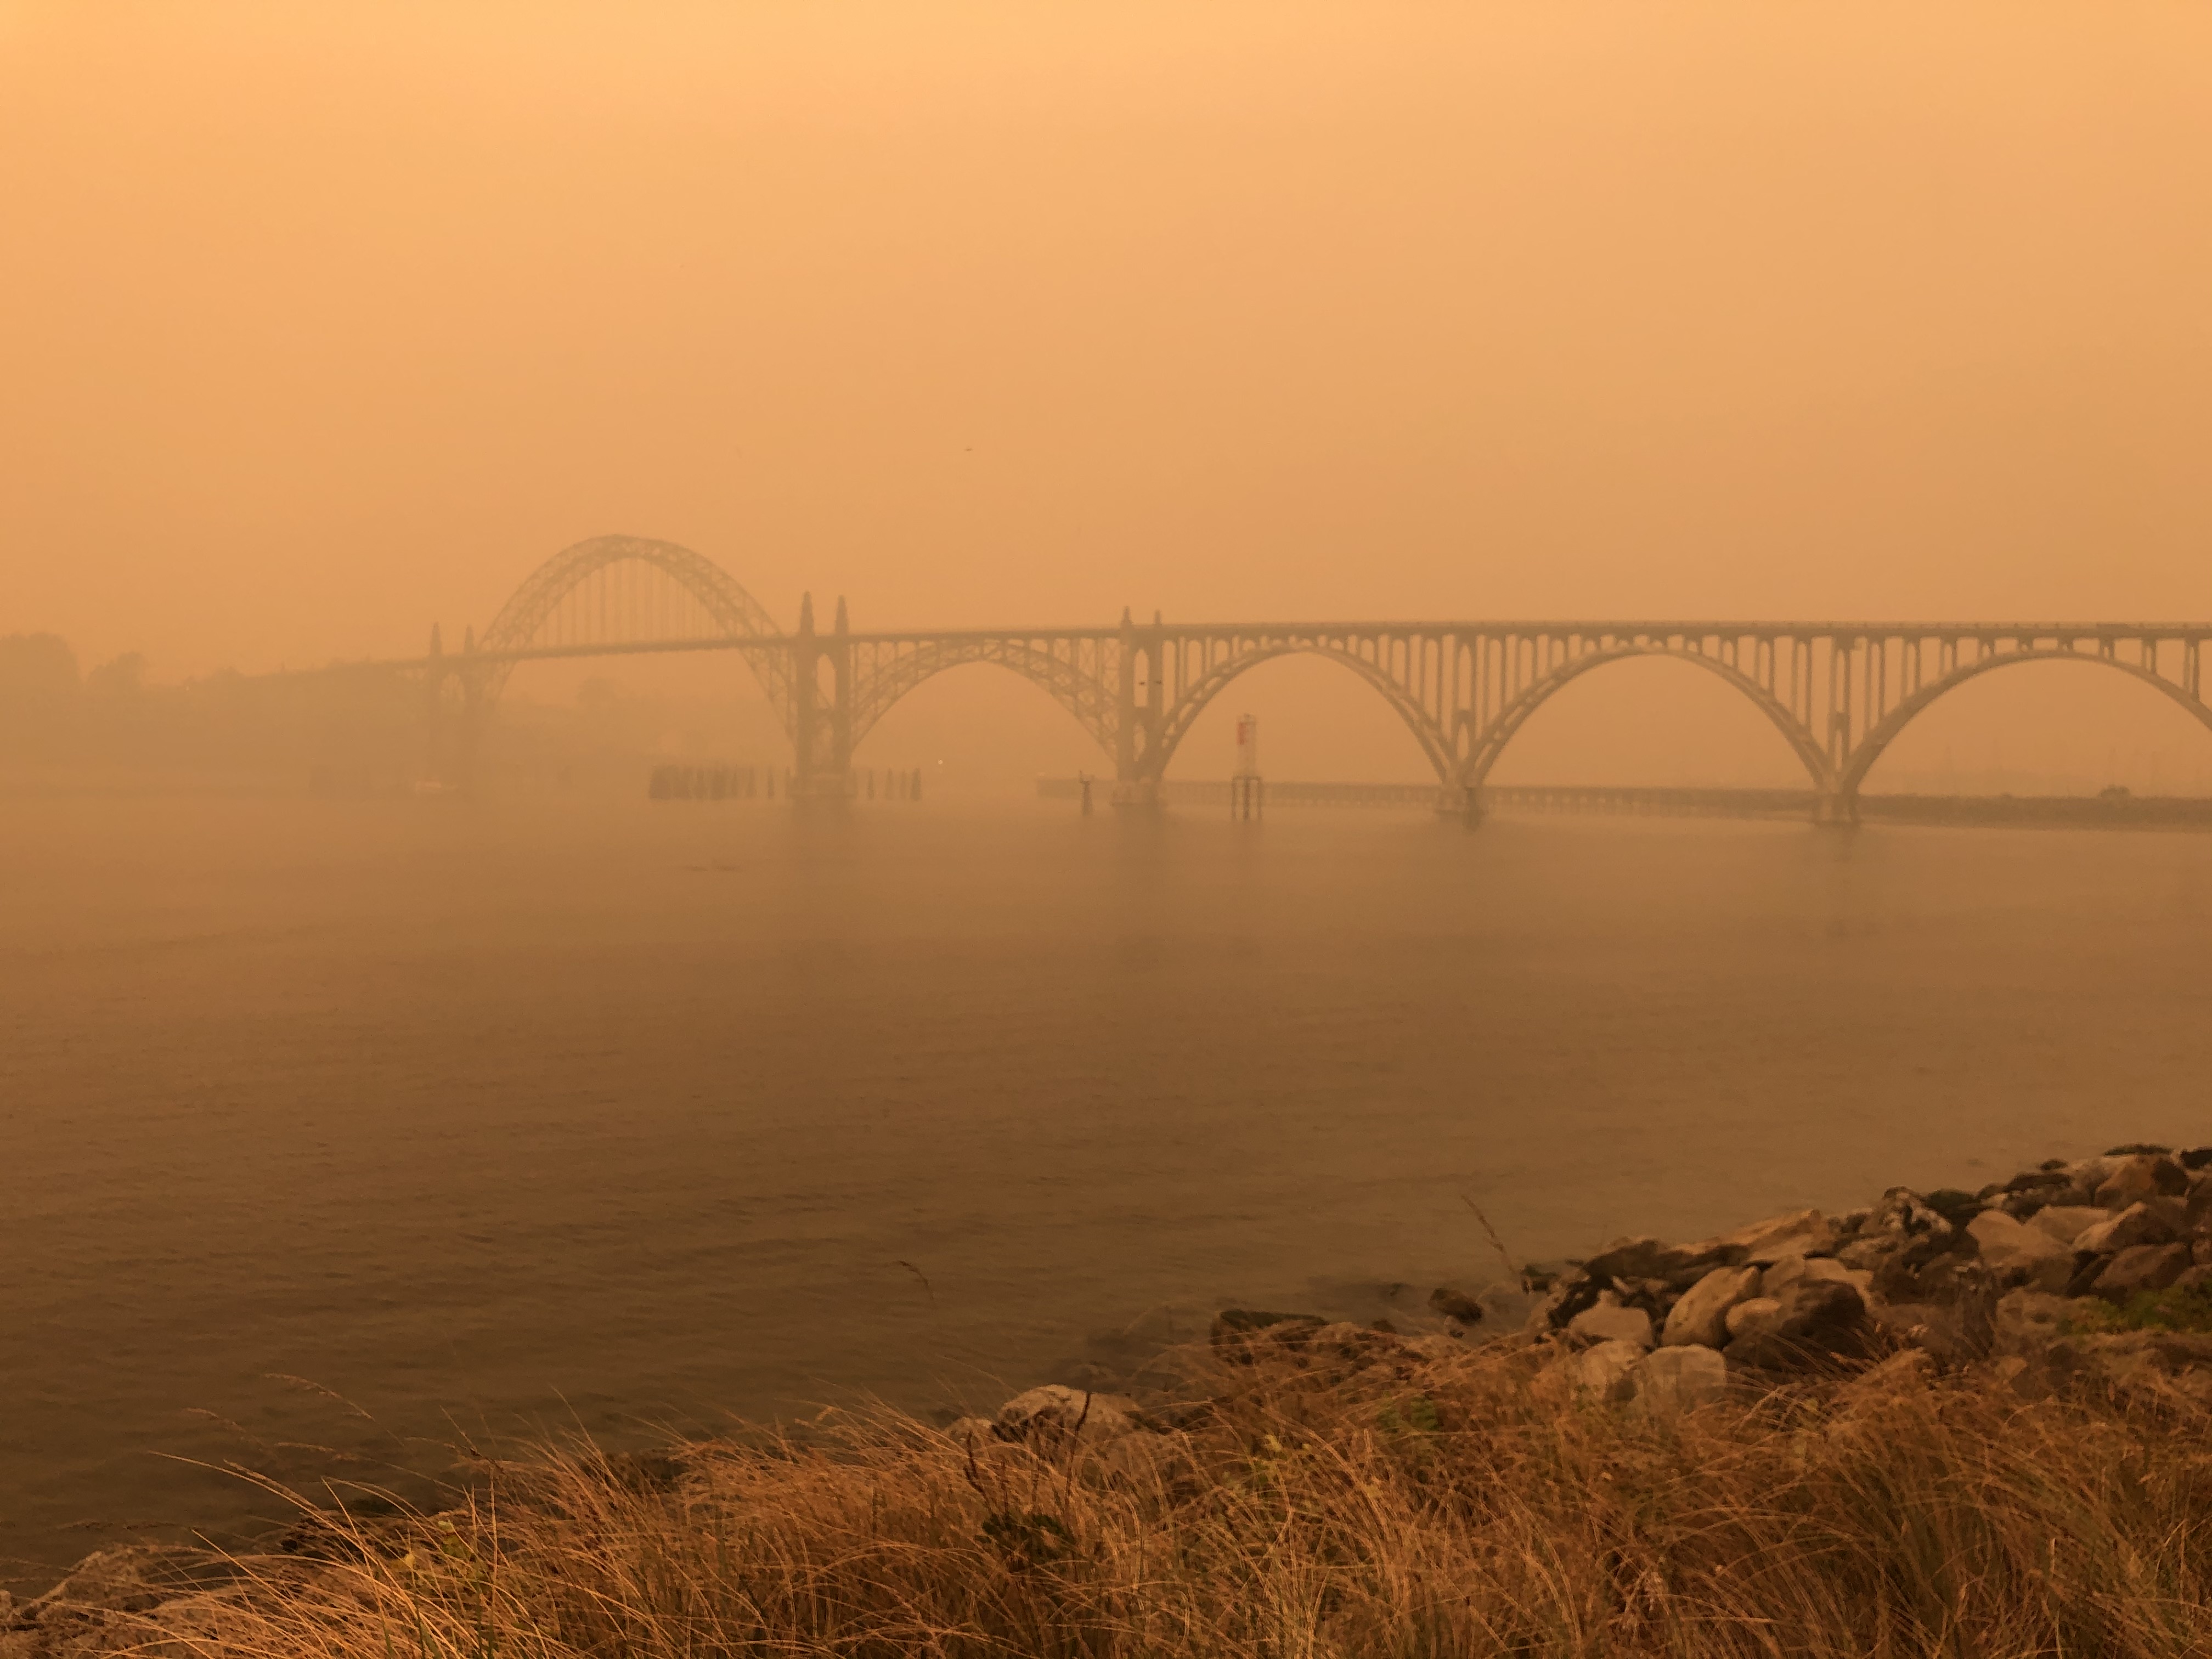 Figure 2. The Yaquina Bay Bridge was shrouded in smoke during an early October fire. Credit: Dr.Liz Perotti[/caption]
This article was written by Craig Risien and Jonathan Fram of the Coastal Endurance Array team.
Non-OOI data sources
NASA satellite images: https://earthobservatory.nasa.gov/images/147261/a-wall-of-smoke-on-the-us-west-coast
Florence air quality: https://oraqi.deq.state.or.us/home/map
Corvallis and Lincoln City air quality: https://www.purpleair.com/
Read More
Delineating Biochemical Processes in the Northern California Upwelling System
Excerpted from the OOI Quarterly Report, 2022.
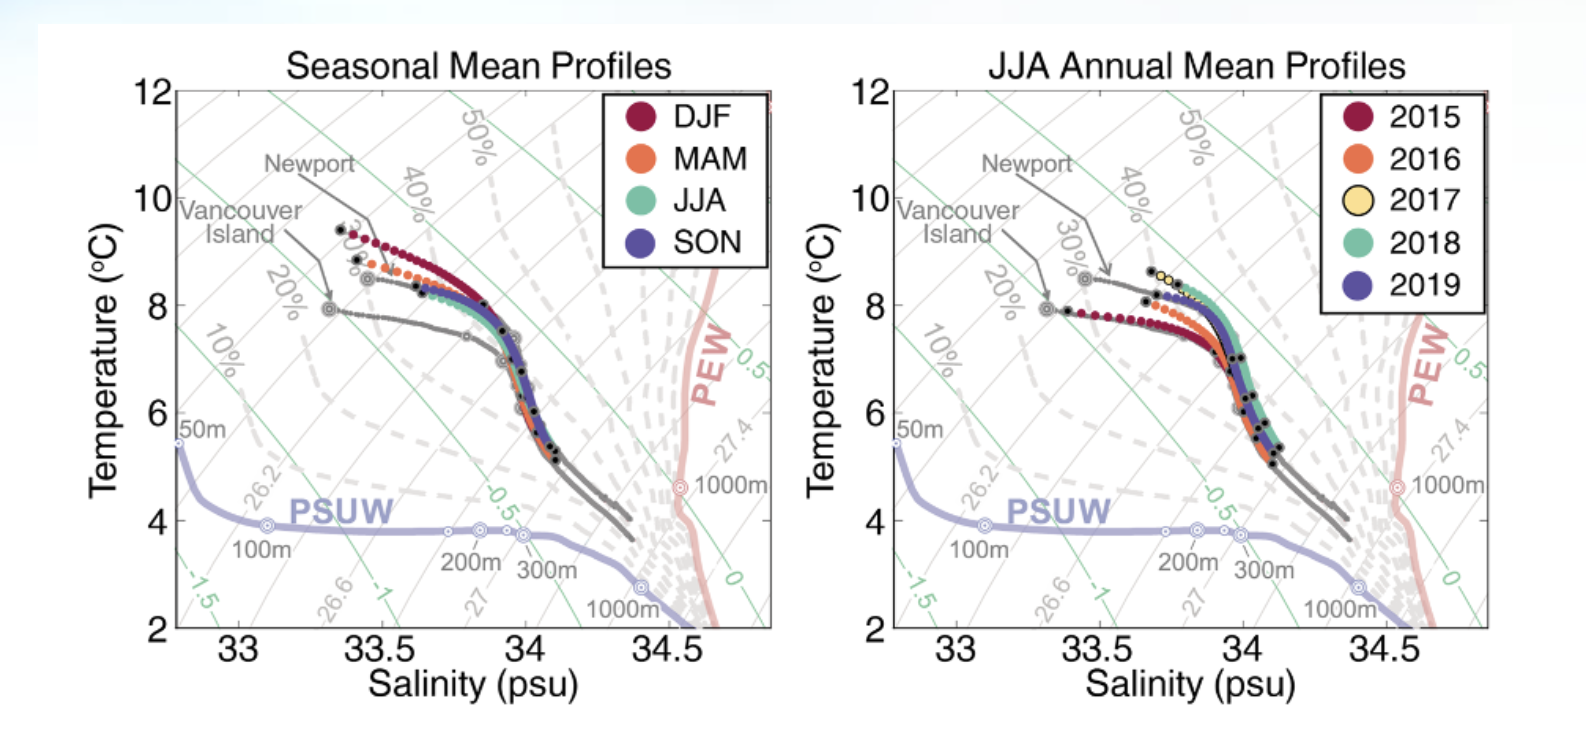
[media-caption path="/wp-content/uploads/2020/10/Endurance-Array-Science-Highlight.png" link="#"]Figure 19: Regional T/S variability at the Washington offshore profiling mooring. The end member Pacific Subarctic Upper Water (PSUW) and Pacific Equatorial Water (PEW) masses are indicated on each plot at the left and right respectively. T/S at the mooring is a mixture of PSUW and PEW. The left plot shows the seasonal variability. The right plot shows interannual variability in summer. Interannual variability from 100-250m exceeds seasonal variability. In 2015, T/S at the mooring is closer in character to climatological averages at Vancouver Island, BC while in 2018, T/S at the mooring is similar to that south of Newport, OR. Figure from Risien et al. adapted from Thomson and Krassovski (2010).[/media-caption]
Risien et al. (2020) presented over five years of observations from the OOI Washington offshore profiling mooring. First deployed in 2014, the Washington offshore profiler mooring is on the continental slope about 65 km west of Westport, WA. Its wire Following Profiler samples the water column from 30 m depth down to 500 m, ascending and descending three to four times per day. Traveling at approximately 25 cm/s, the profiler carries physical (temperature, salinity, pressure, and velocity) and biochemical (photosynthetically active radiation, chlorophyll, colored dissolved organic matter fluorescence, optical backscatter, and dissolved oxygen) sensors. The data presented included more than 12,000 profiles. These data were processed using a newly developed Matlab toolbox.
The observations resolve biochemical processes such as carbon export and dissolved oxygen variability in the deep source waters of the Northern California Upwelling System. Within the Northern California Current System, over the slope there is a large-scale north-south variation in temperature and salinity (T/S). Regional T/S variability can be understood as a mixing between warmer, more saline Pacific Equatorial Water (PEW) to the south, and fresher, colder Pacific Subarctic Upper Water (PSUW) to the north. Preliminary results show significant interannual variability of T/S water properties between 100-250 meters. In summer, interannual T/S variability is larger than the mean seasonal cycle (see Fig 19). While summer T/S variability is greatest on the interannual scale, T/S does covary on a seasonal scale with dissolved Oxygen (DO), spiciness and Particulate Organic Carbon (POC). In particular, warmer, more saline water is associated with lower DO in fall and winter.
Risien, C.M., R.A. Desiderio, L.W. Juranek, and J.P. Fram (2020), Sustained, High-Resolution Profiler Observations from the Washington Continental Slope , Abstract [IS43A-05] presented at Ocean Sciences Meeting 2020, San Diego, CA, 17-21 Feb.
Thomson, R. E., and Krassovski, M. V. (2010), Poleward reach of the California Undercurrent extension, J. Geophys. Res., 115, C09027, doi:10.1029/2010JC006280.
Read More
See the Data Explorer in Action!
In case you missed it, here is an opportunity to see a live demo of the new Data Explorer tool. OOI Data Deliver Lead Jeff Glatstein provides a quick look at how the Data Explorer was developed. Craig Risien of the Coastal Endurance Array Team follows with a live demonstration of the tool’s capabilities using Endurance Array data to create a data view. Axiom Developer Brian Stone concludes the demo by answering questions and digging deeper into the many features of this outstanding new tool.
Watch now!
https://youtu.be/BBxdii0M-nA
Read More
Partnerships Expand Use of OOI Data
The OOI’s primary mission is to make its data widely available to multiple users. One way it achieves this, on a broad scale, is by establishing partnerships with other organizations that also distribute ocean observing data. For example, OOI currently partners with the Integrated Ocean Observing System (IOOS), which provides integrated ocean information in near real-time and tools and forecasts to apply the data, the National Data Buoy Center (NDBC), which maintains a network of data collecting buoys and coastal stations as part of the National Weather Service, the Global Ocean Acidification Observing Network (GOA-ON), which uses international data to document the status and progress of ocean acidification, and Incorporated Research Institutions for Seismology (IRIS), a consortium of over 120 US universities dedicated to the operation of science facilities for the acquisition, management, and distribution of seismological data.
NANOOS: Making data relevant for decision-making
NANOOS, the Northwest Association of Networked Ocean Observing Systems, which is part of IOOS, has been operational since 2003, establishing trusting, collaborative relationships with those who use and collect ocean data in the Pacific Northwest. NANOOS has been an exemplary partner in ingesting and using OOI data. Part of its success lies in advance planning. NANOOS, for example, had determined that OOI assets, in addition to achieving the scientific goals for which they were designed, could fill a data void in IOOS assets running north and south in an area between La Push, WA, and the Columbia River, well before the OOI assets came online.
[media-caption type="image" class="external" path="https://oceanobservatories.org/wp-content/uploads/2020/09/Screen-Shot-2020-09-22-at-2.25.24-PM.png" alt="Endurance Array" link="#"]OOI’s Coastal Endurance Array provides data from the north and south in an important upwelling area in the northeastern Pacific. Gliders also traverse this region, with glider data available through both the IOOS Glider Data Assembly Center and the NANOOS Visualization System. Credit: Center for Environmental Visualization, University of Washington.[/media-caption]According to Jan Newton, NANOOS executive director at the University of Washington, “One of the reasons NANOOS is so effective is that our guiding principle is to be cooperative and not compete. If the public is looking for coastal data, for example, we want to make sure they can access it and use it, rather than having them trying to sort through whether it is a product of IOOS or OOI. We operate with the philosophy of maximizing the discoverability and service of the data and OOI has been a great partner in our mission. We’ve been really happy about how this partnership has played out.”
[media-caption type="image" class="external" path="https://oceanobservatories.org/wp-content/uploads/2020/09/Regional-Cable-Array-revised-.jpg" alt="Revised RCA" link="#"]OOI’s Regional Cabled Array also contributes data in the NANOOS region from its Slope Base and the Southern Hydrate Ridge nodes. Credit: Center for Environmental Visualization, University of Washington.[/media-caption]NANOOS has made a huge effort on its data visualization capabilities, so people can not only find data, but look at it in a relative way to use it for forecasting, modeling, and solving real-world problems. OOI data are integral in helping support some of these visualization and modeling efforts, which commonly play a role in situations facing a wide cross-section of society.
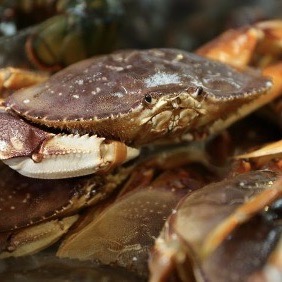
An example of this applicability played out in improved understanding of hypoxia (oxygen-deficient conditions) off the coast of Oregon, which had resulted in mass mortality events of hypoxia-intolerant species of invertebrates and fish, in particular, Dungeness crabs. Allowing access through NANOOS to near real-time oxygen data from OOI assets has allowed the managers and fishers to come up with some plausible solutions to maintaining this valuable resource. The Dungeness crab fishery is the most valuable single-species fishery on the U.S. West Coast, with landed values up to $250 million per year, and plays an enormous cultural role in the lives of tribal communities in the region, as well.
[media-caption type="image" class="external" path="https://oceanobservatories.org/wp-content/uploads/2020/09/Dungeness-Crab.jpg" alt="Dungeness Crab" link="#"]OOI oxygen data have helped resource managers and fishers maintain the valuable Dungeness crab fishery, which is the most valuable single-species fishery on the U.S. West Coast.[/media-caption]Researcher Samantha Siedlecki, University of Connecticut, reports that in late June of 2018, for example, fishers in the region were pulling up dead crabs in pots without knowing the cause. Scientists accessed near real-time OOI observations through the NANOOS data portal and found that the Washington Inshore Surface Mooring of the Coastal Endurance Array (EA) had measured hypoxia from June 7th onwards. So, the data confirmed real-life conditions and explained the crab mortalities.
This is important because such occurrences are helping to confirm models and enhance forecasting to better manage these events by providing guidance to fishers and resource managers. In this instance, the forecast indicates what regions will likely require reduced time for crabs to remain “soaking,” caged in the environment during hypoxia events, to ensure crabs are captured alive, and also aid in spatial management of the fishery itself. OOI data will play a role in continual improvements in forecasting in this region and the fishery by providing data during winter months, ensuring historical data are available and quality controlled for use in forecasting, and continuing to serve data in near real-time.
Adds Newton, “I can’t tell you how many OOI and other PIs come up and tell me how they love that their data are having a connection to real world problems and solutions. It makes their research go farther with greater impact by being part of this NANOOS network.”
Explains Craig Risien, Coastal Endurance Array senior technician at Oregon State University, “OOI is collecting an incredible wealth of data, offering a treasure chest of material to write papers, write proposals, include in posters, and now it is being used in practical ways for finding scientific solutions to environmental problems. Every time we look at the data, there’s a new story to tell. We always find something new, something interesting, and encourage everyone to have a look and experience the same usefulness and excitement about OOI data.”
Sharing OOI data
The OOI is in talks with the IOOS regions serving the Northeast Atlantic and the Mid-Atlantic to see how OOI data might enhance their networks, as well. The OOI also has been providing data to the National Data Buoy Center since 2016, supplementing the data collected by NDBC’s 90 buoys and 60 Coastal Marine Automated Network stations, which collectively provide critical data on unfolding weather conditions. And, the OOI has been providing data to Global Ocean Acidification Observing Network (GOA-ON), since mid-2019, ground-truthing on site conditions in real to near real-time, which is critical to understanding conditions contributing to ocean acidification and improving modeling capabilities to determine when it might occur. OOI’s Regional Cabled Array has been providing seismological, pressure and hydrophone data to Incorporated Research Institutions for Seismology (IRIS) since 2014, providing a wealth of data from Axial Seamount and on the Cascadia Margin. For example, on April 24, 2015 a seismic crisis initiated at the summit of Axial Seamount with >8,000 earthquakes occurring in 24 hrs, marking the start of the eruption. Starting at 08:01 that same day, the network recorded ~ 37,000 impulsive events delineating underwater explosions, many of which were associated with the formation of a 127 meter thick lava flow on the northern rift.
Data examples
If you would like to test drive some of the OOI data in NANOOS, NDBC, and GOA-ON, here are some examples below:
IOOS
· OOI data in the NANOOS Visualization System (NVS)
NDBC
· Coastal Endurance Array data (Stations 46097, 46098, 46099, 46100)
· Coastal Pioneer Array data (Stations 44075, 44076, 44077)
· Global Irminger Array data (Station 44078)
GOA-ON
· Coastal Endurance Array data
IRIS
· Regional Cabled Array (While searching within IRIS for OOI data, use the two-letter IRIS network designator “OO.”)
Read More
Coastal Endurance Array Dissolved Oxygen Webinar Online
If you missed the 16 September 2020 Coastal Endurance Array’s webinar on dissolved oxygen, you can view it below. It’s an easily digestible webinar series in four short sections, detailing the Coastal Endurance Array’s dissolved oxygen data, how they are collected, and what is being learned from this collection of five+ years of data.
https://youtu.be/NlfPH8X5Vy8
https://youtu.be/2uJYzthlvJs
https://youtu.be/aus7eaDlNtE
https://youtu.be/s7f_6rdBf2w
Read MoreMark Your Calendar: Dissolved Oxygen Webinar, 9 September 2020
 Coastal Endurance Array webinar presenters: Ed Dever, Chris Wingard, Stuart Pearce, Craig Risien, Jonathan Whitefield, and Jon Fram[/caption]
In this webinar, we present dissolved oxygen (DO) data from the Ocean Observatories Initiative’s (OOI) Coastal Endurance Array off Oregon and Washington. DO is recorded on platforms across OOI. These measurements contribute directly to the OOI science goal of understanding ecosystem changes. The Endurance Array measurements contribute specifically to understanding the seasonal development and synoptic variability of hypoxia. DO measurement platforms on EA include moorings, gliders, and profilers.
The webinar will be presented in four pre-recorded sections with a live Q and A following each section. In part one, we will provide an overview of OOI DO measurements across OOI. The remaining three parts will cover surface mooring time series, glider measurements, and profiler measurements respectively. For each of these platforms, we will describe the sampling, review quality control procedures and issues, and present example plots. We will focus on recent data, including telemetered data collected since the latest Endurance cruise in July 2020. We will present the DO time series, along with related observations of wind velocity and ocean temperature.
Please register in advance for this webinar here. After registering, you will receive a confirmation email containing information about how to join the webinar.
The webinar sections will be posted to oceanobservatories.org. Pre-registered webinar participants can sign up for follow-up discussions on accessing these OOI data on 10 September. Individuals can also contact the OOI HelpDesk and set up similar discussions at a later date.
Read More
Successful Orphaned Equipment Recovery
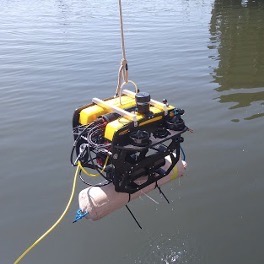
The Endurance Array team at Oregon State University (OSU) achieved a first in early August. They succeeded in recovering a Coastal Surface Piercing Profiler (CSPP) and its anchor from the Oregon Shelf site with an ROV customized for this endeavor.
The team boarded the 54-foot R/V Elakha, which is owned and operated by Oregon State University on Thursday 5 August, to implement a recovery scheme developed by OSU-OOI technicians Alex Wick and Ian Black.
Wick and Black also created and configured the line pack and other materials needed by the ROV, and led operations on deck. Jeremy Fox, captain of the R/V Oceanus, operated the ROV. The goal was to retrieve the orphaned CSPP from the site.
“This successful mission demonstrates the creativity and determination of the Endurance Array team to retrieve equipment from the seafloor,” said Jonathan Fram, project manager for the Endurance Team Array at OSU. “When we lose a piece of equipment, we do everything in our power to retrieve it not only because of the expense of the equipment and the scientific value of data it contains, but because we are required to recover what we deploy. OSU-OOI has recovered orphaned equipment with ROVs in the past, but the recovery scheme used here was much more effective and efficient.”
The mission is shown in the pictures below:
[media-caption type="image" class="external" path="https://oceanobservatories.org/wp-content/uploads/2020/08/Elakha.jpg" alt="Elakha" link="#"]OSU’s 54″ R/V Elakha, the Chinook trading language word for sea otter, is powered by a single, 600-horsepower diesel engine with a range of about 575 miles. OOI uses it for day trips from Newport to service Oregon Line moorings and gliders.Credit: OSU, College of Earth, Ocean, and Atmospheric Sciences[/media-caption] [media-caption type="image" class="external" path="https://oceanobservatories.org/wp-content/uploads/2020/09/ROVwithLinePack.jpeg" alt="ROV-with-recovery-line" link="#"]ROV with recovery line pack underneath. Credit: Alex Wick, OSU[/media-caption] [media-caption type="image" class="external" path="https://oceanobservatories.org/wp-content/uploads/2020/08/Picture-by-ROV-.jpg" alt="ROV underneath" link="#"] The ROV took this picture of the upside-down anchor. The team initially wasn’t able initially to recover the anchor because the white recovery floats were on bottom, so they didn’t float up when they were released. Here, the ROV arm is holding a hook with a blue line attached to it. Credit: Jeremy Fox, OSU[/media-caption] [media-caption type="image" class="external" path="https://oceanobservatories.org/wp-content/uploads/2020/08/Anchor-hooked.jpg" alt="Anchor attached" link="#"]This is a close-up of the anchor with the recovery line successfully attached. With the anchor secured, the team recovered the ROV, detached the blue line from the line pack bag, and then winched up the anchor and attached profiler. Credit: Jeremy Fox, OSU [/media-caption] [media-caption type="image" class="external" path="https://oceanobservatories.org/wp-content/uploads/2020/09/onTheWayHome-scaled.jpg" alt="Ian at stern" link="#"]Ian Black sits on the deck of the R/V Elakha after a successful mission to recover an orphaned CSPP and anchor. Credit: Jeremy Fox, OSU [/media-caption] Read MoreEvent and Seasonal Scale Variability of Surface Heat and Momentum Fluxes
Excerpted from the OOI Quarterly Report, 2020.
Endurance Array: Event and Seasonal Scale Variability of Surface Heat and Momentum Fluxes off Oregon and Washington
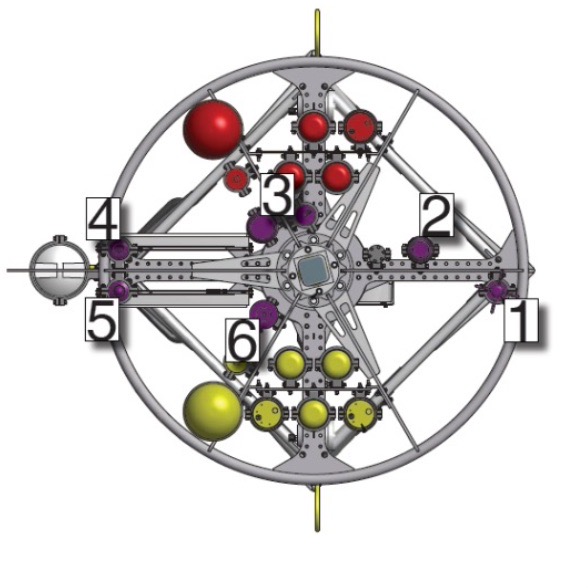
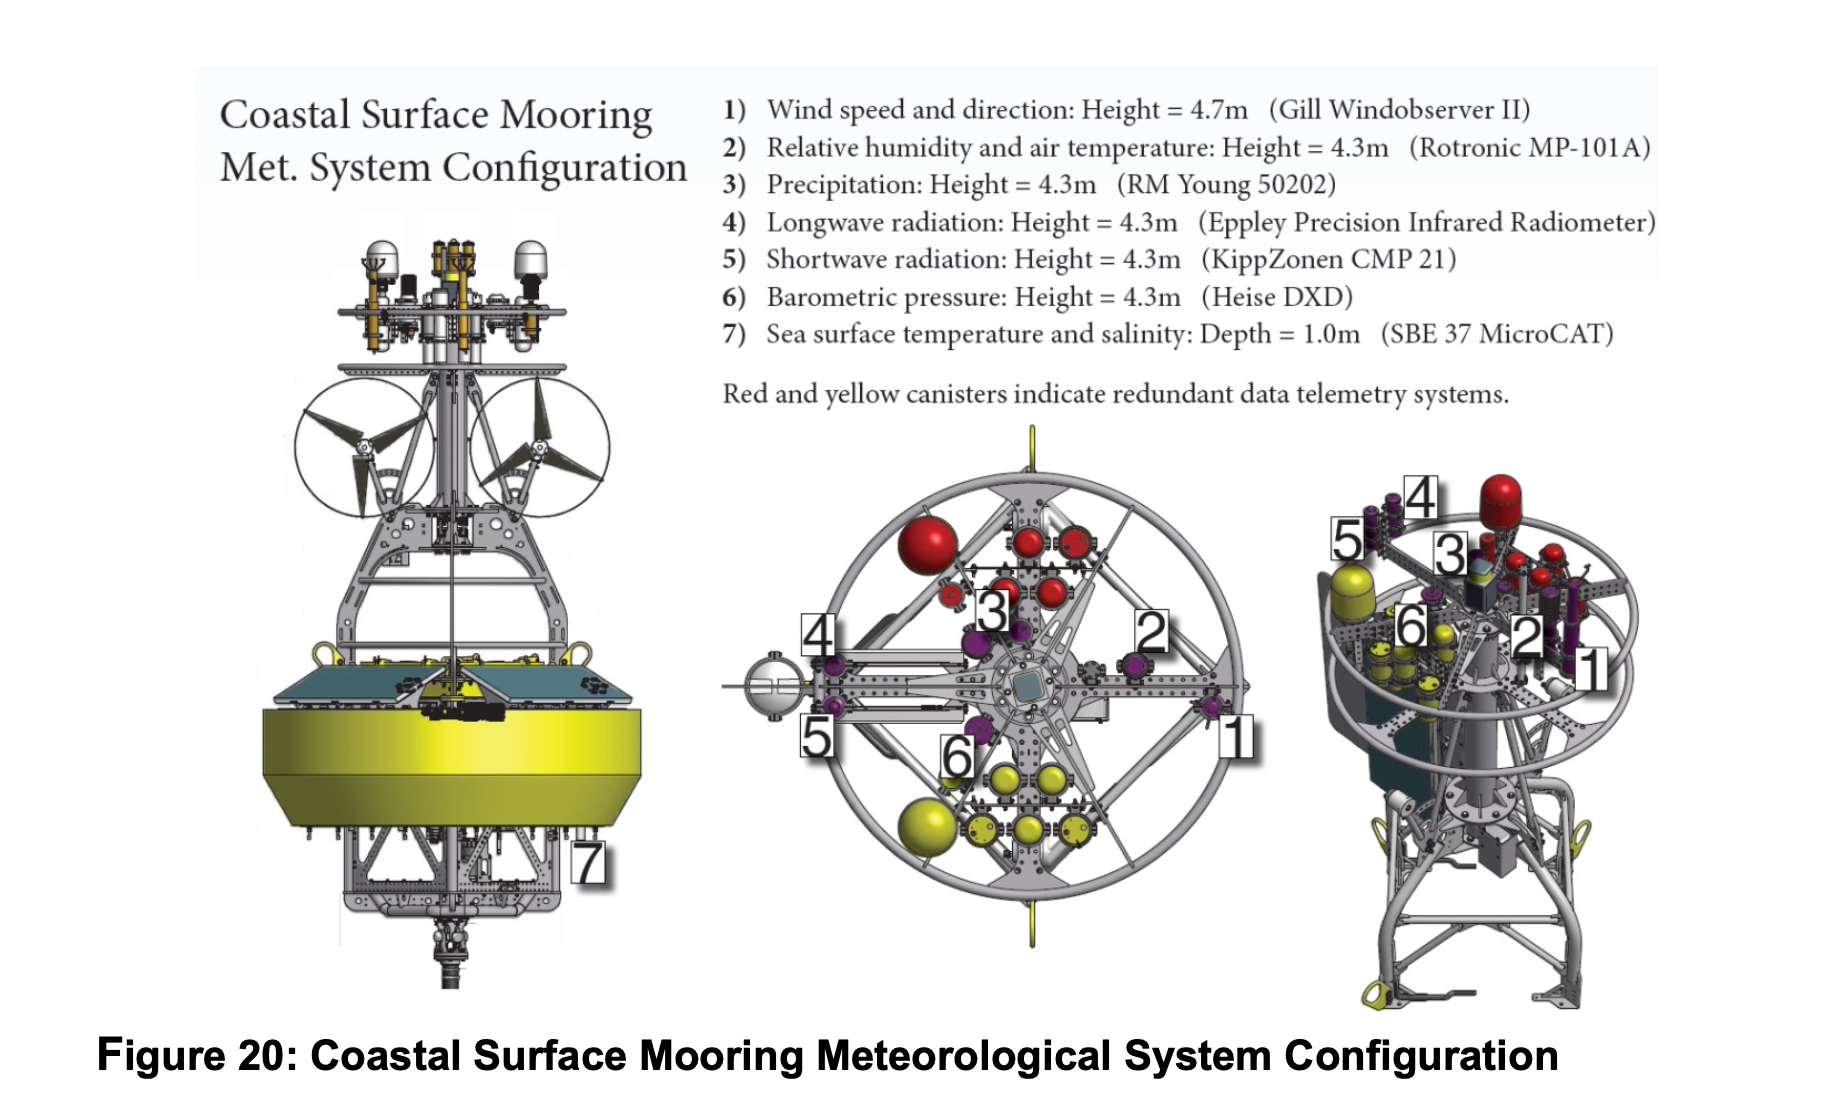
As part of the NSF-funded Ocean Observatories Initiative (OOI) Coastal and Global Scale Arrays, surface buoy meteorological measurements are made using the Air-Sea Interaction Meteorology (ASIMET) package (Figure 20). These measurements are reported on in Dever, E.P, J.P. Fram, C.M. Risien, R.A. Desiderio, C.E. Wingard (2020), Event and Seasonal Scale Variability of Surface Heat and Momentum Fluxes off Oregon and Washington, Abstract [A144A-2411] presented at Ocean Sciences Meeting 2020, San Diego, CA, 17-21 Feb. Radiative and bulk surface fluxes calculated from these measurements are provided as OOI data products. Both the measurements and the estimated fluxes are available through the OOI Data Portal as are all the metadata required to produce these fluxes (raw data, calibration coefficients, data product specifications, data product algorithms etc.).
On the Endurance Array, ASIMET measurements are made at four locations over the Oregon and Washington shelf and slope. These locations lie within the northern California Current Marine Ecosystem. Here upwelling favorable wind forcing and atmospheric conditions occur in spring and summer months with forcing in other months driven by passing low pressure systems. The timing of both the spring transition to upwelling and the fall transition to storm forcing varies from year to year as does the strength of individual events within each season. Upwelling events are associated with strong net shortwave and latent heat fluxes. Storm events are associated with weak net shortwave fluxes and latent fluxes that vary in strength.
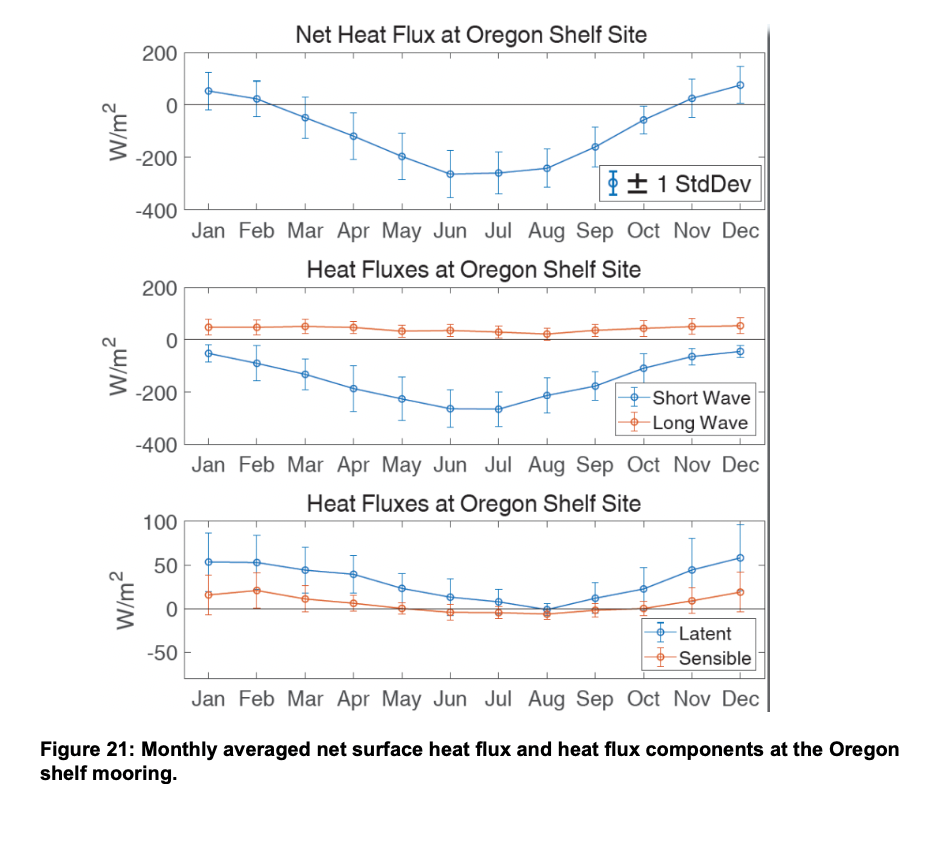
Machine to machine (M2M) calls were used to read in hourly bulk surface fluxes from OOI Endurance Array moorings from their initial deployments in April 2015 through February 2020. OOI data product fluxes are calculated with TOGA-COARE and other community standard algorithms. Monthly averages of OOI Endurance Array flux data compare well with one another. Both the Oregon and Washington shelves are subject to heating on an annually averaged basis. The Oregon Shelf mooring (Figure 21) is typical. Late fall and winter show net fluxes from the ocean to the atmosphere. All other months show heat flux into the ocean due to insolation.
Read More

