
Posts Tagged ‘Coastal Endurance Array’
Event and Seasonal Scale Variability of Surface Heat and Momentum Fluxes
Excerpted from the OOI Quarterly Report, 2020.
Endurance Array: Event and Seasonal Scale Variability of Surface Heat and Momentum Fluxes off Oregon and Washington
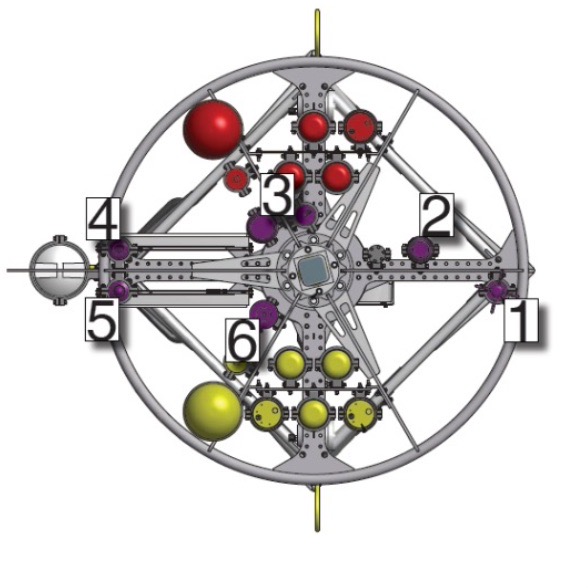
As part of the NSF-funded Ocean Observatories Initiative (OOI) Coastal and Global Scale Arrays, surface buoy meteorological measurements are made using the Air-Sea Interaction Meteorology (ASIMET) package (Figure 20). These measurements are reported on in Dever, E.P, J.P. Fram, C.M. Risien, R.A. Desiderio, C.E. Wingard (2020), Event and Seasonal Scale Variability of Surface Heat and Momentum Fluxes off Oregon and Washington, Abstract [A144A-2411] presented at Ocean Sciences Meeting 2020, San Diego, CA, 17-21 Feb. Radiative and bulk surface fluxes calculated from these measurements are provided as OOI data products. Both the measurements and the estimated fluxes are available through the OOI Data Portal as are all the metadata required to produce these fluxes (raw data, calibration coefficients, data product specifications, data product algorithms etc.).
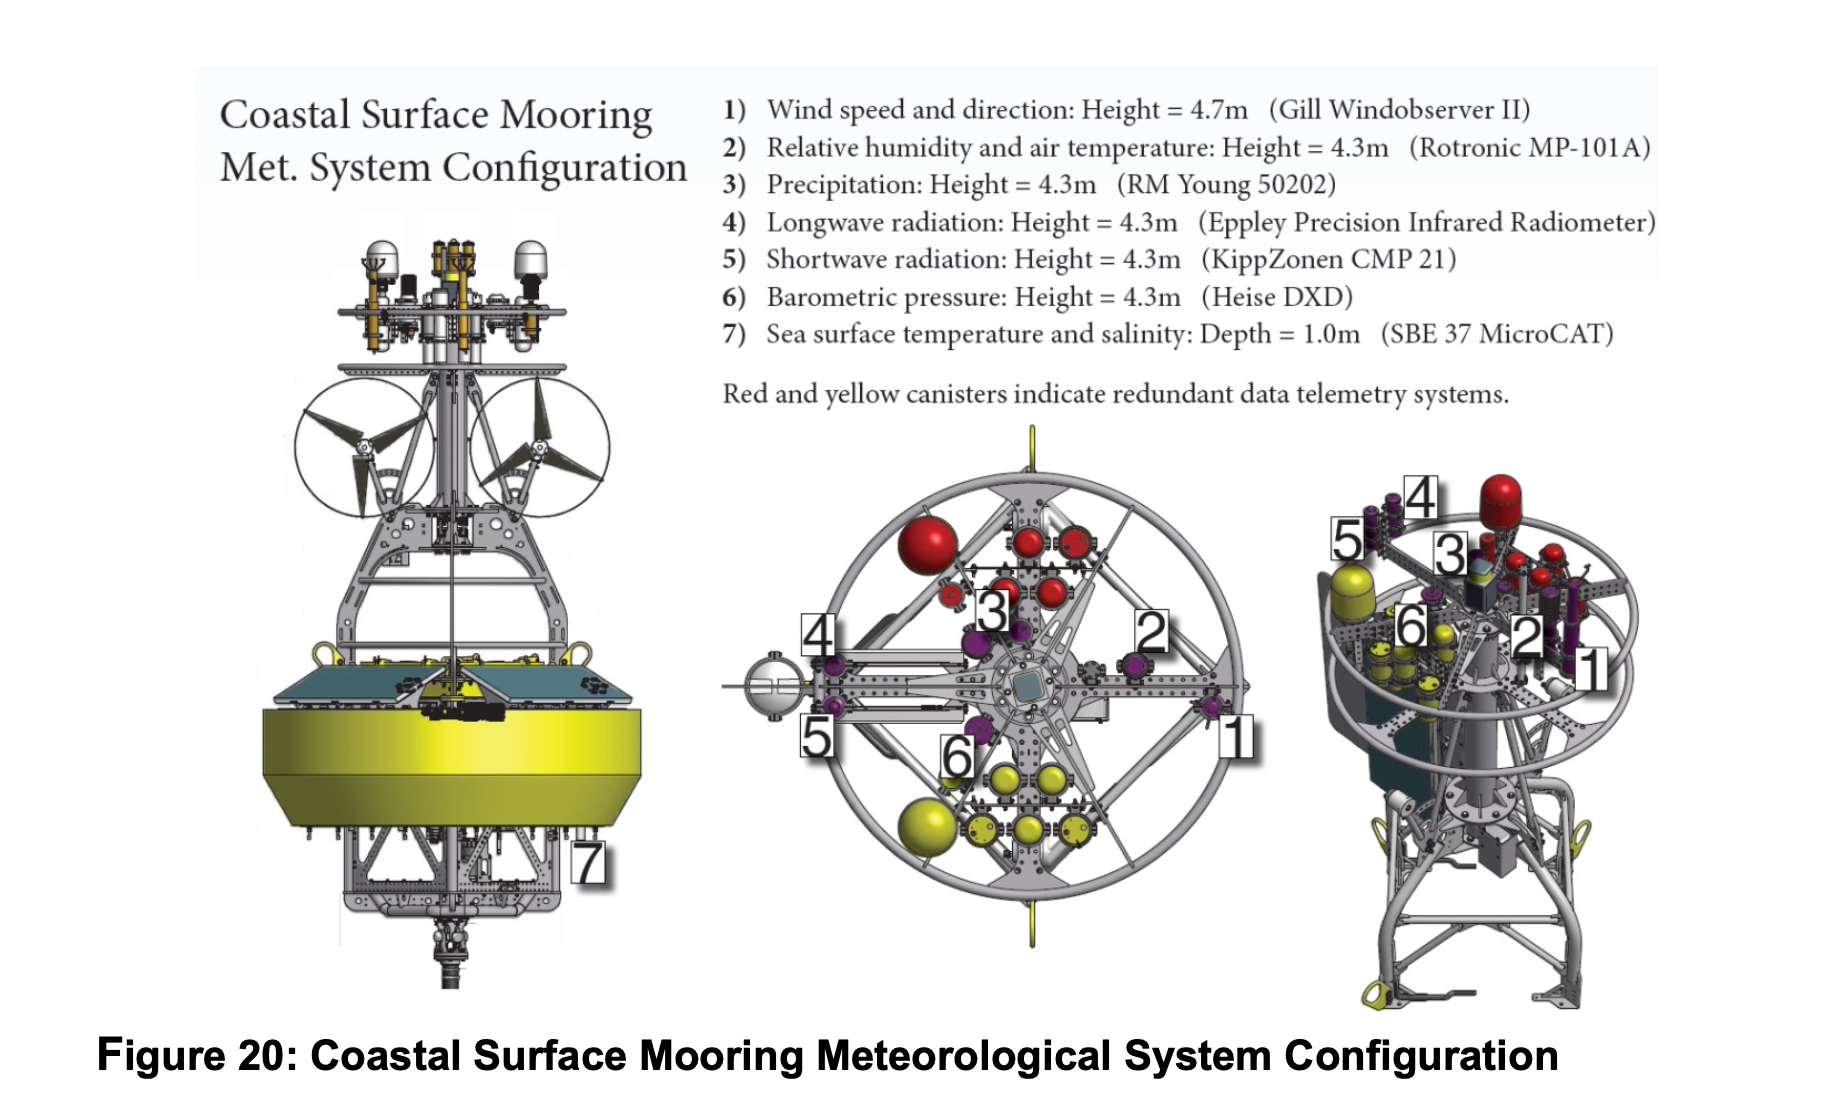
On the Endurance Array, ASIMET measurements are made at four locations over the Oregon and Washington shelf and slope. These locations lie within the northern California Current Marine Ecosystem. Here upwelling favorable wind forcing and atmospheric conditions occur in spring and summer months with forcing in other months driven by passing low pressure systems. The timing of both the spring transition to upwelling and the fall transition to storm forcing varies from year to year as does the strength of individual events within each season. Upwelling events are associated with strong net shortwave and latent heat fluxes. Storm events are associated with weak net shortwave fluxes and latent fluxes that vary in strength.
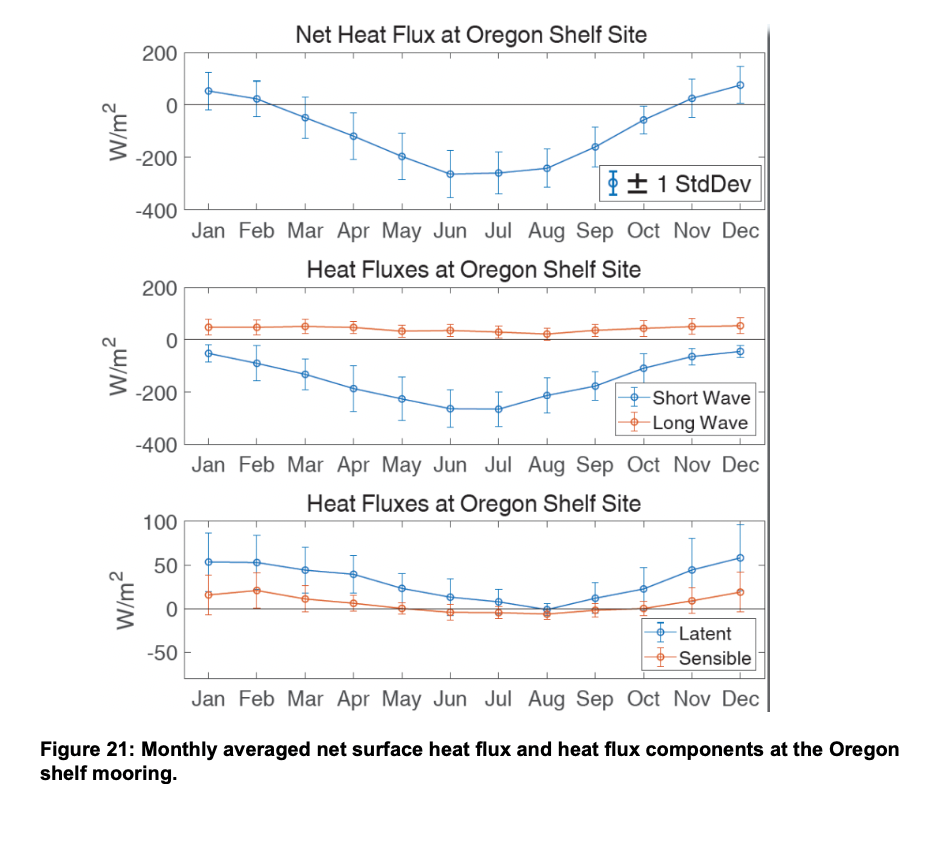
Machine to machine (M2M) calls were used to read in hourly bulk surface fluxes from OOI Endurance Array moorings from their initial deployments in April 2015 through February 2020. OOI data product fluxes are calculated with TOGA-COARE and other community standard algorithms. Monthly averages of OOI Endurance Array flux data compare well with one another. Both the Oregon and Washington shelves are subject to heating on an annually averaged basis. The Oregon Shelf mooring (Figure 21) is typical. Late fall and winter show net fluxes from the ocean to the atmosphere. All other months show heat flux into the ocean due to insolation.
Read More
Endurance Array 13 Expedition: Clear Skies, Smooth Operations
The Endurance Array 13 Team had remarkably fair weather, blue skies, and pleasant sailing conditions during their 13-day expedition to recover and deploy equipment at the Array in the northeast Pacific Ocean. The weather was remarkable in that the team is usually in the northern Pacific during the spring and the fall, when the seas are not so forgiving and even in summer strong northerly winds can restrict operations. Because of COVID-19 restrictions this year, the Endurance Array spring and fall cruises were combined into this July cruise.
[caption id="attachment_16435" align="alignright" width="300"]
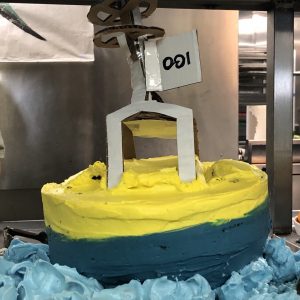
Cake made in honor of the Endurance Array 13 expedition. Credit: R/V Thomas G. Thompson[/caption]
According to Ed Dever, who leads the Coastal Endurance Array team, the only thing better than the weather was the excellent support from both the University of Washington’s R/V Thomas G. Thompson crew and the National Oceanic and Atmospheric Administration (NOAA) Marine Operations Center – Pacific (MOC-P) staff. “Their support started in April after the cancellation of the planned spring Endurance cruise. Over the course of the next two months, Project Manager and Chief Scientist Jon Fram worked with UW and NOAA to schedule and implement this cruise with very little advance notice and a constantly evolving COVID-19 situation. COVID-19 mitigation measures included testing and a 14-day quarantine for the crew and science party and socially distanced procedures for access to the NOAA MOC-P pier and for loading and unloading the ship. Thanks to the cooperative, can-do spirit of all involved, everything went well at the pier and at sea.”
The team left Newport, Oregon aboard the R/V Thomas G. Thompson on 3 July, returning to port twice to offload recovered equipment and to pick up equipment to be deployed. Thirty-four people were onboard the Thompson—11 from OOI, two marine technicians, and 21 members of the ship’s crew.
Like the good weather and smooth seas, the expedition went smoothly, with the exception of one profiler not being recovered and one glider that had to be recovered shortly after deployment. Over the course of the 13 days at sea, the team replaced eight moorings and deployed two additional nearshore profilers. These range in size from 400-pound profilers attached to 700-pound anchors to 8,000-pound buoys with 11,000-pound multi-function nodes, which are at the base of surface moorings, serving as anchors as well as platforms to affix instruments.
The team also successfully deployed three gliders that are collecting data throughout the water column as they transect across the continental shelf. The scientific party also conducted 14 CTD casts, which provide a number of useful measurements. The CTDs measure conductivity, temperature, and depth that can be used to calculate salinity and density. These CTD casts also included instruments that measure dissolved oxygen, chlorophyll, and suspended particle concentration. The CTD frame also had a rosette of collections bottles, which are used to sample water at the depths of the deployed instruments. The casts and bottle samples are then used to check the calibration of the deployed instruments.
With the longer-than-normal time in the water, the recovered equipment was more bio-fouled than during previous expeditions. But, there was some good news here in that the team found that the ultraviolet anti-fouling lights on the spectral irradiance (SPKIR) and dissolved oxygen (DOSTA) sensors kept the sensors clear and functional after nine months in the water.
The northern Pacific was alive with life as the team labored aboard the Thompson. The team and crew sighted orcas, mola molas, humpback whales, sharks, Pacific white-sided dolphins and a large red plankton bloom. During the journey, the team also conducted a virtual tour of the ship for Oregon State University for students participating in this year’s virtual Research Experience for Undergraduate program and Chief Scientist Jonathan Fram was interviewed by AltaSea in front of a live audience.
The 13 days at sea turned out to be a lucky 13, as evidenced in the pictures below:
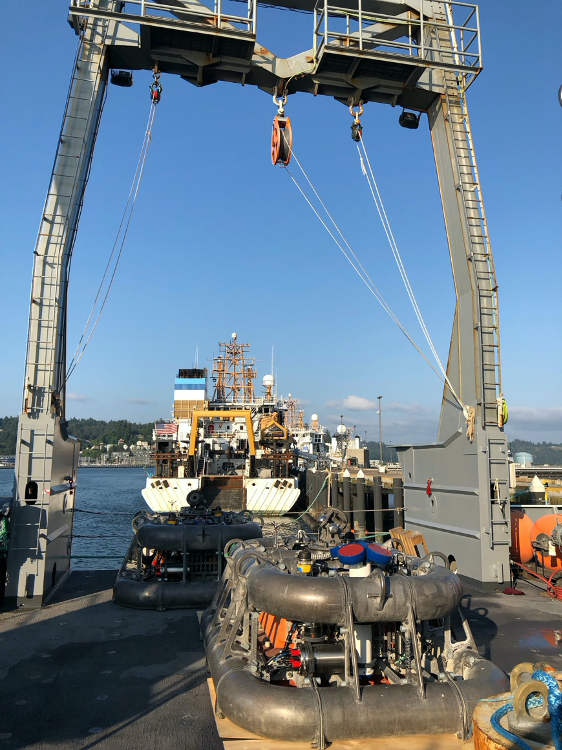
[caption id="attachment_16427" align="alignleft" width="400"] After a three-month delay to respond to COVID-19, the OOI Endurance cruise prepares to leave Newport, OR, aboard the University of Washington’s R/V Thomas G. Thompson at the NOAA Marine Operations Center-Pacific. Two instrumented bottom landers (multifunction nodes in OOI speak) are visible under the Thompson‘s A-frame. To the stern of the Thompson is NOAA’s ship Oscar Dyson. Credit: Ed Dever, University of Oregon[/caption]
[caption id="attachment_16428" align="alignleft" width="284"]
After a three-month delay to respond to COVID-19, the OOI Endurance cruise prepares to leave Newport, OR, aboard the University of Washington’s R/V Thomas G. Thompson at the NOAA Marine Operations Center-Pacific. Two instrumented bottom landers (multifunction nodes in OOI speak) are visible under the Thompson‘s A-frame. To the stern of the Thompson is NOAA’s ship Oscar Dyson. Credit: Ed Dever, University of Oregon[/caption]
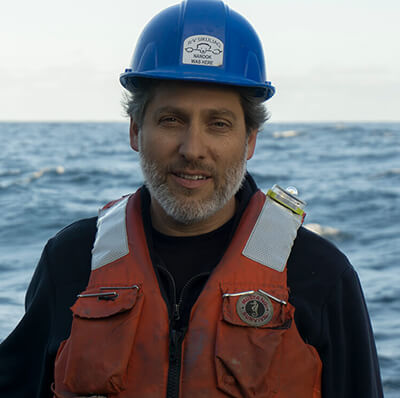
[caption id="attachment_16428" align="alignleft" width="284"] Endurance 13 cruise Chief Scientist Jon Fram applies copper tape to instruments to protect them from biofouling. The two instruments shown measures carbon dioxide in air and at the surface just below the buoy (top) and salinity and temperature (bottom). Credit: Ed Dever, Oregon State University[/caption]
[caption id="attachment_16429" align="alignleft" width="300"]
Endurance 13 cruise Chief Scientist Jon Fram applies copper tape to instruments to protect them from biofouling. The two instruments shown measures carbon dioxide in air and at the surface just below the buoy (top) and salinity and temperature (bottom). Credit: Ed Dever, Oregon State University[/caption]
[caption id="attachment_16429" align="alignleft" width="300"] It’s always something. OOI technician’s Kristin Politano and Marnie Jo Zirbel prep buoy well instruments for deployment during the Endurance 13 Operations and Management Cruise. Credit: Ed Dever, Oregon State University[/caption]
[caption id="attachment_16439" align="aligncenter" width="500"]
It’s always something. OOI technician’s Kristin Politano and Marnie Jo Zirbel prep buoy well instruments for deployment during the Endurance 13 Operations and Management Cruise. Credit: Ed Dever, Oregon State University[/caption]
[caption id="attachment_16439" align="aligncenter" width="500"] Endurance 13 Chief Scientist Jon Fram was interviewed before a live audience by AltaSea when he was aboard the R/V Thomas G. Thompson. Credit: AtlaSea and Aimee Wlliams[/caption]
[caption id="attachment_16437" align="aligncenter" width="478"]
Endurance 13 Chief Scientist Jon Fram was interviewed before a live audience by AltaSea when he was aboard the R/V Thomas G. Thompson. Credit: AtlaSea and Aimee Wlliams[/caption]
[caption id="attachment_16437" align="aligncenter" width="478"] The Endurance 13 Array team recovered this surface mooring during its expedition. The wind turbine on the left went missing in a January storm. The turbine on the right was missing two blades. The left solar panel was battered by sea lion. Yet, amazingly the buoy kept relaying data in spite of being battered by the elements! Credit: Jon Fram, Oregon State University[/caption]
[caption id="attachment_16438" align="aligncenter" width="640"]
The Endurance 13 Array team recovered this surface mooring during its expedition. The wind turbine on the left went missing in a January storm. The turbine on the right was missing two blades. The left solar panel was battered by sea lion. Yet, amazingly the buoy kept relaying data in spite of being battered by the elements! Credit: Jon Fram, Oregon State University[/caption]
[caption id="attachment_16438" align="aligncenter" width="640"] After 13 days at sea, the R/V Thomas G. Thompson returned to Newport, Oregon on 16 July. Only after the final equipment of the third leg was offloaded could the crew and scientific party disembark to be reunited with family and friends after nearly a month apart. Credit: Sue Zemliak, Otter Rock, Oregon[/caption]
Read More
After 13 days at sea, the R/V Thomas G. Thompson returned to Newport, Oregon on 16 July. Only after the final equipment of the third leg was offloaded could the crew and scientific party disembark to be reunited with family and friends after nearly a month apart. Credit: Sue Zemliak, Otter Rock, Oregon[/caption]
Read More Fram Interviewed Live During Endurance 13

UV Anti-fouling Light Keeps Oxygen Sensors Clean
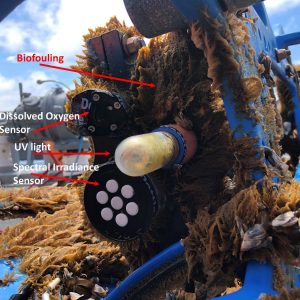
 Biofouling is a real challenge to keeping equipment deployed in the ocean free functioning properly to deliver data to shore. The addition of UV light is helping to keep the oxygen optode sensors clear and recording data. Photo: Jon Fram, Oregon State University.[/caption]
Biofouling is a hazard of keeping equipment in the ocean for long periods of time, particularly when it is near the surface where photosynthesis occurs. For OOI’s arrays that remain in the water for six months or longer, this is a pressing issue because of the need to ensure sensors can continue to collect and transmit data back to shore. The OOI scientists and engineers are always investigating ways to keep biofouling at bay. They recently worked with Aanderaa, which provides OOI’s oxygen optode sensors, to implement a solution to keep oxygen sensors free of biofouling by installing ultra-violet (UV) lights that periodically shine on the instruments’ sensing foil.
As early as 2016, a team of OOI engineers and technicians from Oregon State University, the University of Washington, and Woods Hole Oceanographic Institution began to tackle some of problems with the instruments selected by OOI and to improve the quality of instrument measurements. In October of 2016 AML Oceanographic showed OOI’s instrument group data from Ocean Networks Canada of a UV light used to mitigate biofouling on Aanderaa’s oxygen optodes. The following October, OOI deployed a side-by-side test of two oxygen optodes (one with a UV light pointed at it) at seven meters depth on the Oregon Shelf Surface Mooring. Data from the two sensors tracked each other for six weeks, and then the unprotected sensor fouled. Within weeks, there were daily afternoon spikes of up to twice the oxygen level of the protected sensor, with slightly lower measurements than the unprotected sensor at night due to respiration of the biofilm. The team found that the biofouling signal wasn’t always as dramatic, nor did it always develop in the same period of time after deployment. Physics has a hand in this, too. Sometimes the fouling signal disappeared after a storm cleaned off the sensor.
In summer 2018, OOI started deploying UV-protected oxygen optodes mounted shallower than 70 meters on Surface Moorings. By mid-209, once some initial hardware and deployment issues were resolved, OOI expanded deployment of UV-antifouling from moored dissolved oxygen sensors, to the dissolved oxygen sensors on the Coastal Surface Piercing Profilers, and then to uncabled digital still cameras moored at less than 70 meters depth.
Following the success of the UV-light test on dissolved oxygen sensors, UV antifouling was tested on a moored Pioneer Array spectral irradiance (SPKIR) sensor in 2018. Here too, the testing conducted with Sea Bird Scientific, the SPKIR vendor, confirmed that the UV light did not damage the instrument’s optics. As a result, in 2019, all subsurface OOI spectral irradiance sensors on Surface Moorings were outfitted with UV-antifouling mitigation, as well as the Coastal Surface Piercing Profilers and uncabled digital still cameras moored at less than 70 meters. The team has adjusted the cycle of the UV lights so that they prevent biofouling without damaging the sensors, interfering with measurements, or utilizing too much power.
“While the solution appears simple, it was a long journey to find the right mix of equipment and duration of use to resolve the issue of biofouling for each sensor at each location, “explained Jonathan Fram, project manager for the Coastal Endurance Array at Oregon State University. “An ongoing challenge is the intermittency of biofouling and the many forms it can take, which can make it difficult to properly diagnose the problem. Usually biofouling is a slimy film, but sometimes it can be a barnacle or another large creature.”
“The use of UV-lights for biofouling mitigation, although well-known, cannot often be used due to the power required,“ added Sheri White, senior engineer at Woods Hole Oceanographic Institution, who was instrumental in moving this solution forward on the Pioneer Array. “We have the advantage of generating our own power, so that we are able to implement it on a number of optical instruments on our Surface Moorings.”
OOI continues to measure the impact of the UV light on biofouling. While the results are clear that the UV lights increase measurement reliability and accuracy, the team is still trying to gauge the extent of the improvements. Data are annotated to indicate when UV-antifouling was used for each instrument deployment.
Read MoreAssessment of OOI Endurance Array pCO2 Data Quality
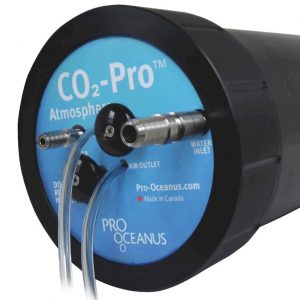
Given the significant importance of understanding and modeling levels of carbon dioxide in our atmosphere (and its potential sources and sinks), Ocean-Atmosphere Exchange and Global Biogeochemistry and Carbon Cycling are two of the OOI’s primary science themes. We address these themes in part through measurements of the air and surface water partial pressure of carbon dioxide (pCO2). Chris Wingard, the OOI Endurance Array Data Lead, recently completed an in-depth assessment of pCO2 data returned during the first four years of Endurance Array operations. These measurements were made using the Pro-Oceanus CO2-ProTM Atmosphere pCO2 sensor. By measuring the partial pressure of CO2 gas in both the air and surface water, researchers can estimate estimate surface flux of CO2 using data from this instrument. 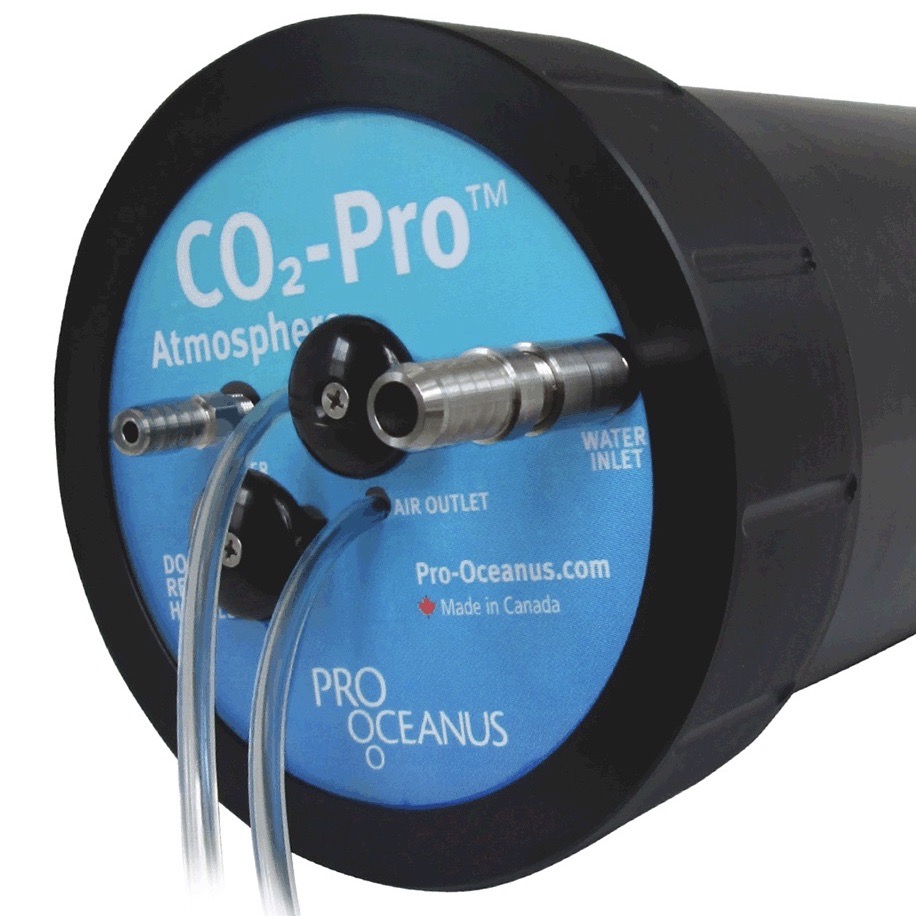
Wingard developed a protocol based on cross-comparisons of overlapping deployments of this sensor, comparing these with independent shipboard pCO2 measurements (including CTD samples and samples taken underway using flow-thru systems), and externally sourced air and surface water pCO2 measurements (e.g. from the LDEO Underway Database). This array of sampling techniques served to confirm the quality and scientific applicability of the Endurance Array pCO2 measurements.
He reported the results of this assessment at a poster session at the recent Ocean Sciences 2020 meeting held this past February in San Diego, CA. The protocol is largely applicable to the same suite of measurements made using the Pro-Oceanus sensor on moorings deployed in the OOI Pioneer, Irminger Sea, Southern Ocean, and Argentine Basin Global Arrays. The MATLAB code and data used to download, process, merge, and cross-compare the data used in this assessment are available online for use.
Both the air and surface water measurements and the flux estimates used in this assessment are available through the OOI Data Portal. Endurance Array air and surface water pCO2 measurements are made at four locations distributed across the Oregon and Washington shelf and slope within the northern California Current Marine Ecosystem.
Other sources of Endurance Array-specific data include the most recent 60 days of the Endurance Array’s air and surface water pCO2 data are available on the NANOOS Visualization System (NVS) and the Global Ocean Acidification Observing System Data Portal (GOA-ON).
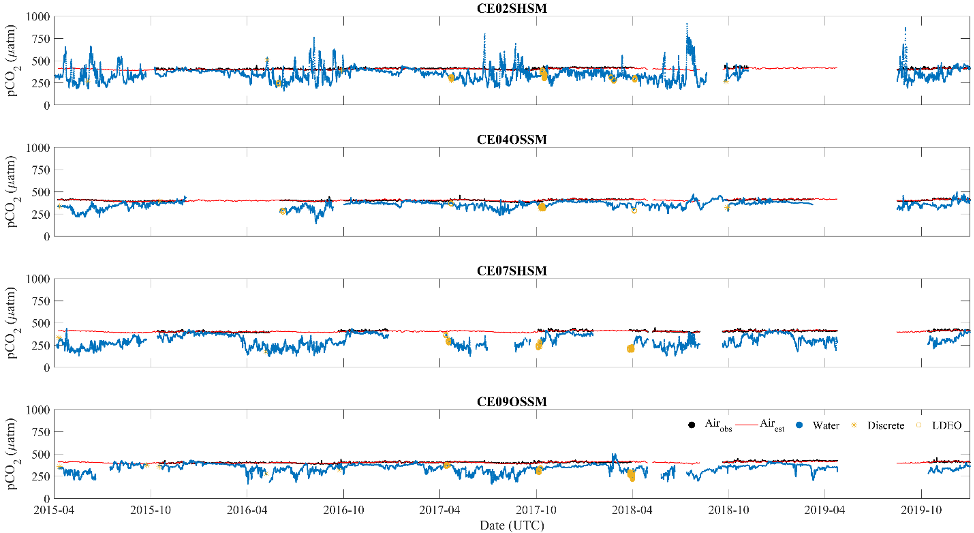
Figure 1: Surface water (•) and air pCO2 (•, observed and —, array average) measurements from 2015-04-01 through 2019-12-31 for the four moorings. The plots also show the distribution of discrete sample (*) and LDEO V2018 (O) data that coincide with each mooring. The data plotted have had human-in-the-loop (HITL) QC flags applied to remove points marked as suspect or failed. Beyond smoothing the data records and the estimation of an array averaged air pCO2 (—), no further corrections were applied to the data. Note the high degree of variability during the summer months in the surface water pCO2 measurements for CE02SHSM, which are similar to other observations made on the Oregon Shelf (Evans et al., 2011).
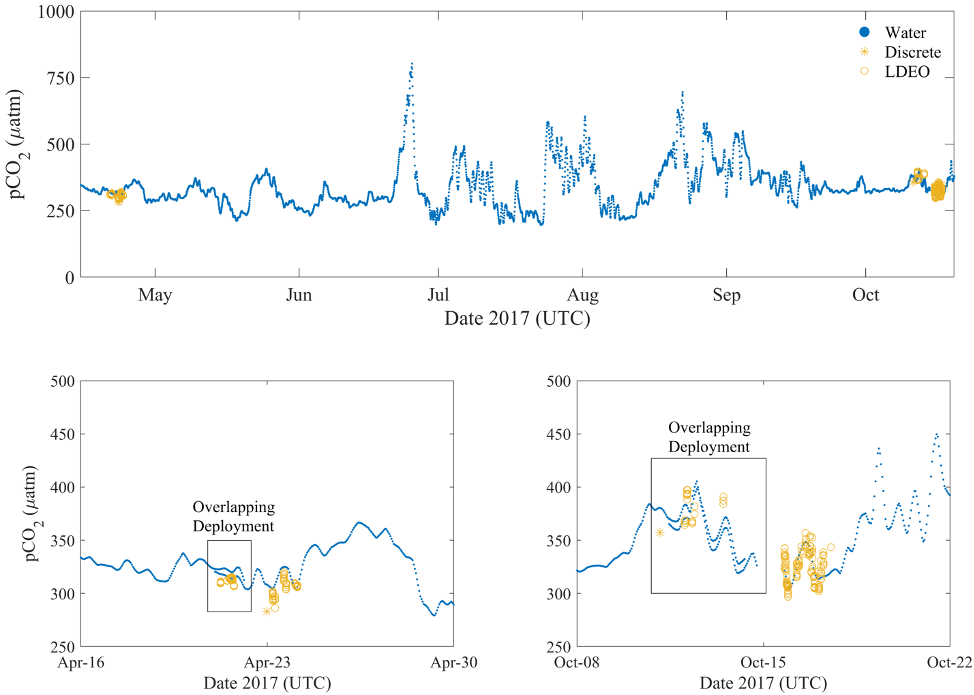
Figure 2: Focused view (upper panel) of the Spring 2017 deployment (#5) of CE02SHSM showing the observed offsets between the surface water pCO2 measurements (•) and the discrete samples (*) and LDEO V2018 (O). Detailed views in the lower two panels, provide a better picture of the observed offsets during the periods of over-lapping deployments; between deployments 4 and 5 (lower left) and deployments 5 and 6 (lower right). Prior to using the OOI pCO2A data, users are strongly encouraged to conduct such cross-comparisons. The independent measurements obtained by the separate systems, and the close agreement between them, provide measures of confidence in the accuracy and applicability of the data.
Read More