
Posts Tagged ‘Coastal Endurance’
New Research Powered by OOI Data: July 2026
Spatial Variability in Year-to-Year, Near-Bottom Hypoxia Over the United States Pacific Northwest Continental Shelf
Authors: J. A. Barth and S. W. Coleman
Each summer, strong coastal winds drive nutrient-rich deep water onto the Pacific Northwest continental shelf through a process known as coastal upwelling. While these nutrients support one of the region’s most productive marine ecosystems, the upwelled water is also naturally low in oxygen. As organic matter decomposes, oxygen levels can drop even further on the shelf, creating hypoxic conditions that can threaten marine life.
In a recent study, researchers J. A. Barth and S. W. Coleman examined the extent and variability of near-bottom hypoxia along the U.S. Pacific Northwest continental shelf from 2021 through 2024. By combining observations from multiple ocean observing platforms, including the U.S. NSF Ocean Observatories Initiative (OOI), the authors mapped seasonal, near-bottom (within 15 m of the bottom) low-oxygen conditions and investigated the environmental processes driving them.
The study found that near-bottom hypoxia affected between 28% and 52% of the continental shelf each summer, with the largest extent occurring in 2021 when upwelling-favorable winds were particularly strong. Although the severity varied from year to year, the spatial distribution of hypoxia remained remarkably consistent, highlighting the strong influence of regional oceanographic processes.
Researchers also found evidence that stronger seasonal upwelling winds contribute to more widespread hypoxia. Because climate models project increases in coastal upwelling-favorable winds , these findings suggest that low-oxygen events could become more frequent or extensive in the future.
How OOI Data Contributed
Observations from OOI’s Coastal Endurance Array and Regional Cabled Array provided continuous dissolved oxygen measurements that complemented ship-based surveys and other regional observing systems. Long-term, high-frequency observations like these allow scientists to monitor changing ocean conditions, identify emerging trends, and place individual events within a broader environmental context.
Why It Matters
Low-oxygen waters can stress or displace commercially and ecologically important marine species, affecting fisheries, ecosystems, and coastal communities. This study demonstrates how sustained observations from OOI help scientists understand the processes driving hypoxia and improve our ability to monitor and anticipate changes in coastal ocean health as the climate continues to change.
Citation
Barth, J. A., & Coleman, S. W. Spatial Variability in Year-to-Year, Near-Bottom Hypoxia Over the United States Pacific Northwest Continental Shelf.
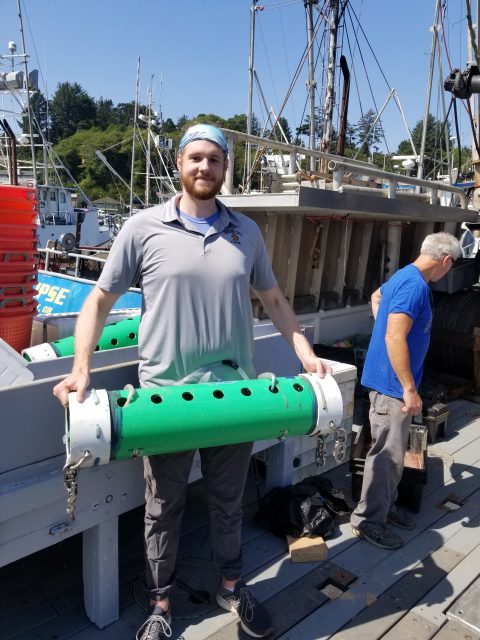
[caption id="attachment_37707" align="alignnone" width="1920"] Sean Coleman holds a trawl-mounted CTD instrument used to measure dissolved oxygen during NOAA’s annual groundfish surveys. These observations were among the datasets used in the study. Photo credit: J. A. Barth.[/caption]
[caption id="attachment_37708" align="alignnone" width="1692"]
Sean Coleman holds a trawl-mounted CTD instrument used to measure dissolved oxygen during NOAA’s annual groundfish surveys. These observations were among the datasets used in the study. Photo credit: J. A. Barth.[/caption]
[caption id="attachment_37708" align="alignnone" width="1692"]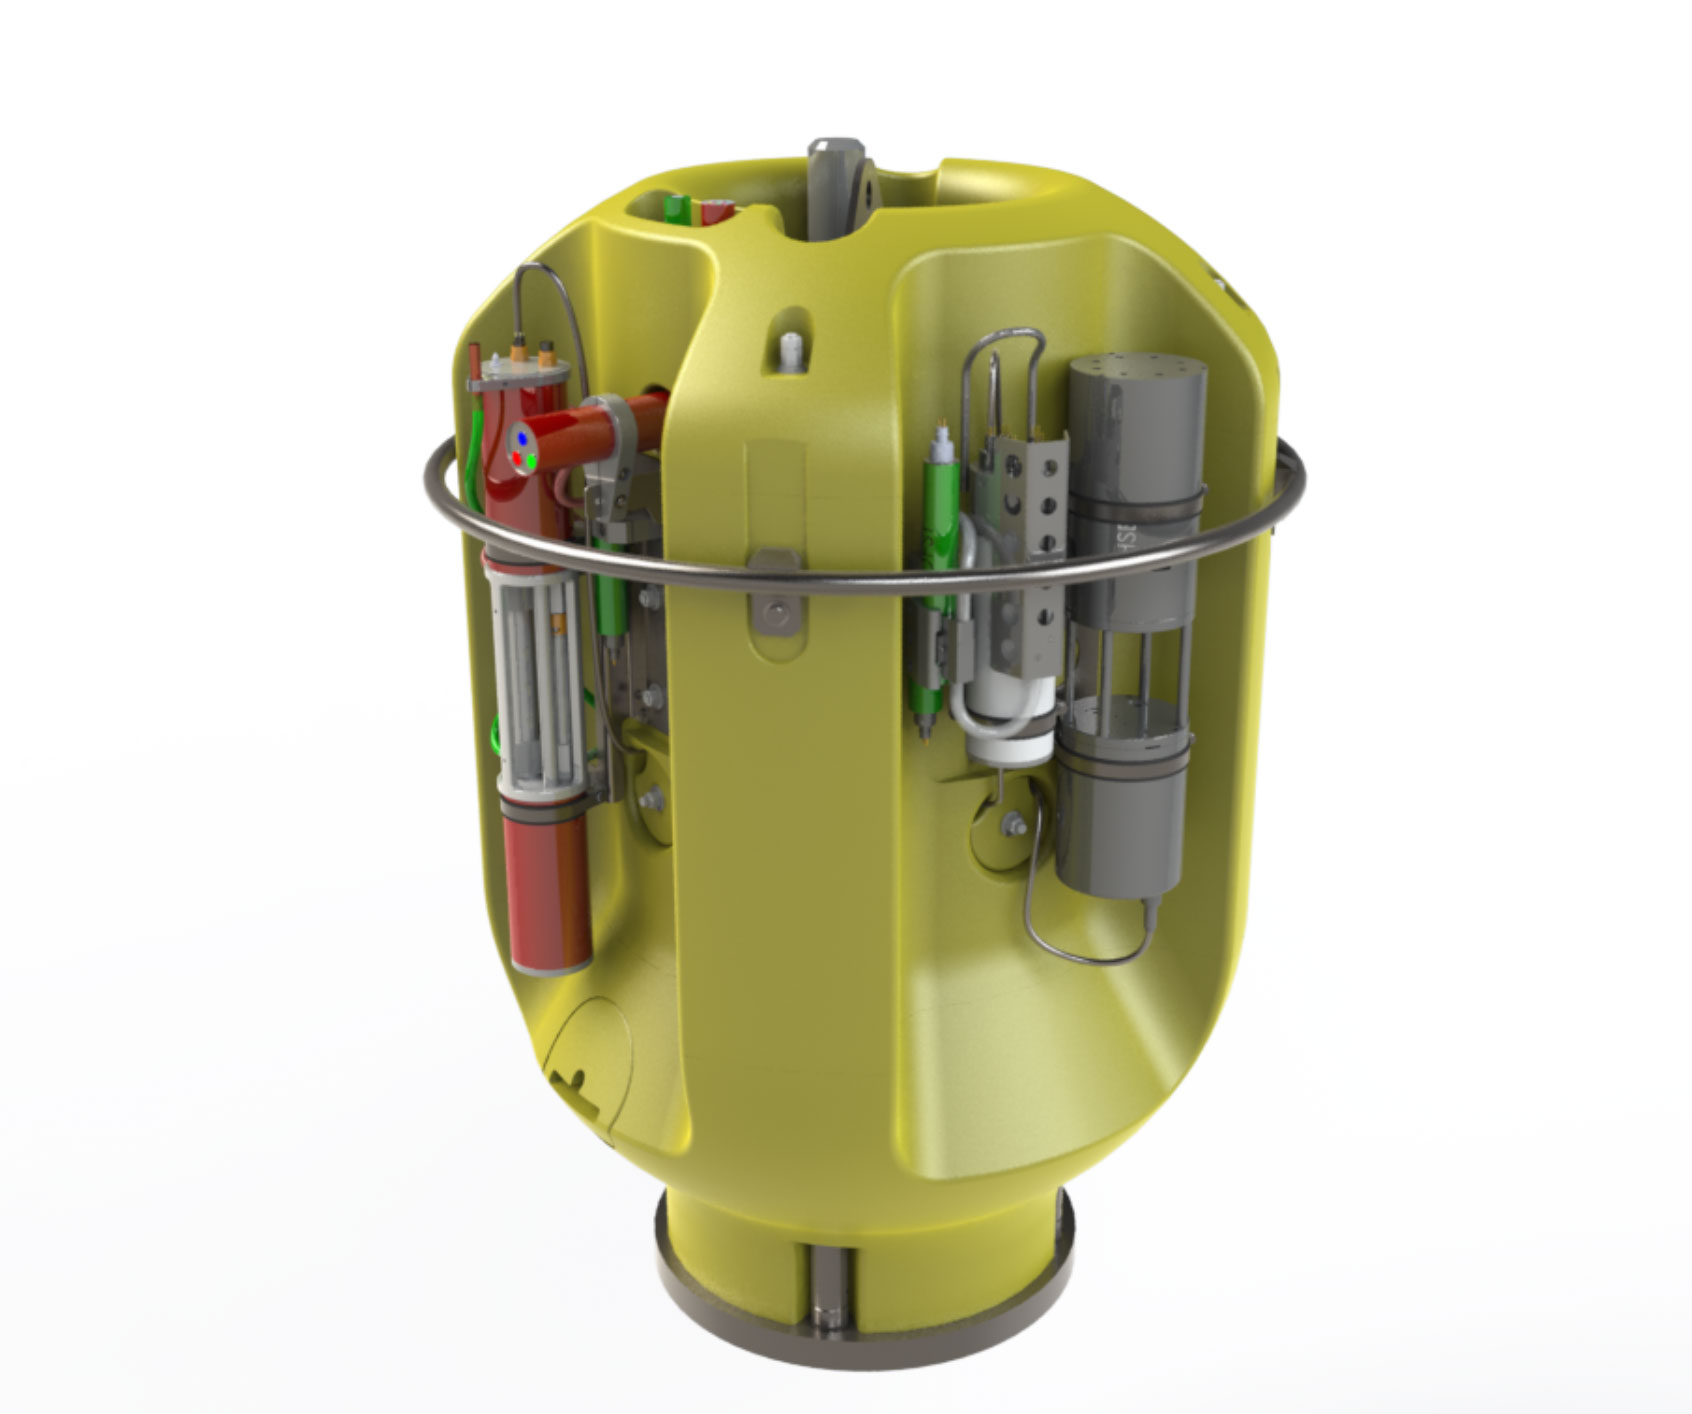 The OOI Regional Cabled Array Shallow Profiler, whose observations contributed to the findings presented in the study. Illustration: Patrick Waite, University of Washington.[/caption]
Read More
The OOI Regional Cabled Array Shallow Profiler, whose observations contributed to the findings presented in the study. Illustration: Patrick Waite, University of Washington.[/caption]
Read More Gap-Filled Dissolved Oxygen Data from the Ocean Observatories Initiative Endurance Array Inshore Moorings

Brandy Cervantes contributed the dataset described below to Zenodo. This dataset now appears in the OOI Community Datasets under the OOI home page.
The National Science Foundation Ocean Observatories Initiative (OOI) collects continuous in-situ measurements of dissolved oxygen (DO) on the Endurance Array moorings in the inner shelf region of the Oregon and Washington coasts. Aanderaa Optode 4831 oxygen sensors were deployed at 7 meters depth on the near surface instrument frame (NSIF) and on the collocated coastal surface piercing profiler (CSPP) moorings. The sensors suffer from calibration drift due to biofouling, which can cause a dramatic increase in DO during daylight hours and corresponding decrease at night compared to the conditions in the water column. This enhanced diel signal, when present, is much more pronounced on fixed-depth sensors and usually begins to occur 1-2 months after a mooring is deployed. After this biofouling issue was identified, OOI began deploying UV lamps adjacent to the oxygen sensor in spring 2018, after which there was substantial improvement in DO data quality. Each file in this dataset contains the measured near surface DO and the corrected near surface DO at the Oregon and Washington inner shelf surface moorings (ISSM) with gaps from periods of biofouling replaced with the DO measured by the CSPP.
___________________
References:
Cervantes, B. (2025). Gap-Filled Dissolved Oxygen Data from the Ocean Observatories Initiative Endurance Array Inshore Moorings [Data set]. Zenodo. https://doi.org/10.5281/zenodo.15742508
Read MoreSubsurface Temperature Anomalies off Central Oregon during 2014–2021

Brandy T. Cervantes, Melanie R. Fewings, and Craig M. Risien
Cervantes et al. (2024) use water temperature observations from a stationary oceanographic platform located in 80 m water depth off Newport, Oregon to calculate variations from the long term mean temperature at the surface, near surface, and bottom from 1999 to 2021. This site, known as NH-10, was occupied since 1999 successively by an Oregon State University National Oceanographic Partnership Program (OSU NOPP), GLOBEC Long Term Observation Program, Oregon Coastal Ocean Observing System (OrCOOS), NANOOS/CMOP. Since 2015 it has been occupied by the NSF OOI Coastal Endurance Oregon Shelf mooring (CE02SHSM). The temperature observations from these different programs that have not previously been combined into one long time series. Of particular interest are the details of the marine heatwave (MHW) periods of 2014–2016 and 2019– 2020, which had widespread impacts on marine ecosystems. Strong deviations from the mean water temperature observed near the ocean bottom during late 2016 are the largest sustained warm anomalies in the time series. The 2019–2020 period shows warm anomalies in the summer and fall that are only observed near the surface.
They also analyze the local winds during years with and without MHWs and find that spring/summer upwelling favorable, or northerly winds, which are important for bringing cold, nutrient rich water to the surface in coastal regions, interrupt MHW events and can lessen extreme heating during MHWs in coastal waters as illustrated in Figure 33.
The three periods detailed in Figure 33 show warmer daily surface temperatures during the MHW years than the non‐MHW years and several days during 2014–2016 with surface and bottom anomalies greater than 4°C and during 2014–2016 and 2019–2020 with surface anomalies greater than 4°C (Figure 12a). During upwelling favorable winds (negative wind stress), the three periods follow similar patterns with colder surface temperatures typically associated with higher wind stress magnitudes. During downwelling‐favorable winds (positive wind stress), 2014–2016 is substantially warmer at the surface than the other periods at all wind stress values.
[caption id="attachment_36388" align="alignnone" width="526"] Figure 33: 8‐Day low‐pass filtered surface temperature at NH‐10/CE02SHSM for (a) 1999–2000, (d) 2014–2015, and (g) 2019–2020; 8‐day low‐pass filtered along‐shelf surface velocity for (b) 1999–2000, (e) 2014–2015, and (h) 2019–2020; and NDBC 46050 wind stress vectors (thin light lines) and along‐shelf 8‐day wind stress (thick lines) (c) 1999–2000, (f) 2014–2015, and (i) 2019–2020. Events identified as surface marine heatwaves are shaded in gray. The thick black line in panels (a–b), (d–e), and (g–h) is the climatological mean computed over the full NH‐10 time series (Figure 33c), repeated twice, and the thin black lines are the 90th and tenth percentiles.[/caption]
___________________
References:
Cervantes, B. T., Fewings, M. R., & Risien, C. M. (2024). Subsurface temperature anomalies off central Oregon during 2014–2021. Journal of Geophysical Research: Oceans, 129, e2023JC020565. https://doi.org/10.1029/2023JC020565
Read MoreImpact of Ocean Model Resolution on Temperature Inversions in the Northeast Pacific Ocean
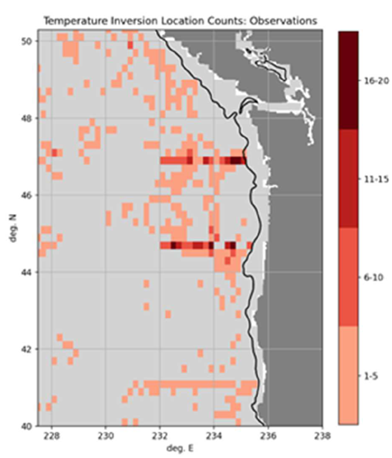
Temperature inversions are a local vertical minimum in temperature located at a shallower depth than a local maximum. In the Northeast Pacific, several water masses and multiple mechanisms for transforming or advecting ocean temperature (cold air events, upwelling, river discharge, cross-shelf eddy transport) create favorable conditions for temperature inversions. Modeling these temperature inversions is challenging. Osborne et al. (2023) analyze observations from 2020 and 2021 to characterize inversions in the Northeast Pacific. The data for these observations come largely from OOI Endurance Array gliders accessed through the GTS database. They compare the observed inversions to model results from the U.S. Navy’s Global Ocean Forecast System version 3.1 (GOFS 3.1) and two instances of the Navy Coastal Ocean Model. Temperature inversions are observed to be present in about 45% of profiles with temperature minimums between 50 – 150 m, temperature maximums between 75 – 175 m, and inversion thickness almost entirely less than 40 m. Modeled temperature inversions are present in only about 5% of model-observations comparisons, with weaker, shallower minimums. This is attributed to two primary causes: coarse model resolution at the inversion depth and the assimilation process which low-pass filters temperature, making inversions weaker. Osborn et al. identify additional work to test the impact of vertical grids on improving model performance.
[caption id="attachment_34977" align="alignnone" width="392"] Maps of inversion counts for observed profiles collected during 2020-2021 and analyzed in this work. Profiles have been filtered to be offshore of the 200 m isobath and to only one profile per collection platform per day (e.g., one profile per glider per day). Black line near the coast marks the 200 m isobath. Light gray indicates no profiles collected during the study period.[/caption]
___________________
References:
J. Osborne V, C. M. Amos and G. A. Jacobs, “Impact of Ocean Model Resolution on Temperature Inversions in the Northeast Pacific Ocean,” OCEANS 2023 – MTS/IEEE U.S. Gulf Coast, Biloxi, MS, USA, 2023, pp. 1-8, doi: 10.23919/OCEANS52994. 2023.10337390.
Read MoreGraduate Students Apply Now for Endurance Fall Shipboard Experience
Upcoming cruise volunteer opportunity on NSF Ocean Observatories Initiative Coastal Endurance Array Expedition
When: Leave Newport, Oregon on October 4, 2024; return to Newport on October 20, 2024
Applications Due: August 30, 2024
There is an opening for a student volunteer in the Fall 2024 as part of the U. S. National Science Foundation Ocean Observatories Initiative (OOI) Coastal Endurance Array on R/V Sikuliaq. The Coastal Endurance Array team will deploy and recover oceanographic moorings, profilers and gliders off Washington and Oregon. Seven surface moorings will be deployed and recovered along with up to four profilers and six gliders. The team will also conduct CTD (Conductivity, Temperature, and Depth) casts, with bottle sampling, and collect underway ship data for comparison to data from deployed equipment.
The selected volunteer will have the opportunity to assist in the deployment and recoveries of moorings and water sample processing. They will also have opportunities to work directly with OOI data. The cruise will consist of two legs, each lasting about 8 days. Interested applicants can apply to participate on either or both legs. Domestic (within the USA) travel reimbursement is possible.
The primary goal of this program is to provide graduate students currently completing (or who have recently completed) a degree in a field of oceanographic research with the opportunity to participate in a research cruise. The participant will be a member of the scientific party and be involved in data collection and all other activities at sea. It is envisioned that the individual will be familiar with the science to be conducted at sea, and thus, form new collaborations and potentially develop new research directions. To be eligible to participate, the individual must either currently be studying at a U.S.-based institution or be a recent graduate, and have either a U.S. Passport or an applicable U.S. Visa.
Questions and application materials should be sent to Edward.Dever@oregonstate.edu. Application materials are:
- a CV or resume
- a one page letter of interest describing how this opportunity fits their professional and/or research interests
- contact information for two references.
For a first-hand view of what to expect at sea, check out this video.
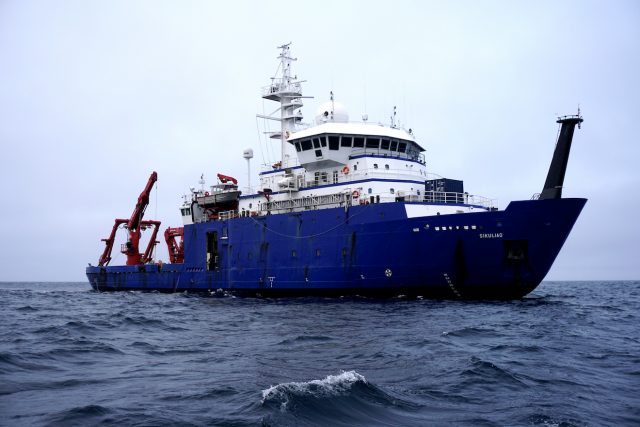
[media-caption path="https://oceanobservatories.org/wp-content/uploads/2024/06/Sikuliaq-1.jpeg" link="#"]R/V Sikuliaq, University of Alaska Fairbanks.[/media-caption] Read MoreEndurance Array Reaches 20th Deployment
Since 2014 when the U.S. National Science Foundation Ocean Observatories Initiative Coastal Endurance Array was first deployed in the waters off the coasts of Oregon and Washington, the array has been turned – that is moorings were recovered and replaced with new – 19 times. The upcoming expedition on March 28th, with 15 scientists and engineers aboard the R/V Sikuliaq will be the 19th time that the array has been pulled out of the water and replaced, and the 20th time the array has been deployed.
Over the past nine years, the turns have happened every six months, except for in 2020 when COVID restrictions caused the Endurance team to space two consecutive turn cruises 9 months apart. Regular recovery and deployments are needed to ensure the observing equipment stays operational.
“The EA team has really gotten proficient at turning the arrays,” said Jonathan Fram, the Endurance Array’s Project Manager, who will serve as the Chief Scientist for this expedition, his 10th time leading the effort. “We’ve made many technical improvements over the years to combat the powerful and ever-changing conditions of the Northeast Pacific Ocean so that we can continue to collect and report continuous ocean data from this important region.”
The 20th expedition will begin and end at the Oregon State University’s newly renovated pier in Newport, Oregon. The arrays and associated equipment will be transported to Newport from Corvallis in six tractor trailer trucks. Because of the large size of these components, the expedition will be conducted in two legs. The first leg will head to the Washington site, with a transit time of 2/3’s of a day. The second leg will be to the Oregon site. In total, the team will recover and deploy six surface moorings (two battery powered buoys and four large buoys powered by wind and solar energy), one offshore and three surface piercing profiler moorings, and four gliders. One glider experiencing navigation issues will be recovered. CTD casts (to measure conductivity, temperature, and depth) and water sampling will be conducted along with each mooring operation.
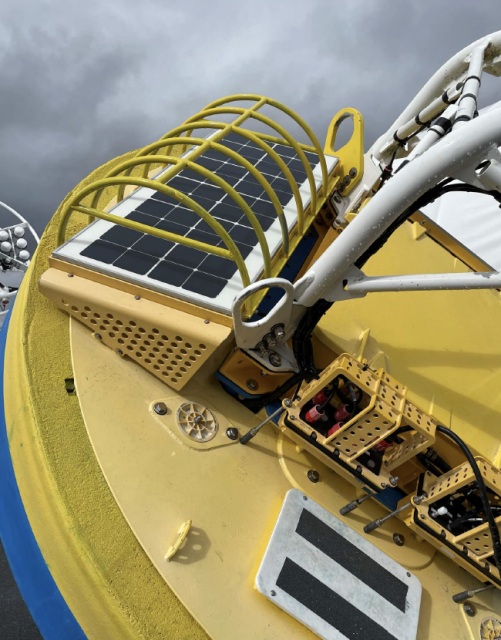
This 20th trip includes several technical improvements. The line used on the Heavy Lift Winch has been increased in size to improve load strength and safety. Each buoy will include a covered wagon style guard against sea lions, who regularly use the buoys as rest stops. All batteries have been replaced or upgraded. Additional improvements have been made that will result in better real-time wind data, and underwater camera operations. The Endurance 20 team also will be deploying new test instruments to see if they might improve data gathering for wind, pH, and partial pressure of carbon dioxide.
[media-caption path="https://oceanobservatories.org/wp-content/uploads/2024/03/Screenshot-2024-03-21-at-11.54.35-AM.png" link="#"]To dissuade sea lions that regularly stop and rest on Endurance Array buoys, OOI engineers have ingeniously devised a steel cover to protect the solar panels that provide power to the mooring. Credit: Jonathan Fram, OSU.[/media-caption]“The order of operations will in part depend on conditions,” added Fram, who joked, “but we expect this trip to be easier than last spring’s, which was three weeks earlier, when we were preparing for the cruise in the snow.”
In addition to regular operations, the Endurance Team will be joined by scientific partners. University of South Carolina (USC) researcher Eric Tappa and Oregon State University (OSU) student Faith Schell will be onboard to help turn a sediment trap adjacent to OOI’s Oregon Slope Base site. This is part of an ongoing research effort of OSU Associate Professor Jennifer Fehrenbacher and USC Professor Claudia Benitez-Nelson, who study the geochemistry, biomineralization, and marine biology of the sediments. Additionally, the team will be deploying fish tag readers for OSU Assistant Professor Taylor Chapple to support his work studying sharks and other large marine predators.
The expedition’s progress will be reported daily. Bookmark this page and follow along as the work unfolds.
Read More
A Three Stream Ocean Optics Model
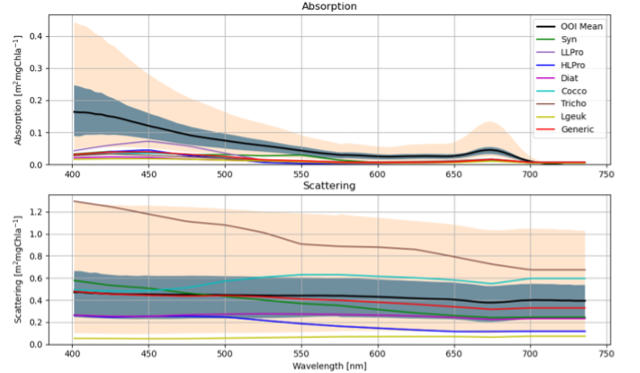
A Three Stream Ocean Optics Model: Regional Implementation and Validation. Adapted by OOI from Miller M., 2022.
[media-caption path="https://oceanobservatories.org/wp-content/uploads/2023/07/EA-science-highlight.png" link="#"](Figure 3.10 from Miller (2022) Top: The black line shows the mean OOI absorption as a function of wavelength for OOI Endurance CSPP Oregon shelf deployment 15 (August – Sept 2019). The gray shading shows the OOI absorption extent between the 20% and 80 % quantiles. The tan shading shows the maximum and minimum extent of OOI absorption. The colored lines correspond to the modeled absorption for different single species approximations. Bottom: Same as top, but for scattering instead of absorption.[/media-caption]Miles Miller used OOI data as part of this MS thesis awarded September 2022 from the Univ. California, Santa Cruz. The goal of his work was to develop the potential to estimate phytoplankton community structure from remotely sensed optical information and not direct in situ phytoplankton observations. As a step towards this goal, he estimated phytoplankton community structure using spectrally dependent optical absorption and scattering data from an AC-S on the Oregon Shelf profiler. Miller developed linear relationships between modeled phytoplankton absorption and scattering and corresponding observations and solved them by constrained least squares inversion over a field of thirteen wavelengths using six phytoplankton types. He solved the problem for independent absorption and scattering as well as coupled absorption and scattering. He estimated phytoplankton communities as a function of profile depth and for multiple profiles in time.
The model produced accurate downward irradiance fields when using observed absorption and scattering profiles obtained from the Ocean Observatories Initiative’s Oregon Shelf Surface Piercing Profiler Mooring. Through this forward modeling-based comparison to observations it was found that the optical model can produce accurate profiles under certain conditions, making it promising for data assimilation of remote sensing reflectance as a function of wavelength. Miller identified several outstanding issues remaining to be addressed to move from using in situ measured absorption and scattering to estimates from remote sensing reflectance. Because the optical model accuracy is primarily dependent on absorption and scattering, he argued that remote sensing reflectance accuracy can be improved with enhanced phytoplankton community structure and CDOM estimations (see Figure 3.10 from Miller (2022). This figure shows that the modeled phytoplankton light attenuation agrees well with the measurements but that modeled absorption underestimates measurements. This underestimation hints that chromophoric dissolved organic matter (CDOM) is not being properly resolved as CDOM affects only total absorption and not scattering.
_________________________________________
Miller, M. (2022). A Three Stream Ocean Optics Model: Regional Implementation and Validation (master’s thesis). University of California, Santa Cruz. 62 pp.
Read MoreCollaborative Data Partnership Providing Fuller, More Robust Picture of Conditions in Northeast Pacific
A new data initiative involving more than 20 years of oceanographic data from Olympic Coast National Marine Sanctuary (OCNMS) promises to provide scientists and the public with a more robust picture of changing ocean conditions within the sanctuary and Northeast Pacific Ocean.
Funded by the National Oceanic and Atmospheric Administration’s (NOAA) Climate Program Office, a team from Oregon State University is working to make 23 years of sanctuary mooring data and data from CTD (Conductivity, Temperature, and Depth) casts available through publicly accessible data repositories. The three-year project will also combine the sanctuary’s data with complementary data sets in the region, including data from the Ocean ObservatorIes Initiative (OOI) Coastal Endurance Array.
“The OCNMS data are a critically important data set that has not been fully unlocked and represents a treasure chest of information that we’ve only begun to crack open,” said Jenny Waddell, research coordinator at Olympic Coast National Marine Sanctuary and a collaborator on the project. “The data will provide information about marine heat waves, changes in timing of spring transition to upwelling, seasonal hypoxia, and ocean acidification, all of which will help improve the management of marine resources in the sanctuary.”
Olympic Coast National Marine Sanctuary, along Washington State’s outer coast, represents one of North America’s most productive marine ecosystems. An area of summertime upwelling of cold nutrient-rich waters, the sanctuary hosts a diverse ecosystem that is home to many commercially and culturally important fisheries.
[media-caption path="https://oceanobservatories.org/wp-content/uploads/2023/06/SP_stern_JWaddell_Aug2021.jpeg" link="#"]The stern of the R/V Storm Petrel hints at some of the enhanced capacity that this new vessel brings to research on the Olympic Coast, including a larger work area on the back deck, an upper deck for seabird and mammal surveys, a new pot hauler and knuckle boom crane, and a much more capable A-frame and winch. Credit: Jenny Waddell © NOAA.[/media-caption]Collected by 10 oceanographic moorings, the process of taking 23 years of the sanctuary’s quality-controlled data (water temperature, salinity, density, spiciness, velocity, and dissolved oxygen concentration) and meshing them with data from 700 CTD casts is a huge undertaking that will be conducted in multiple steps. The first step was the handover of all processed and raw data by the sanctuary to data experts Brandy Cervantes and Craig Risien at OSU. The data experts, who are Co-PIs on the NOAA project, are going through all the data and reprocessing where necessary to make sure that all the data are interoperable. The high-resolution CTD data are of particular interest, having never been made widely available before. These data will provide information about the water column to complement and validate the data collected by the instruments on the moorings.
OOI’s Contribution
The Coastal Endurance Array’s Washington Inshore mooring is the shallowest of the three OOI moorings off Washington State and lies just inside the sanctuary’s southern boundary. This location helps provide an in-depth look at ongoing conditions nearer the coast. While the other two Endurance Array moorings off Washington State are farther offshore and to the south, not formally within the sanctuary boundaries, they provide valuable year-round data, which are particularly helpful for context on conditions farther offshore from the sanctuary and for regional forecasting and prediction efforts of ocean conditions. Sanctuary moorings are seasonal, collecting data when they are deployed in May through the first week of October when they are recovered, except for a single overwintering mooring, so OOI data also provide important year-round context for OCNMS.
“Data from the other two Endurance Array moorings not within the sanctuary boundary are equally valuable, not just for prediction purposes, but to our tribal partners. A unique thing about the Olympic Coast National Marine Sanctuary is that nearly the entire sanctuary is within the Usual and Accustomed Fishing Areas of the four coastal treaty tribes in Washington — the Hoh Tribe, Makah Tribe, Quileute Tribe, and the Quinault Indian Nation. The sanctuary and OOI-derived data are particularly valuable to the Quinault Tribe, who use these data to estimate fish runs. They have found, for example, that our oxygen data are a good predictor of the Coho salmon run size in some of the coastal rivers,” Waddell explained.
Olympic Coast Data Applications
Sanctuary data are the foundation of the LiveOcean model, an ongoing project of the University of Washington Coastal Modeling Group that provides short-term (three-day) forecasts of ocean conditions—currents, temperature, salinity and biogeochemical fields such as harmful algal blooms. Sanctuary data also are incorporated in the J-SCOPE model, operated by the Northwest Association of Networked Ocean Observing Systems (NANOOS), for seasonal (six to nine month) forecasts of ocean conditions that are relevant to management decisions for fisheries, protected species, and ecosystem health.
Sanctuary and OOI data also serve as the basis for novel estimates of pre-industrial and near future (2030–2050) ocean acidification conditions on the Olympic Coast led by NOAA Pacific Marine Environmental Laboratory ocean carbon scientists. These estimates are made possible by rich NOAA Ocean Acidification Program-funded coastal observing efforts and inform state and tribal fisheries and water quality management (cf. Alin et al. 2023 in press).
Changing Conditions
“In the 23 years that we’ve been collecting data, we have been documenting changing ocean conditions that are quite alarming,” said Waddell. The 465-page latest Condition Report for the Sanctuary details how ocean conditions along the Olympic Coast continue to change and intensify in response to climate change. The report lays out concerns about the impacts from ocean acidification, warming ocean temperatures, increased stratification, rising sea levels, and declines in dissolved oxygen, in addition to the intermittent occurrences from more intense and frequent marine heatwaves, harmful algal blooms, and coastal storms.
[media-caption path="https://oceanobservatories.org/wp-content/uploads/2023/06/IMG_4898.jpg" link="#"]Oceanographic moorings deployed by Olympic Coast National Marine Sanctuary, such as this mooring near Cape Alava, have been tracking changes in ocean conditions along this remote and rugged coastline for more than two decades. Credit: Jenny Waddell ©NOAA.[/media-caption]To help bring this information to the public, the sanctuary has developed a user-friendly and searchable graphic interface that provides easy access to data within the report. Called the Web Condition Report (WebCR), the interface is designed to connect people with information they are interested in.
[media-caption path="https://oceanobservatories.org/wp-content/uploads/2023/06/OCNMS_O2_plots_5panel_2018-scaled.jpg" link="#"]
This is an example of the type of information available through WebCR. Like animals on land, most marine animal species need oxygen to survive. To obtain oxygen, whales and turtles periodically breathe air at the water’s surface, while most fish species obtain oxygen that is dissolved in seawater. Low oxygen levels can harm marine animals or force them to move to areas with more hospitable conditions. Cape Elizabeth in the south (2006–2017), for example, has gotten progressively worse over time and in recent years is hypoxic 44 percent of the time. Image source: Alin et al., 2023 in prep. Also reprinted from: Office of National Marine Sanctuaries. 2022. Olympic Coast National Marine Sanctuary Condition Report: 2008–2019. U.S. Department of Commerce, National Oceanic and Atmospheric Administration, Office of National Marine Sanctuaries, Silver Spring, MD. 453 pp.[/media-caption] “These 23 years of data now being sorted will help us get a handle on what is really going on in the Pacific Northwest. It’s an important microcosm of what’s happening on a larger scale. Only around 25,000 people live along the Olympic Coast between Neah Bay and Ocean Shores, so the human footprint of this place is minimal. Most of what we’re seeing and what the data are telling us are climate forced issues coming to bear here,” added Waddell. “And having our data in the hands of senior oceanographers who know exactly what to do with it is just so incredibly valuable to understand not only what’s happening at the ocean surface, but within the full water column, which is where most of the impacts of climate change are occurring.”
The Principal Investigator (PI) for this project is College of Earth, Ocean and Atmospheric Science (CEOAS) Oregon State University (OSU) Associate Professor Melanie R. Fewings. Co-principal Investigators are Craig M. Risien, OSU Senior Faculty Research Assistant II and OOI Cyberinfrastructure Project Manager; Co-Principal Investigator Brandy T. Cervantes, OSU Senior Research Associate.
In addition to the PIs and NOAA’s Waddell, other collaborators include Dr. Simone Alin, NOAA Pacific Marine Environmental Laboratory, Katie Wrubel, Resource Protection Specialist, OCNMS, Joe Schumacker, Marine Resources Scientist, Quinault Indian Nation, Dept. of Fisheries, Tommy Moore, Oceanographer, Northwest Indian Fisheries Commission, Charles Seaton, Senior Oceanographer, Columbia River Inter-Tribal Fish Commission, Kym Jacobson, Research Zoologist, NOAA Northwest Fisheries Science Center, Jennifer Fisher, NOAA Cooperative Institute for Marine Ecosystem and Resources Studies, OSU, and Maria Kavanaugh, Assistant Professor, CEOAS, OSU, and Principal Investigator of the Marine Biodiversity Network.
Read More
Particle Trajectories in an Eastern Boundary Current
Adapted and condensed by OOI from Wong-Ala et al., 2022, doi:/10.1016/j.jmarsys.2022.103757
To study the transport and dispersal of marine organisms during spawning, Wong-Ala* et al. developed and applied a Lagrangian particle tracking (LPT) model to compare and contrast particle drift patterns during the spring transition off the Oregon coast. They studied the Oregon coast as it has distinct upwelling and downwelling regimes and variable shelf width. They contrasted years (2016–18) using Regional Ocean Modeling System (ROMS) with different horizontal spatial resolutions (2 km, 250 m). They found the finer spatial resolution model significantly increased retention along the Oregon coast. Particles in the 250 m ROMS were advected to depth at specific times and locations for each simulated year, coinciding with the location and timing of a strong and shallow alongshore undercurrent that is not present in the 2 km ROMS. Additionally, ageostrophic dynamics close to shore, in the bottom boundary layer, and around headlands not present in the coarser model emerged in the 250 m resolution model. They concluded that the higher horizontal model resolution and bathymetry generated well-resolved mesoscale and submesoscale features (e.g., surface, subsurface, and nearshore jet) that vary annually. These results have implications for modeling the dispersal, growth, and development of coastal organisms with dispersing early life stages.
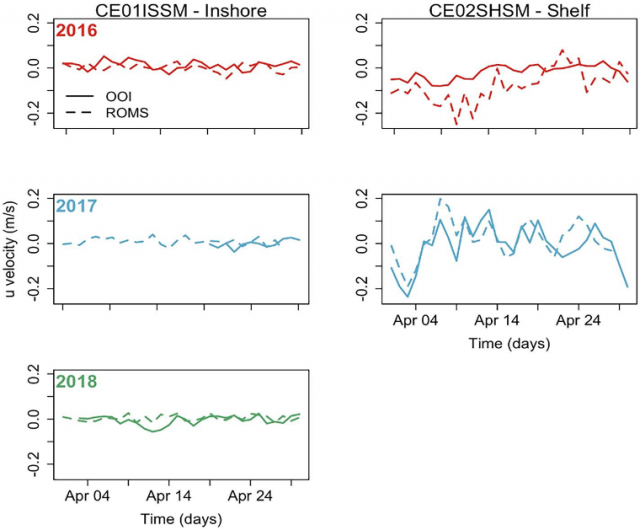
[media-caption path="/wp-content/uploads/2022/11/Endurance-Highlight.png" link="#"]Figure 1: (Fig 9 from Wong-Ala et al. (2022). Comparison of u-velocity (zonal velocity) data between the 250 m ROMS and an inshore mooring and shelf mooring off the Oregon coast collecting data at seven meters depth. The panel is organized by year: 2016 (row 1), 2017 (row 2), 2018 (row 3), and location of data collection: inshore (column 1) and shelf (column 2). In April 2018, there are no data available from the shelf mooring ADCP.[/media-caption]The model applied by Wong-Ala assimilates satellite sea surface temperature and along-track altimetry. Model atmospheric forcing is from the NOAA North American Mesoscale Model (NAM). To validate their model, Wong-Ala et al., used OOI Endurance Array time series data from 2016 to 2018 from the Oregon inshore and shelf moorings (CE01ISSM and CE02SHSM). They compared available OOI zonal and meridional velocities, temperature, and salinity to model output of these parameters for the month of April in each year when they ran their model (Figure 1). They found the modeled currents and temperature from the 250 m ROMS model closely follow the observed data from inshore and shelf moorings compared to the 2 km ROMS. The 250 m ROMS modeled currents and observed currents at the inshore mooring are similar for all three years (Figure 1).
They also found that the 250 m ROMS modeled temperature and observed data are similar in 2017 at the inshore and shelf location. In April 2017 and 2018, the modeled temperature from the 250 m ROMS is about 1 °C cooler than the observed temperatures.
_____________________
*Wong-Ala is a PhD student at Oregon State University. She is a Pacific Islander.
Reference:A. T. K. Wong-Ala, Ciannelli, L., Durski, S. M., and Spitz, Y., Particle trajectories in an eastern boundary current using a regional ocean model at two horizontal resolutions, Journal of Marine Systems, vol. 233, p. 103757, 2022. https://doi.org/10.1016/j.jmarsys.2022.103757.
Read MoreTwo Decades of Mooring and Ship-Based Observations from the Newport Hydrographic Line
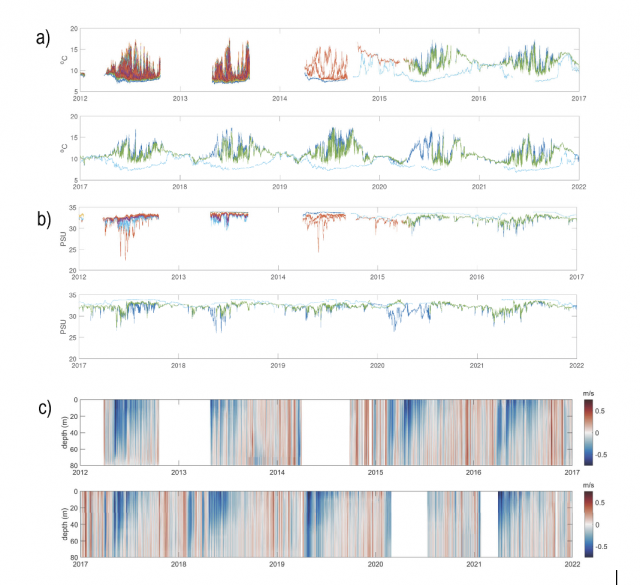
C.M. Risien, M.R. Fewings, J.L. Fisher, B.T. Cervantes, C.A. Morgan, J.A. Barth, P.M. Kosro, J.O. Peterson, W.T. Peterson, and M.D. Levine
In the Northern California Current System (NCCS), during spring and summer months, equatorward winds drive the upwelling of cold, nutrient-rich, and oxygen-poor waters from depth onto the shelf, fueling a highly productive marine ecosystem that supports valuable commercial fisheries. Oceanographic conditions in the NCCS vary on temporal scales from hours to decades. In contrast, grant-funded research typically consists of shorter-term studies (3-5 years). While such studies resolve intra-annual and perhaps inter-annual variability, they do not capture decadal scale variability that is critical for climate studies.
Risien et al. (2022), present two new decadal-scale data products. The first is ~550 gridded, cross-shelf hydrographic sections of temperature, salinity, potential density, spiciness, and dissolved oxygen from data collected biweekly to monthly from March 1997 to present along the Newport Hydrographic Line (NHL; 44.6°N, 124.1–124.65°W) off Newport, Oregon, USA, mostly by NOAA programs. They also present monthly climatologies derived from these observations.
The second data product is 23 years (1999–2021) of mooring temperature, salinity and velocity data — collected by five programs (OSU-NOPP, GLOBEC, OrCOOS, NANOOS/CMOP, OOI) at NH-10 (44.6°N, 124.3°W), 10 nautical miles west of Newport, Oregon along the NHL — that they stitched together into one coherent, quality-controlled data set (see figure above).
Making available such multi-decadal data sets, which they plan to release via public repositories, is essential to enable scientists to characterize natural and anthropogenically-forced variability; resolve cause-and-effect relationships in Earth’s climate and marine ecosystems at intra-seasonal, seasonal, inter-annual and decadal time scales; and verify climate models. These new gridded and concatenated data products show that long-term ocean observing efforts require multi-generational teams with a wide range of skills and a shared vision that is motivated by science and ocean monitoring needs.
Read More