Posts Tagged ‘Coastal Endurance’
Rocky Seas Didn’t Deter Endurance 15’s Success
In spite of rocking seas, a generator in need of repair, and a medical delay, the Coastal Endurance Array team successfully completed its mission to turn the array for the 15th time, achieving all of its science objectives.
Weather conditions in the northern Pacific were less-than-ideal for two of the three legs of the two-week expedition. At one point, winds speeds of 25-30 knots, with accompanying waves of up to 10 feet, caused a weather delay in operations and subsequent alterations in cruise plans.
“While it was comfortable to be aboard the R/V Thomas G. Thompson even in such conditions, sea conditions were borderline for entering or exiting Newport and deploying or recovering most platforms, “explained Chief Scientist Jonathan Fram, who led the 10-member science party. “Fortunately, we had good weather during the first leg of the cruise, which gave us some leeway to address weather-related downtime and other delays during latter legs of the cruise. We were able to switch the order of some activities, delay some deployments, and ultimately got most everything in and out of the water as planned during our time at sea.”[media-caption path=”https://oceanobservatories.org/wp-content/uploads/2021/09/Screen-Shot-2021-09-28-at-5.20.52-PM.png” link=”#”]When seas were calm, the team was able to deploy moorings like this one. After deployment, they headed back to port with a deck full of recovered equipment.[/media-caption]
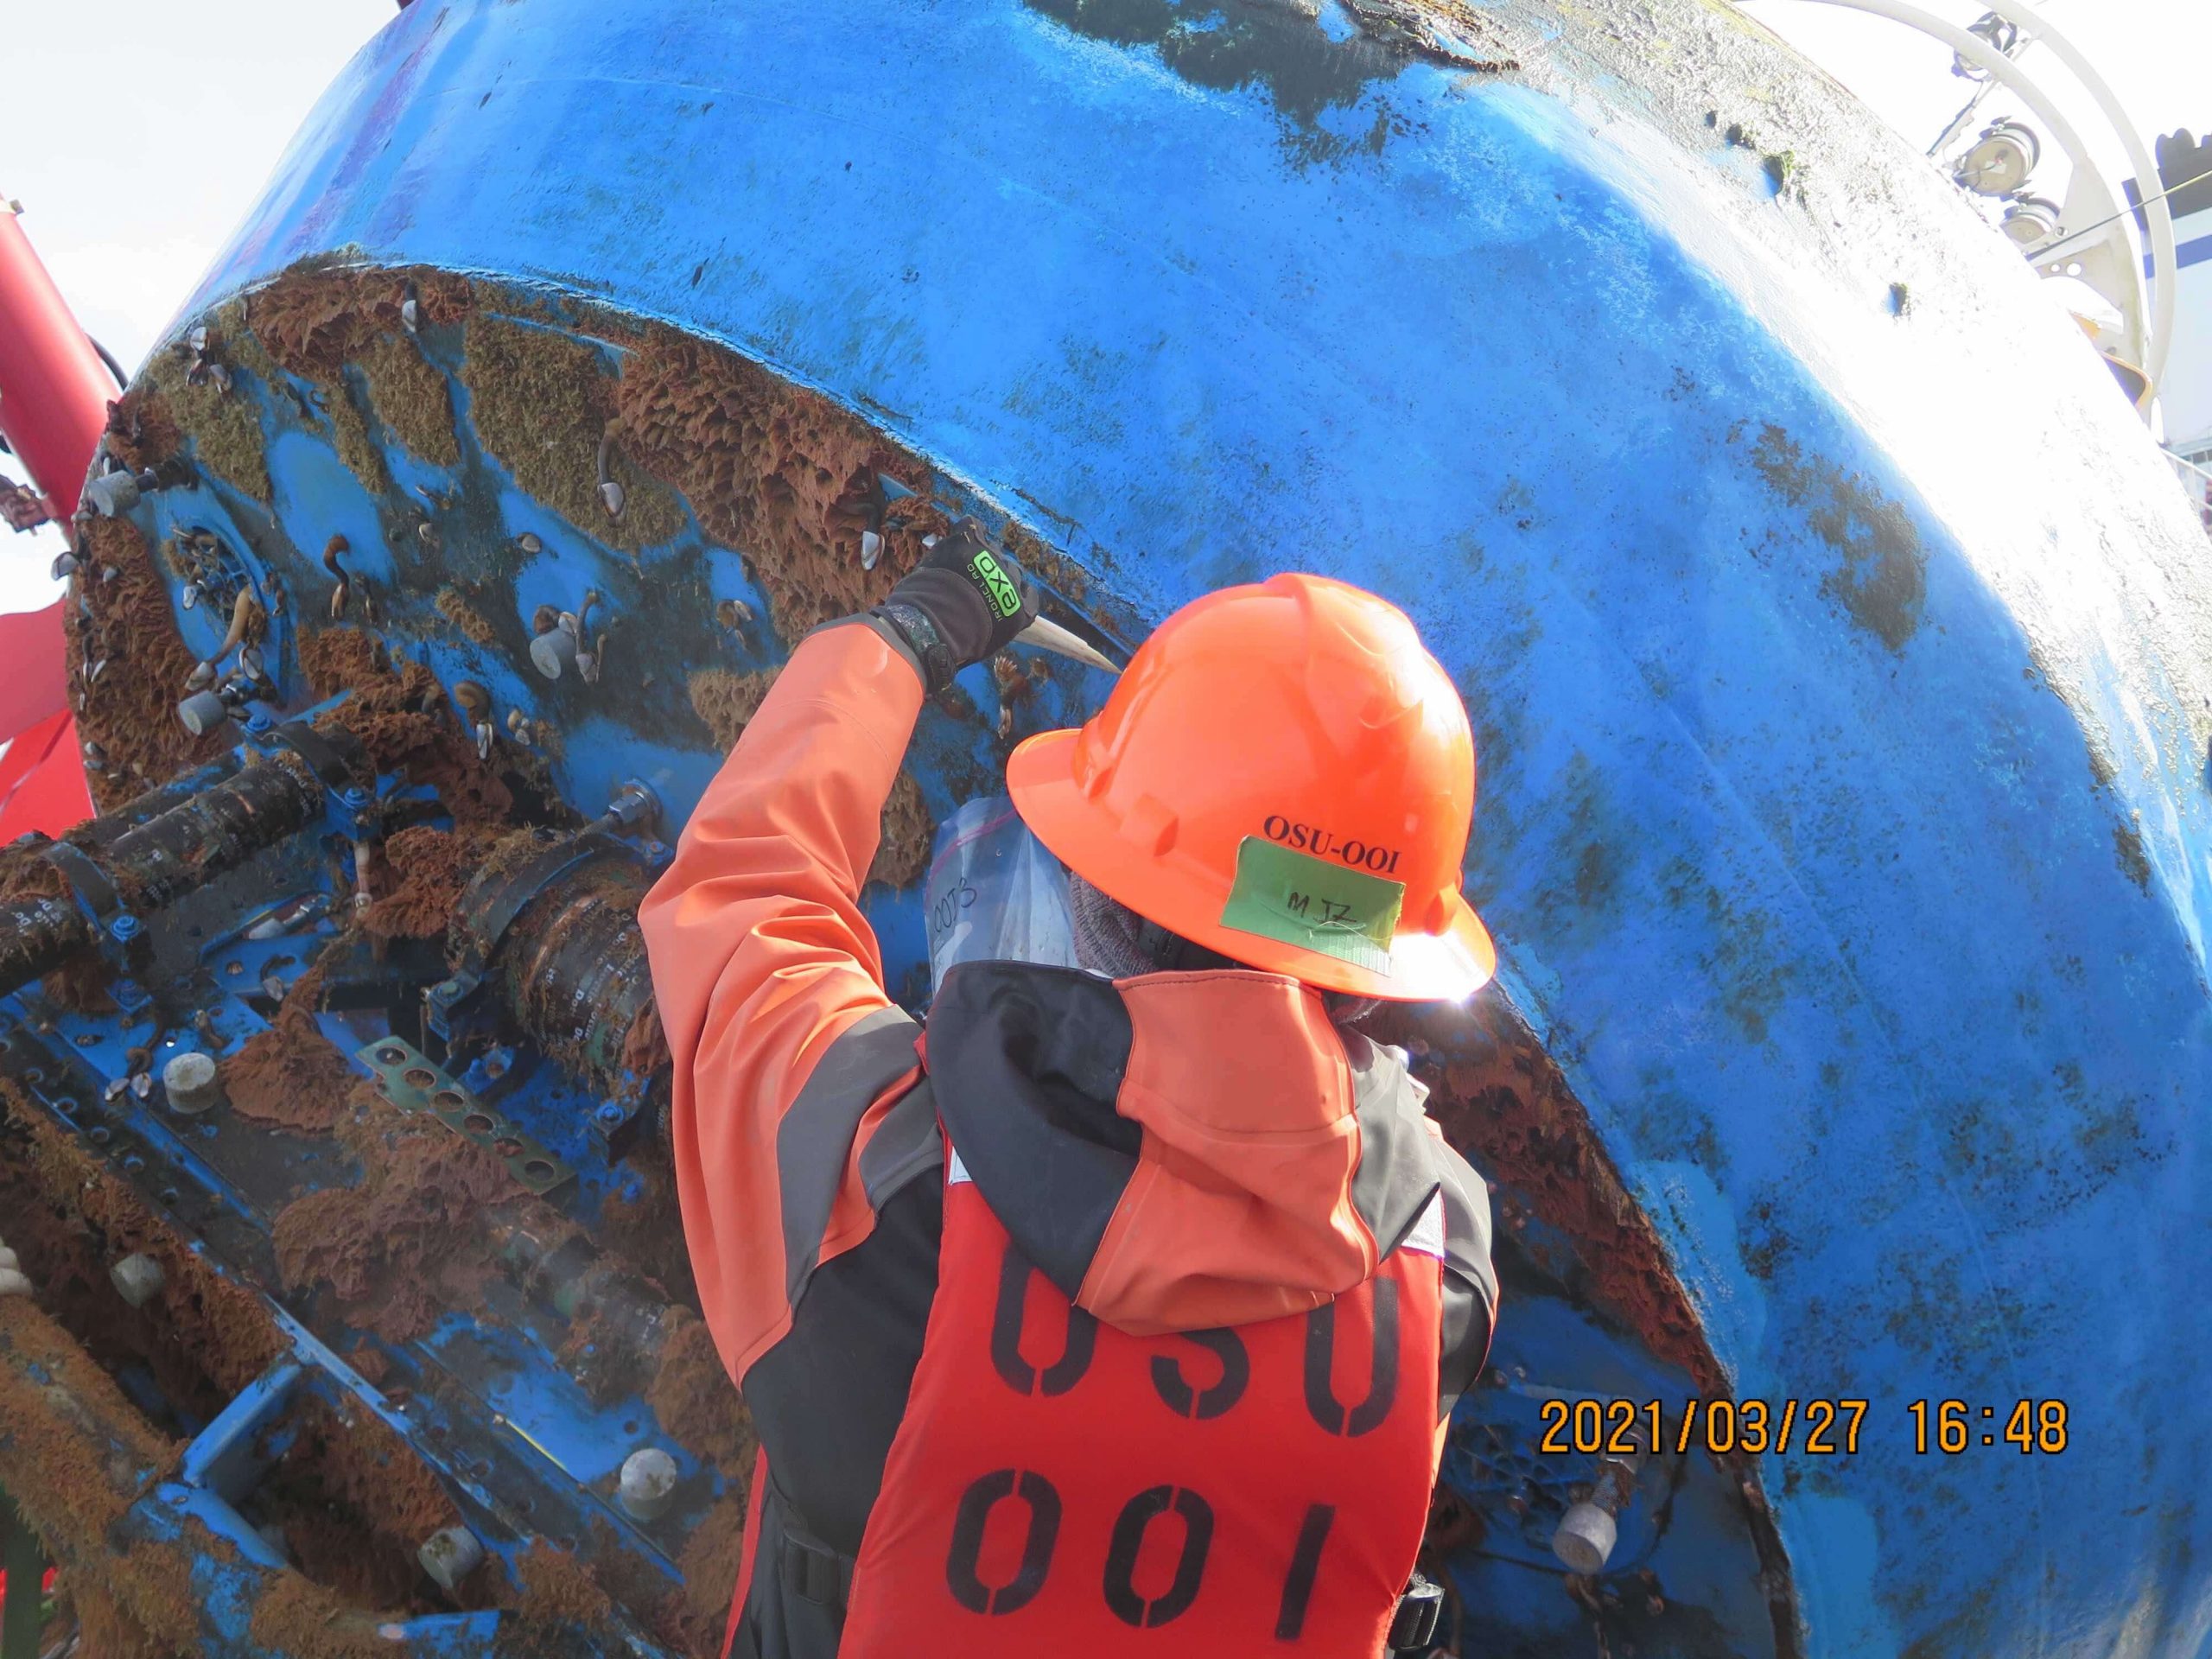
The team successfully deployed and recovered six surface moorings, four gliders, and two profilers. They also recovered two additional profilers and an anchor from 2020. In addition, the team conducted CTD water sampling and also conducted sampling for researchers with instruments on Endurance Array moorings. The team succeeded in collecting fouling communities growing on buoy panels for researcher Linsey Haram of the Smithsonian Institution and organisms on devices attached to two multi-function nodes for Oklahoma State researcher Ashley Burkett.
While in the roaring sea, the team tested potential instrument replacements and new sampling strategies. They also assessed first-time implementation of technical improvements including a new solar panel frame to prevent sea lions from unplugging the panels, an underwater camera constructed with off-the-shelf replacement parts to ensure longevity and resilience, and a stretch hose from a new manufacturer with a slightly different design than previous versions.
“In spite of having to repeatedly change our plans,” adds Fram, “we were pleased to be able to meet all of the cruise objectives. The ocean in the Pacific Northwest is too harsh for scientists to go to sea often in fall and winter, so it is important to refresh this array of autonomous platforms that will keep recording and delivering data during rough times.”
Read MoreEndurance 15 Happening in Sept
On September 8th, a science team of ten and three students from Oregon State University will depart the dock at Newport, Oregon, aboard the R/V Thomas Thompson for the 15th turn of the Coastal Endurance Array. The team will recover and deploy seven moorings. Four of the moorings are located on the Washington Shelf, with the remaining three on the Oregon Shelf. It’s a busy expedition. The team also will be recovering four and deploying three Coastal Surface Profilers and recovering three gliders that are low on power. When not turning the arrays, they will be taking CTD (connectivity, temperature, and depth) casts to verify and calibrate instrumentation. Because of the quantity of the equipment to be recovered and deployed, the cruise will consist of three legs.
“As we head to sea for the fifteenth time to turn this array, it’s remarkable to consider that the Endurance Array has been generating data for researchers, teachers, and others interested in the ocean, every day, 24/7 for the past seven years, said Jonathan Fram, who is the chief scientist for Endurance 15. “Our data has helped identify everything from warm blobs to low-oxygen events, to even the impact of forest fire smoke miles from shore.”
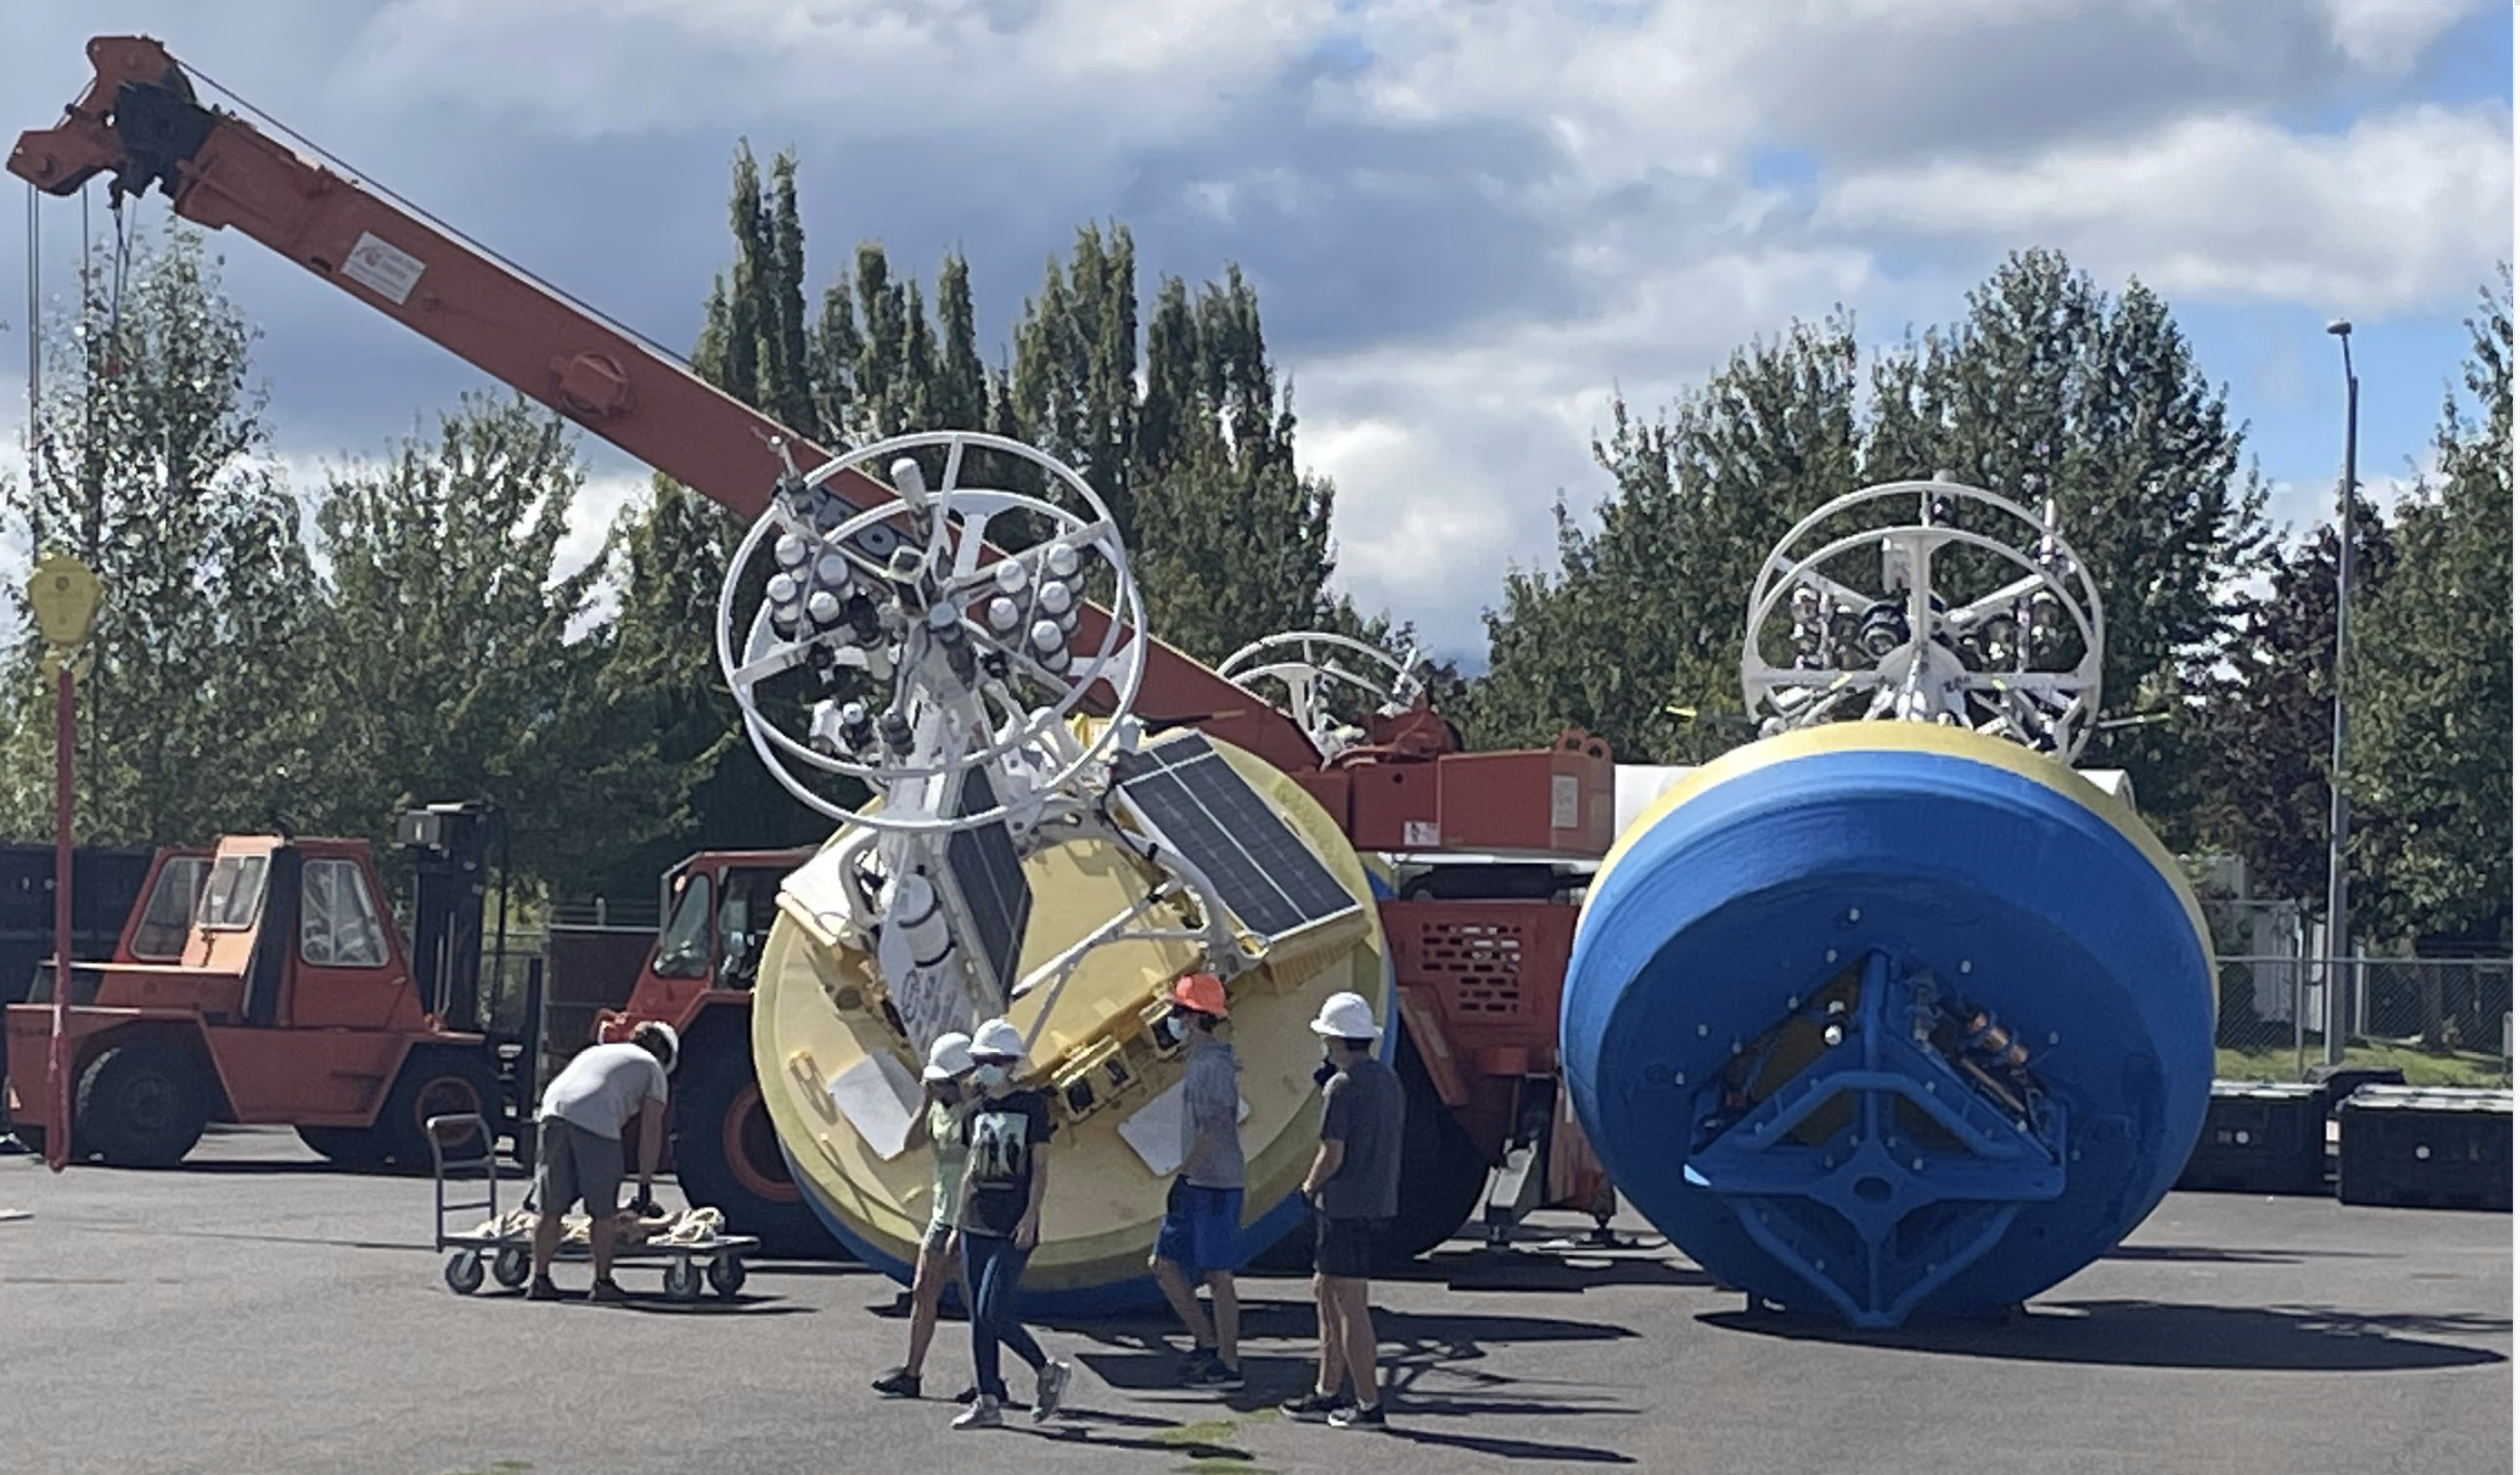
[media-caption path=”https://oceanobservatories.org/wp-content/uploads/2021/09/Screen-Shot-2021-09-03-at-3.17.24-PM.png” link=”#”]Members of the Coastal Endurance Array 15 team prepare moorings for moving to pier for loading onto the R/V Thomas Thompson. Credit: Jon Fram, OSU.[/media-caption]To help advance science, the Endurance 15 team also will be sampling for researchers with instruments on the Endurance Array moorings. The team will collect fouling communities growing on panels attached to its deployed buoys for researcher Linsey Haram of the Smithsonian Institution. They will also collect settling organisms on devices attached to two multi-function nodes for Oklahoma State researcher Ashley Burkett.
The team also will be testing potential instrument replacements and new sampling strategies for coastal moorings. Additionally, they will be assessing technical improvements to the moorings and instrumentation that range from a new solar panel frame design to prevent sea lions from unplugging the panels to improvements to cameras deployed on the moorings with off-the-shelf replacement parts to ensure longevity and resilience.
Check back here often during September as the Endurance Array 15 team shares reports and photographs of their expedition.
Read MoreTesting of New Glider Models Underway
Last fall, the Coastal Endurance team conducted an initial test run of a Slocum G3 glider to determine its capabilities and operational differences to the G2 glider, currently used by the Endurance and Coastal & Global Scale Nodes (CGSN) teams. The test was prompted by glider vendor Teledyne’s announcement that it would no longer support the G2 glider past 2023.
Both the Endurance and CGSN teams have since expanded testing. The Endurance team recently completed a two-month deployment of a G3 glider, with plans to deploy another later this summer. The CGSN team, which operates the Pioneer and two global arrays, is testing three G3 gliders. One is being tested for use as a coastal glider at the Pioneer Array and the other two are being configured for the Irminger Sea and Station Papa global sites.
“Recent testing at the Pioneer Array was really valuable for us,” said Peter Brickley, CGSN Observatory Operations Lead. “We got a chance to see that our missions were workable, we found and made the changes that were needed, and we were also able to get a better estimate of how much energy these things were going to use.”
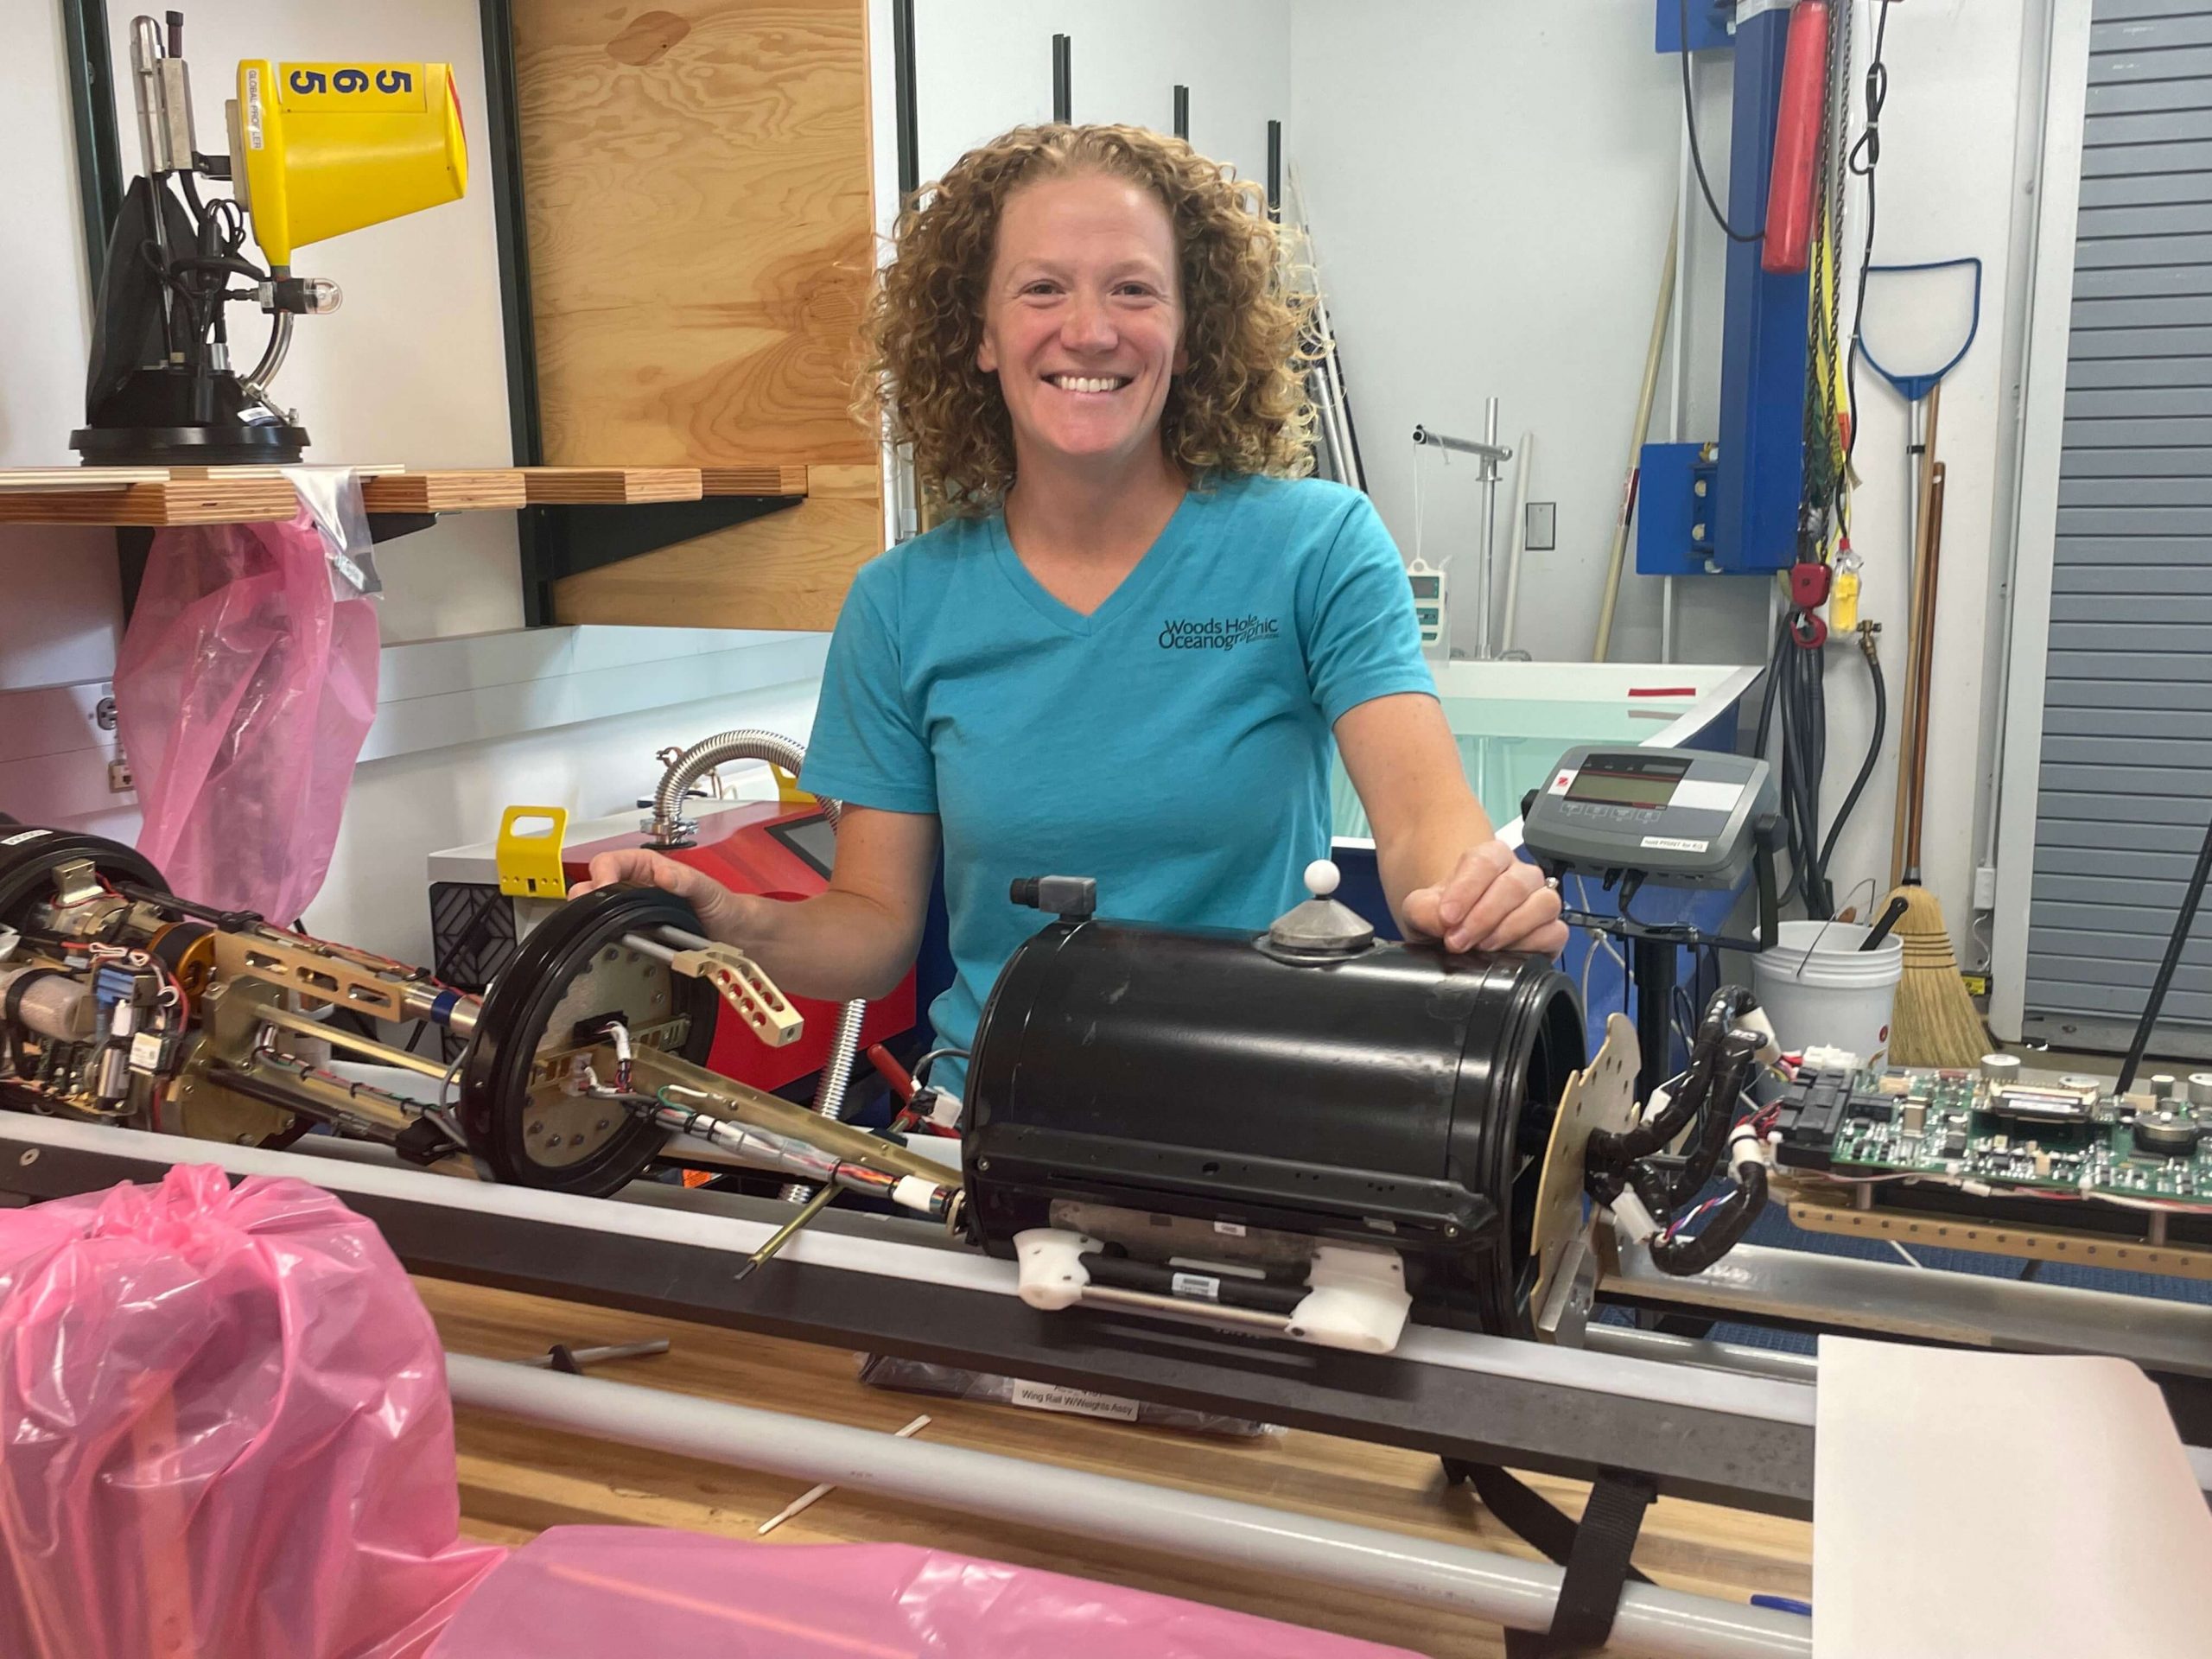
[media-caption path="https://oceanobservatories.org/wp-content/uploads/2021/07/IMG_3107-2-1-scaled.jpg" link="#"]Diana Wickman of the CGSN team at Woods Hole Oceanographic Institution is responsible for keeping the CGSN gliders operational. Here she has stripped the exterior of the glider to ensure that all internal parts are functional. Once refurbished, the gliders are tested in a water tank before being deployed at sea. Credit: Jade Lin ©WHOI.[/media-caption]The G3 gliders use more power than the G2 gliders, so the logistics of when and where they are deployed will require some adjustments. When powered by primary lithium batteries, for example, the G2 gliders can be deployed for about 90 days. The initial tests of the G3 gliders showed they could last in the water for around 75 days using primary lithium batteries. For trial runs using rechargeable batteries, the time in the water for the G3 gliders was reduced to about 30 days.
OOI is working with the vendor to evaluate operational alternatives to extend the operating window of the G3 gliders.
Improvements may require tweaking
“The rechargeable batteries are a really cool feature, but because they are about half of the energy density of the usual batteries, we’re going to have to adjust sampling schemes and plans for time in the water when we use the rechargeable batteries,” said Stuart Pearce, who works with the Endurance gliders. For now, the Endurance team intends to test the rechargeable batteries in the near shore gliders in the spring and summer when they can reliably get out to sea to recover and deploy the gliders.
G3 gliders also come equipped with larger volume buoyancy pumps than the G2 models in response to users’ feedback. “The gliders rise and fall in the water column by changing their volume and therefore density,” explained Pearce. “The new gliders have 800-1000 cubic centimeters of fluid volume to rise and dive with, compared to the 500 cubic centimeters of volume in the G2 gliders. This means that the G3 gliders can climb and dive in a greater buoyancy range.” One option being explored is whether power consumption can be reduced by adjusting the volume of the reservoir fluid needed to make the glider rise and fall.
The new G3 gliders incorporate some changes that address feedback from OOI and other users who have operated G2 gliders. “If you put anything in the ocean and use it as much as we do, you will find things that unexpectedly fail,” said Peter Brickley, CGSN Observatory Operations Lead. “We’ve been operating gliders since 2013, so we have lots of experience. In the early days, for example, we had a lot of problems with the digifin, the steering rudder that’s on the back of the vehicle. We worked closely with Teledyne to document and study this issue and they ultimately made needed improvements.” Other issues have been similarly addressed over the years.
Integrating the new G3 gliders into its Global Arrays may offer greater reliability as older G2 models are phased out. Diana Wickman, Senior Engineering Assistant II at Woods Hole Oceanographic Institution who keeps the CGSN gliders operational, explained “We need the equipment to work really well, and it needs to work for the entire year. At Pioneer, if we have problems, we can replace vehicles that are struggling with vehicles that we can refurbish in-house, but we simply can’t do that at the global sites.”
For now, the teams will continue with testing to make sure the new gliders will work for OOI’s purpose of long-term ocean monitoring.
OOI shares its glider data with the Integrated Ocean Observing System (IOOS) Glider Data Assembly Center and the OceanGliders project, which is a part of the Global Ocean Observing System (GOOS). Both serve as repositories for researchers interested in using glider data.
Read More
Oregon Sea Grant Spotlights Partner OOI
In its August 2021 newsletter, Oregon Sea Grant highlights the work of OOI’s Endurance Array Team at Oregon State University. Sea Grant Scholar Charlotte Klein interviewed the Endurance Array Principal Investigator Ed Dever, who describes some of challenges in keeping arrays operational in a challenging offshore environment.
The article can be found here, on page four.
Read MoreJupyter Notebook Produces Quality Flags for pH Data
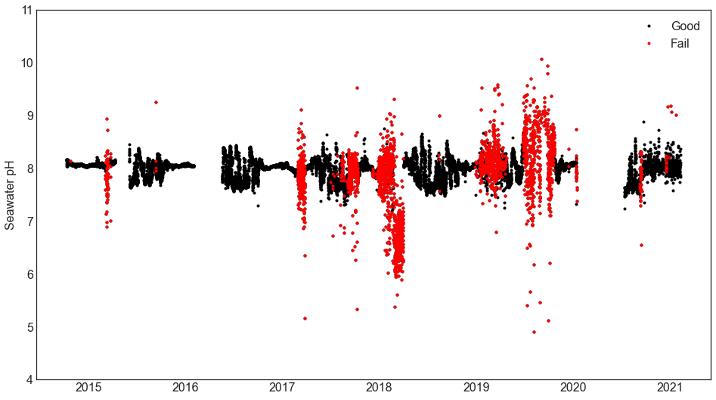
OOI uses the SAMI2-pH sensor from Sunburst Sensors, LLC to measure seawater pH throughout the different arrays. Assessing the data quality from this instrument is an involved process as there are multiple parameters produced by the instrument that are then used to calculate the seawater pH. These measurements are subject to different sources of error, and those errors can propagate through the calculations to create an erroneous seawater pH value. Based upon the vendor documentation and MATLAB code Sunburst provides to convert the raw measurements, OOI data team members have created a set of rules from those different measurements to flag the pH data as either pass, suspect or fail.
The resulting flags can be used to remove failed data from further analysis. They can also be used to help generate annotations for further Human in the Loop (HITL) QC checks of the data to help refine quality metrics for the data. OOI team member, Chris Wingard (OSU), has written up the QC process as a Python Jupyter notebook. This notebook and other example notebooks are freely available to the scientific community via the OOI GitHub site (within the OOI Data Team Python toolbox accessed from https://oceanobservatories.org/community-tools/ ).
In this notebook, Wingard shows how the quality rules can be used to remove bad pH data from a time series, and how they can be used to then create annotations. The impact of using these flags is shown with a set of before and after plots of the seawater pH as a function of temperature. The quality controlled data can then be used to estimate the seasonal cycle of pH to set climatological quality control flags.
Here an example is shown using data from a pH sensor on the Oregon Inshore Surface Mooring (CE01ISSM) near surface instrument frame (NSIF), deployed at 7 m depth (site depth is 25 m).
[media-caption path="https://oceanobservatories.org/wp-content/uploads/2021/07/EA-Highlight.png" link="#"]Figure 25: pH data from the Oregon Inshore Surface Mooring (CE01ISSM) near surface instrument frame (NSIF). Good data are shown in black, failed data in red. Note that simple range tests on the final calculated pH are often not enough to distinguish good from failed data. The automated QC processing examines intermediate measurements and fails data if intermediate measurements are outside acceptable ranges and propagated to final measurements.[/media-caption] [media-caption path="https://oceanobservatories.org/wp-content/uploads/2021/07/EA-highlight-2.png" link="#"]Figure 26: Good data together with annual cycles (red) constructed with available good data from initial deployment through 2021. Data which falls outside three standard deviations of the climatology is flagged as suspect. The climatological tests are used to flag suspect data. Simple range tests for suspect (cyan) and failed (magenta) data are also shown. The annual cycle at this site is strongly influenced by annual summer upwelling and winter storms and river plumes. The summer decrease in pH is consistent with cold, relatively acidic upwelled water high in CO2 (see e.g., Evans et al., 2011)[/media-caption]
Evans, W., B. Hales, and P. G. Strutton (2011), Seasonal cycle of surface ocean pCO2on the Oregon shelf,J. Geophys. Res., 116, C05012, doi:10.1029/2010JC006625.
Read More
