
Posts Tagged ‘Data improvements’
Update on RCA Broadband Hydrophone Data Availability, File Formats, and Directory Structure
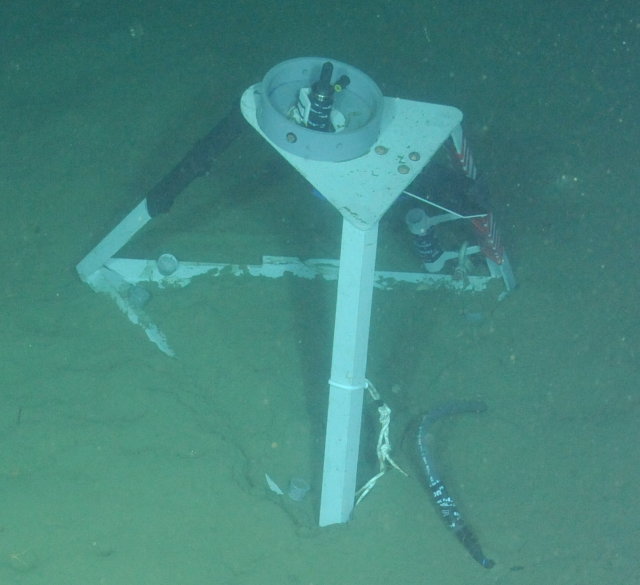
As part of continuing OOI data process improvements, the RCA Data and OOI Software Development Teams have been working closely to expand data availability and improve data file consistency for six Broadband Hydrophones (HYDBBs) located at Axial Base (2), Slope Base (2), and Oregon Offshore (1) and Shelf (1) sites. Additional details are available on these study sites and instruments at these links.
A system update will go live at 17:00 UTC June 7, 2023 and will affect all HYDBB data posted on the Raw Data Archive server after that date. In the near future, the updates will also be applied to historical HYDBB files previously posted on the Raw Data.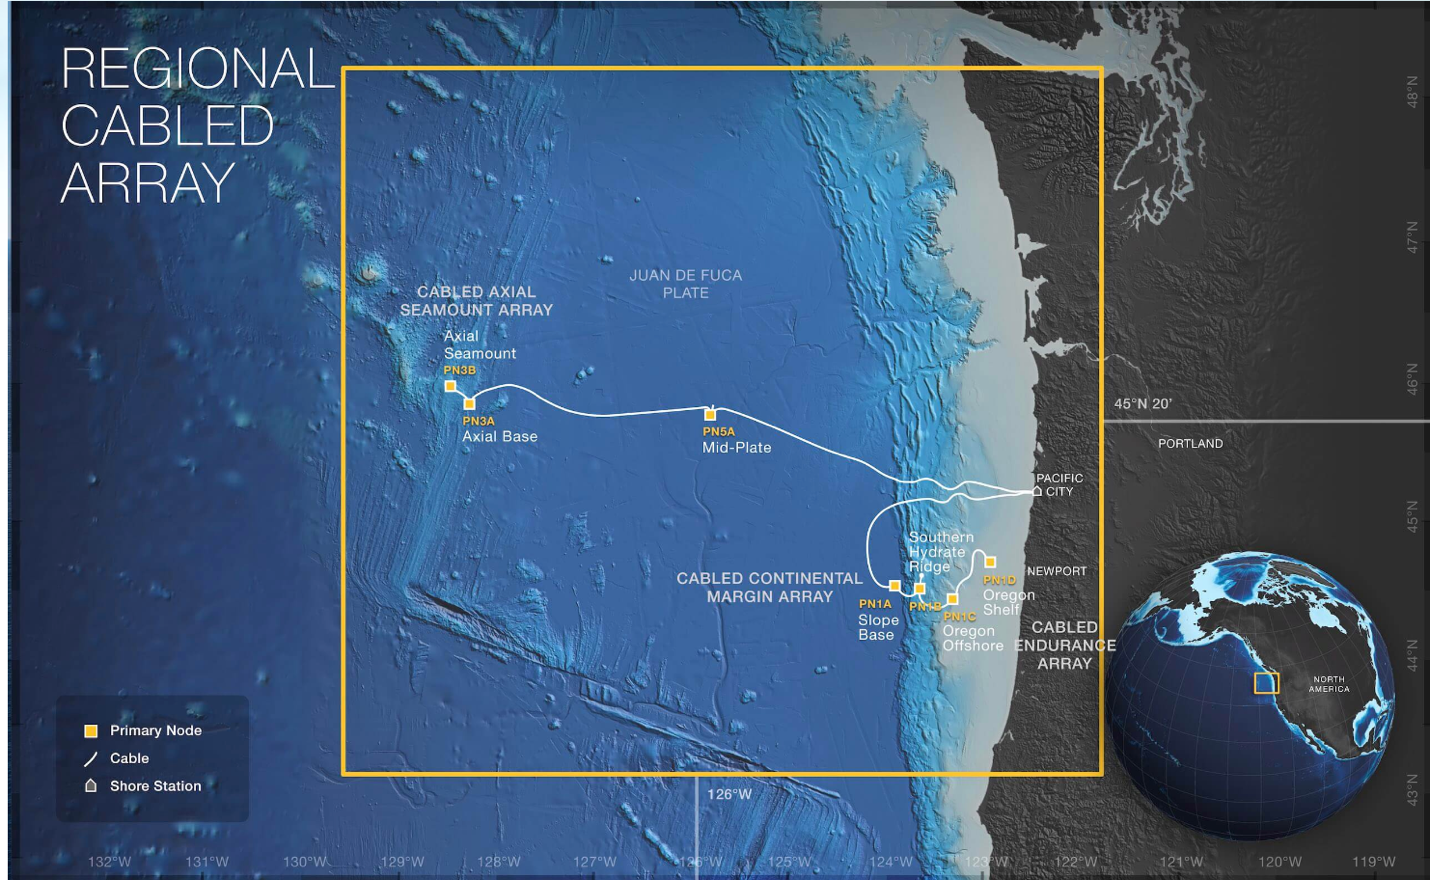
OOI HYDBB data are currently provided to the public on the OOI Raw Data Archive server as MiniSEED-formatted files (extension “.mseed”). This lossless, compressed format is a subset of the Standard for the Exchange of Earthquake Data (SEED) that is in extensive use for archiving and serving seismological data (see IRIS). The HYDBB MiniSEED files are served on the Raw Data Archive in daily subdirectories organized by year and month for each of the sites:
- Axial Seamount – Axial Base
- Continental Margin – Slope Base
- Continental Margin – Oregon Offshore
- Continental Margin – Oregon Shelf
Once the system update goes live on June 7, all HYDBB data posted on the Raw Data Archive server after this date will have the following enhancements:
- Currently, only HYDBB data arriving at the OOI data repository in near real-time are provided to the public in the daily subdirectories, updated at nominal 5-min intervals. After the system update, data arriving at the OOI repository after Navy review will also be made available on the Raw Data Archive. These delayed and previously publicly unavailable data will be provided as analogously named MiniSEED datafiles but in separate subdirectories named “addendum” under each daily directory.
- Each individual MiniSEED file will include HYDBB data over fixed 5 min timespans, starting at 00:00 UTC and repeated at subsequent 5 min intervals (beginning at 00:05, 00:10 UTC, etc.). If no data are available for a specific 5 min timespan, the datafile will not be created. Any gaps in the data stream during each 5 min timespan are accounted for by the use of the multi-trace extension of the MiniSEED file format construct, which allows multiple temporal segments within a single file. Previously, each HYDBB file on the Raw Data Archive contained only a single continuous trace of data. An example Python toolbox for accessing/processing such MiniSEED data is available, with additional information on the ObsPy open-source project here.
This change in file construction will allow for more efficient access and delivery of HYDBB data, particularly when there are small and frequent gaps in the data streams which can lead to excessive file fragmentation, as was often the case with these data before this system update.
If you have any questions, please contact the OOI HelpDesk or post your question on the public OOI Discourse Forum.
Read More
Data Stream Parameters Simplified to Ease Access

We are in the process of changing the values of data stream parameters to be more Climate and Forecast (CF) compliant and to make the data you are looking for easier to find. For example, the parameter “pressure_depth” has been renamed to simply “pressure.”
The value change process started with pressure_depth and will be ongoing in our attempt to improve access to OOI data for all users. This next round of changes is larger in scope, and changes are documented in file format (excel, .csv) and accessible on the Changes Affecting Data page. Note that the changed values will take effect immediately in the M2M interface while pre-processed staged files will take up to a week to refresh. These updates were released on August 25th at 1:00pm ET.
Should you have any questions about this process or others, please don’t hesitate to reach out to our HelpDesk.
Read MoreEfforts to Standardize Data Continue
The OOI Data Teams have recently made great strides in ongoing efforts to standardize data, making it easier for users to understand what OOI data and metadata are available. Efforts have focused on improving labeling, descriptions, and correcting units to ensure consistency. A major improvement underway is matching variable naming conventions with those governed by Climate and Forecast (CF) metadata standards.
The first round of changes is expected to be completed by the end of June 2022. Once these changes are implemented, existing scripts used to download and process OOI data files could be impacted depending on how the code was written. The Data Teams will publish a list of affected streams and recommended code updates prior to the release of these changes, to highlight the improvements and to allow for processing script modifications.
Read MoreImproving Remote System Response in Increasingly Hostile Oceans
Wind and Waves and Hydrogen, Oh My!
Improving remote system response in increasingly hostile oceans
This article is a continuation of a series about OOI Surface Moorings. In this article, OOI Integration Engineer Alexander Franks discusses the mooring software and details some of the challenges the buoy system controller code has been written to overcome.
Components of the OOI buoys working in concert make up a system that is designed for deployment in some of the most challenging areas of our world’s oceans. These systems collect valuable scientific data and send it back to Wood Hole Oceanographic Institution (WHOI) servers in near real time. Mechanical riser pieces (wire rope, and/or stretch hoses) moor the buoy to the bottom of the ocean. Foam flotation keeps the buoy above water in even the worst 100-year storm, while its masthead supports instrumentation and satellite radios that make possible the continuous relaying of data. The software controlling the system is just as important as the physical aspects that keep the system operating.
The system software has a variety of responsibilities, including setting instrument configurations and logging data, executing power schedules for instruments and parts of the mooring electronics, controlling the telemetry system, interfacing with lower-level systems including the power system controller, and distributing GPS and timing. The telemetry system is a two-way communication path, so the software controls data delivery from the buoy, but also provides operators with the ability to perform remote command and control.
[caption id="attachment_22938" align="alignnone" width="745"]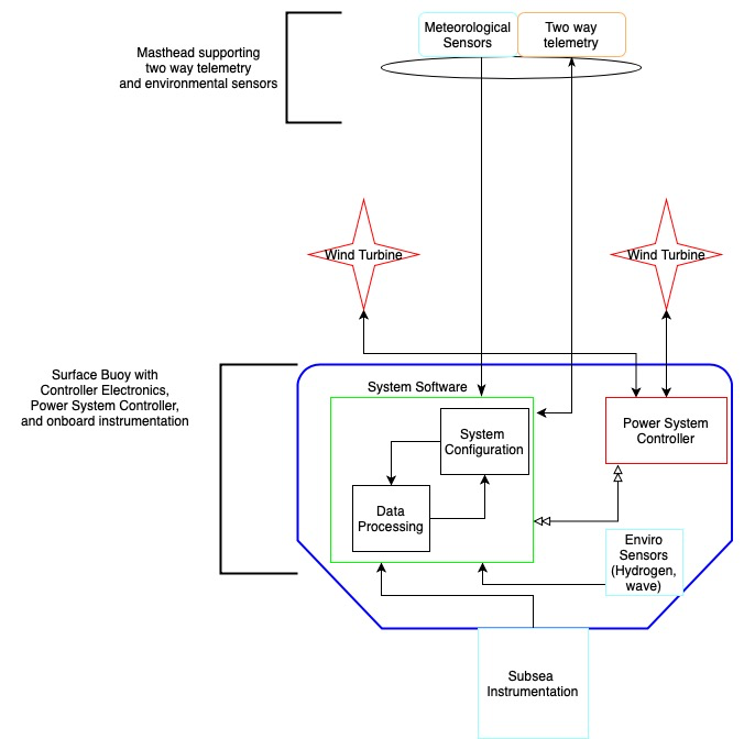 Software flow diagram created by OOI Integration Engineer Alex Franks[/caption]
The unforgiving environment and long duration deployments of OOI moorings lead to occasional system issues that require intervention. Huge storms, for example, can build waves so high that they threaten wind turbines on the moorings. At the Irminger Sea Array, ice can accumulate so much as to drastically increase the weight of the masthead, and with subsequent buoy motion, risk dunking the masthead and instruments. Other mooring functions require constant attention. The charging system must be monitored to ensure system voltages stay at safe levels and hydrogen generation within the buoy itself is kept within safe limits. Two-way satellite communication allows operators to handle decision making from shore using the most up-to-date information from the buoy.
“Since starting in 2015 and following multiple mooring builds and deployments, I’ve realized that issues can rapidly arise at any time of the day or night. I started thinking about what the buoys can do for themselves, using the data being collected onboard,” Franks said.
One of the game-changing upgrades implemented by Franks was to read environmental data and make automated buoy safety decisions in real-time that were previously performed by the team manually. For example, previously, the team would need to monitor weather forecasts and decide preemptively whether changes to buoy operations were advisable. With recent software changes, the system can now change its configuration based on a variety of sensor inputs. These variables include system voltage, ambient temperature, hydrogen levels inside the buoy well, wind speed, and buoy motion (for sea state approximation). In addition to the software updates, the engineering team redesigned the power system controller. They added charge control circuits and the ability to stop the wind turbines from spinning. The software and electrical upgrades now provide redundant automated safeguards against overcharging situations, hydrogen generation, and turbine damage, maximizing buoy operability in harsh environments.
[caption id="attachment_22946" align="alignleft" width="650"]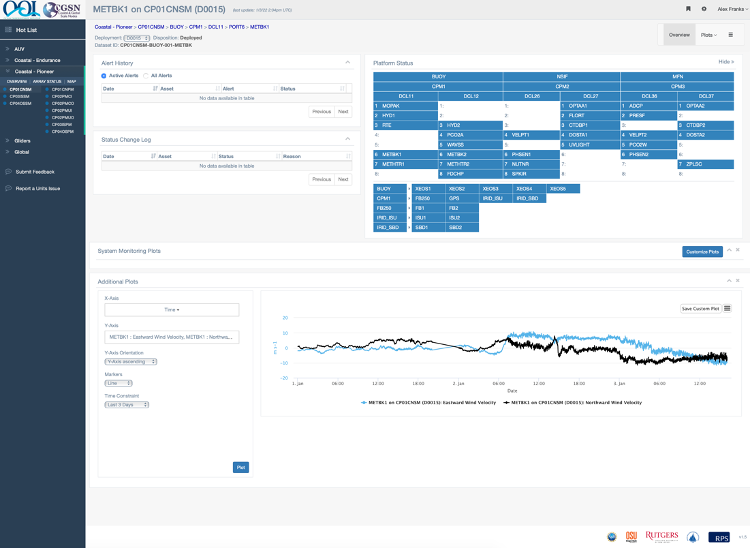 Onshore engineers are able to keep track of Irminger Sea buoys and instrumentation on this new new dashboard.[/caption]
With a largely independent system, operators also needed a way to easily monitor status of the buoys and instrumentation. The software team created a new shoreside dashboard that allows operators to set up custom alerts and alarms based on variables being collected and telemetered by the buoy. While the buoy systems can now operate autonomously, alerts and alarms maintain a human-in-the-loop component to ensure quality control.
As operations and management of the moorings have progressed, the operations team has found opportunities to fine tune how operators and the system handle edge cases of how the system responds to hardware failures and extreme weather. In the past, sometimes conditions changed faster than the data being transmitted back to shore. This new sophisticated software automates some of the buoy’s responses to changing conditions in real time, which helps to ensure their continued operation even under challenging conditions. The decreased response time to environmental and system events using an automated system, coupled with the ability to monitor and interact remotely, has increased the reliability and survivability of OOI moorings.
Read MoreNew Round of Improvements for Data Explorer
The OOI Data Team continues to listen to data users’ feedback to refine and improve Data Explorer. Many of those improvements are reflected in the latest release of Data Explorer, version 1.2, which is now operational. Data Explorer was originally released in September 2020, and this latest version is the second round of improvements made by Axiom Data Science, working with the OOI Data Team.
This version makes more OOI data accessible online and brings new features for gliders and profilers. It is also now possible to search for cruise data in the tabular search interface. Once there, you can select specific cruises, see their data profiles, and have a three-dimensional view of where the samples were taken. Glider data are also now available online and searchable by time and location. Once you’ve identified a glider of interest, it is possible to map or plot the glider’s route and compare data collected with data from other sensors. With another click, you can compare sensor data with profiler information, then change the parameters on the screen to learn more.
All data can be downloaded in csv, GeoJSON, KML, and ShapeFile formats for future use.
Additionally, discrete sample data (chemical analyses of seawater collected during shipboard verification sampling) have been added. Water samples are collected during OOI cruises at multiple depths, and analyzed for oxygen (Winkler), chlorophyll-a fluorescence and pigment distribution, nitrate/nitrite, and potentially a full nutrient suite, total DIC (dissolved inorganic carbon) and total alkalinity, pH, and salinity. These data can be used to compare to in situ instrument data or CTD casts in order to ensure OOI data quality. It is now possible to use Data Explorer 1.2 to convert discrete dissolved oxygen sample data from milliliters to micromoles and create standard_name mapping for discrete sample data.
In response to users’ feedback, many defects found in version 1.1 have been fixed. A summary of all the new features and bug fixes is available in the release notes.
“Data Explorer is a tool that allows users to access, manipulate, and understand OOI data for use in their research and classroom,” said Jeff Glatstein, OOI Data Delivery Lead and Senior Manager of Cyberinfrastructure. “Users’ feedback has been—and will continue to be— extremely useful in refining Data Explorer to ensure it meets users’ need and expectations. We are holding regular open meetings as one way to ensure that we receive timely feedback and work with our users to meet their needs.”
An open OOI Town Hall previewing some of the new and special glider-related features was held on 24 August 2021, where user input was welcomed. A recording of the session is available here.
Read MoreVideo of OOI Data Users Town Hall
On 24 August, OOI Data Lead Jeff Glatstein, Axiom Data Science Designer Brian Stone, and Axiom Data Science Coder Luke Campbell gave a preview of upcoming additions to Data Explorer that will help users access glider data. The presenters sought input from OOI’s user community to improve the platform to ensure it meets data users’ needs when it goes live in September 2021. You can see the demonstration of the upcoming Data Explorer changes in the video below and hear suggestions from OOI’s data users community.
[embed]https://vimeo.com/592362218[/embed]
Read More
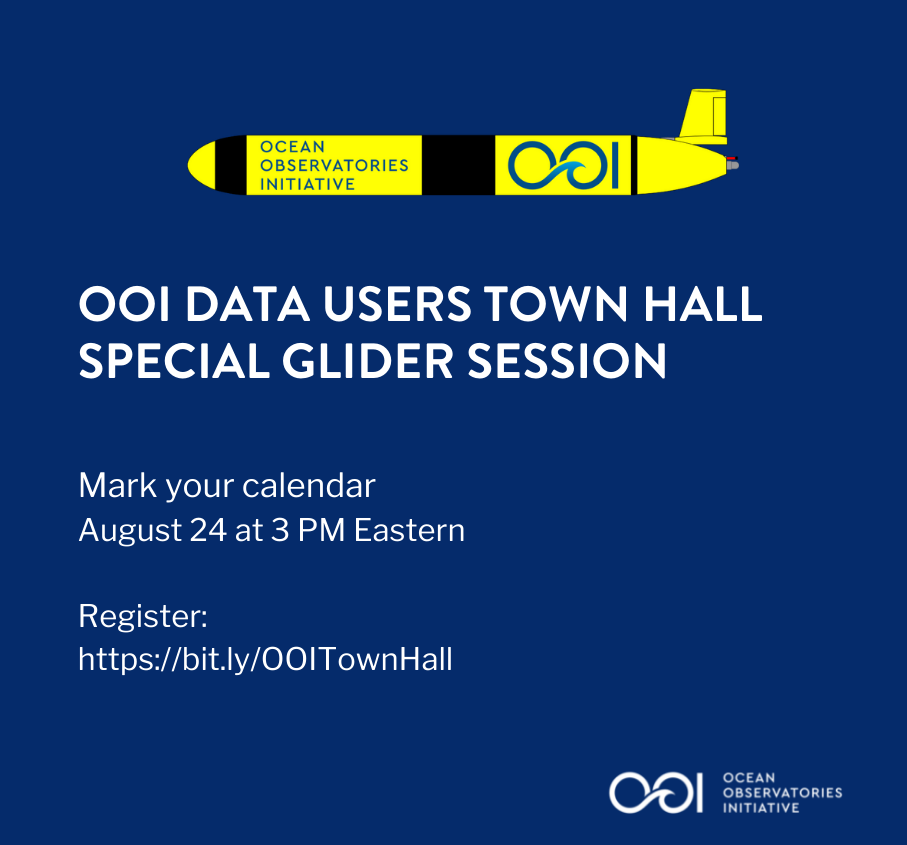
OOI Data Users Town Hall: Special Gliders Session Aug 24
OOI is seeking input from its data users. All are welcome to attend and contribute to an OOI Data Users Town Hall: Special Glider Session. The Town Hall will take place on August 24 AT 3 PM Eastern. Simply click here to register. We look forward to hearing your ideas.
Since Data Explorer’s inaugural launch in October 2020, OOI has been working with users of Data Explorer to learn what features worked for them, which could be improved, and what could be added to optimize users’ experiences. A version update (1.2) to the Data Explorer is now under development for release in early September. Among the new features include enhancements to the display and user interaction with underwater gliders.
During an upcoming Data Users Town Hall, August 24 at 3 pm Eastern, the new beta features will be demonstrated with the goal of soliciting feedback and suggestions from glider experts to ensure the tool meets users’ needs.
Here is a brief summary of the features that will be reviewed:
1) visualizations of glider previews alongside static instrument previews
2) searchable map interface for visualizing and downloading glider and discrete cruise data
3) mapping interface for finding and visualizing glider and discrete sample profiles that are within range of the selected instrument
Please register, mark your calendar, and see you soon.
Read More
A Bountiful Sea of Data: Making Echosounder Data More Useful
[media-caption path="https://oceanobservatories.org/wp-content/uploads/2021/03/Screen-Shot-2021-03-30-at-5.51.41-PM.png" link="#"]Researchers used echosounder data from the Oregon Offshore site of the Coastal Endurance Array to develop a new methodology that makes it easier to extract dominant patterns and trends.[/media-caption]The ocean is like a underwater cocktail party. Imagine, as a researcher, trying to follow a story someone is telling while other loud conversations are in the background of a recording. This phenomenon, known as the “Cocktail Party Problem,” has been studied since the 1950s (Cherry, 1953; McDermott, 2009). Oceanographers face this challenge in sorting through ocean acoustics data, with its mixture of echoes from acoustic signals sent out to probe the ocean.
Oceanographer Wu-Jung Lee and data scientist Valentina Staneva, at the University of Washington, teamed up to tackle the challenge in a multidisciplinary approach to analyze the vast amounts of data generated by echosounders on Ocean Observatories Initiative (OOI) arrays. Their findings were published in The Journal of the Acoustical Society of America, where they proposed a new methodology that uses machine learning to parse out noisy outliers from rich echosounder datasets and to summarize large volumes of data in a compact and efficient way.
This new methodology will help researchers use data from long time series and extract dominant patterns and trends in sonar echoes to allow for better interpretation of what is happening in the water column.
The ocean is highly dynamic and complex at the Oregon Offshore site of the OOI Coastal Endurance Array, where echosounder data from a cabled sonar were used in this paper. At this site, zooplankton migrate on a diurnal basis from a few hundred meters to the surface, wind-stress curl and offshore eddies interact with the coastal circulation, and a subsurface undercurrent moves poleward. The echosounder data offer opportunities to better understand the animals’ response to immediate environmental conditions and long-term trends. During the total eclipse of the Sun in August 2017, for example, echosounders captured the zooplankton’s reaction to the suddenly dimmed sunlight by moving upwards as if it was dusk time for them to swim toward the surface to feed (Barth et al, 2018).
Open access of echosounder datasets from the OOI arrays offers researchers the potential to study trends that occur over extended stretches of time or space. But commonly these rich datasets are underused because they require significant processing to parse out what is important from what is not.
Echosounders work by sending out pulses of sound waves that bounce off objects. Based on how long it takes for the reflected echo to come back to the sensor, researchers can determine the distance of the object. That data can be visualized as an echogram, an image similar to an ultrasound image of an unborn baby.
But unlike an ultrasound of a baby, when an undersea acoustic sensor records a signal, it may be a combination of signals from different sources. For example, the signal might be echoes bouncing off zooplankton or schools of fish.
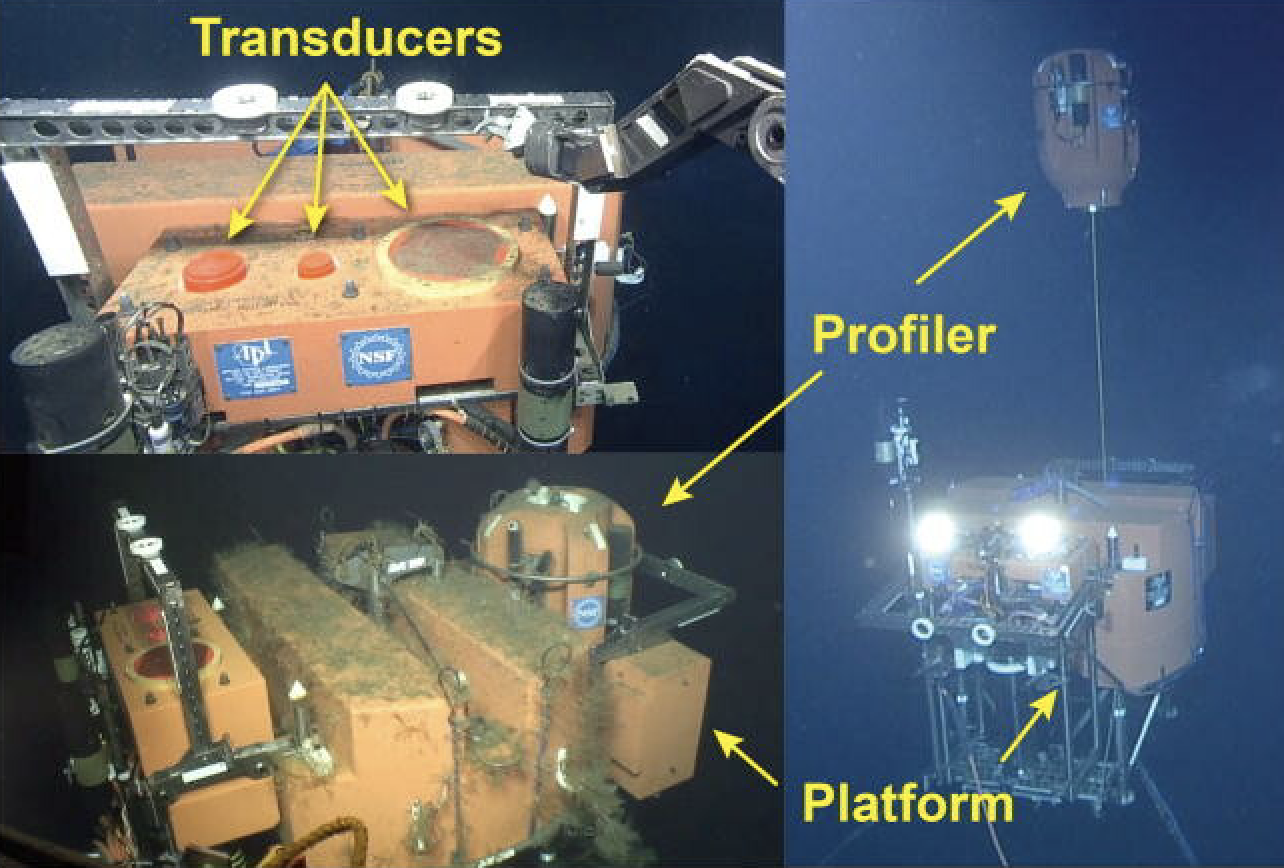
[caption id="attachment_20566" align="alignleft" width="350"]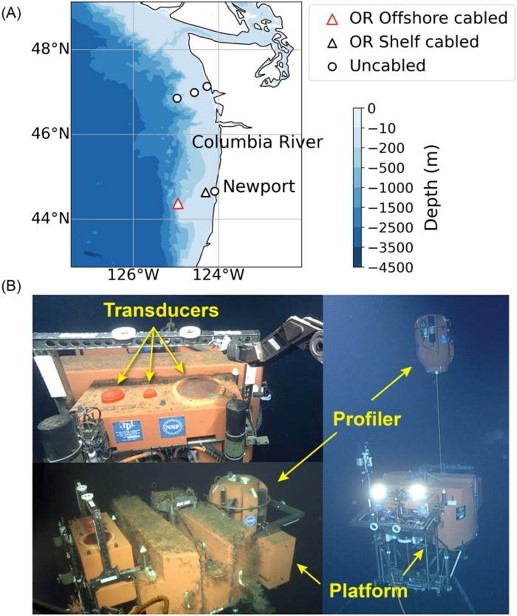 (A) Data used in this work were collected by a three-frequency echosounder installed on a Regional Cabled Array Shallow Profiler mooring hosting an underwater platform (200 m water depth) and profiler science pod located at the Oregon Offshore site of the OOI Coastal Endurance Array (red triangle). The symbols indicate the locations of all OOI echosounders installed along the coast of Oregon and Washington. (B) The transducers are integrated into the mooring platform (from left to right: 120, 200, and 38 kHz). The platform also hosts an instrumented profiler that traverses the water column above the echosounder from ~ 200 m to ~ 5m beneath the ocean’s surface. (Image credit: UW/NSF-OOI/WHOI-V15).[/caption]
“When the scatterers are of different size, they will reflect the sound at different frequencies with different strengths,” said Lee. “So, by looking at how strong an echo is at different frequencies, you will get an idea of the range of sizes that you are seeing in your echogram.”
Current echogram analysis commonly requires human judgement and physics-based models to separate the sources and obtain useful summary statistics. But for large volumes of data that span months or even years, that analysis can be too much for a person or small group of researchers to handle. Lee and Staneva’s new methodology utilizes machine learning algorithms to do this inspection automatically.
“Instead of having millions of pixels that you don’t know how to interpret, machine learning reduces the dataset to a few patterns that are easier to analyze,” said Staneva.
Machine learning ensures that the analysis will be data-driven and standardized, thus reducing the human bias and replicability challenges inherently present in manual approaches.
“That’s the really powerful part of this type of methodology,” said Lee. “To be able to go from the data-driven direction and say, what can we learn from this dataset if we do not know what may have happened in a particular location or time period.”
Lee and Staneva hope that by making the echosounder data and analytical methods open access, it will improve the democratization of data and make it more usable for everybody, even those who do not live by the ocean.
In the future, they plan to continue working together and use their new methodology to analyze the over 1000 days of echosounder data from the OOI Endurance Coastal and Regional Cabled Array region.
References
Lee, W-J and Staneva, V (2021).Compact representation of temporal processes in echosounder time series via matrix decomposition. Special Issue on Machine Learning in Acoustics. The Journal of the Acoustical Society of America.
Barth JA, Fram JP, et al. (2018). Warm Blobs, Low-Oxygen Events, and an Eclipse: The Ocean Observatories Initiative Endurance Array Captures Them All.Oceanography, Vol 31.
McDermott, J (2009). The Cocktail Party Problem.Current Biology, Vol 19, Issue 22.
Cherry EC (1953). Some Experiments on the Recognition of Speech, with One and Two Ears.The Journal of the Acoustical Society of America. Vol. 25, No.5.
Read More
Opportunity to Preview Data Explorer 1.1
OOI’s new data access and visualization tool, Data Explorer, has been operational for about six months now. During that time, OOI’s Development Team has been revising it to incorporate input from community users.
We’d like to give the OOI Community an opportunity to preview this next iteration and give us your thoughts. Please join OOI Data Lead Jeff Glatstein and members of the Data Explorer Development Team on 9 April 2021 at 2 pm Eastern. Register here. We will briefly show participants the revised tool and receive any feedback you may have. Our goal is to continually improve this tool to better meet your needs.
Look forward to seeing you in early April.
Read MoreNew Discrete Water Sampling Spreadsheets Available
To provide context and comparison for data collected by OOI instrumentation, OOI collects and disseminates data collected by shipboard underway sensors and from water samples from CTD casts. Shipboard underway data can be accessed by using username and password ‘guest’ on the OOI Alfresco Document Management System, organized by cruise. Each cruise folder contains a Ship Data folder in the format provided by the ship operators and a Water Sampling subfolder. The Water Sampling subfolder includes scanned and digitized versions of the CTD logs, as well as, discrete water sample analyses in the formats provided by the labs which conducted the analyses.
[caption id="attachment_20259" align="alignleft" width="199"] Collecting water samples from the CTD rosette on the Pioneer 8 cruise aboard the R/V Neil Armstrong. ©WHOI.[/caption]
To make these data more easily accessible to the science community, we have developed a common template to provide a full set of discrete water sample data from a cruise. These “Discrete_Sample_Summary” spreadsheets include the details for each Niskin bottle fired on a CTD cast, the CTD instrument rosette data from the time of bottle closure, and the water sample data and quality flags based on World Ocean Circulation Experiment (WOCE) standards.
These CSV files with common data formats can easily be read and manipulated in MATLAB, Python, or other computing programs and languages. Because water analysis data are received at different times from different labs, these spreadsheets are updated as data become available. An accompanying README file contains version history, general notes, and a description of the quality flags. The original spreadsheets from labs, which may contain additional data and methodology, will also be posted.
An example of how to read and use this discrete sample data can be found in this Jupyter notebook. Discrete_Sample_Summary spreadsheets have been posted for the Regional Cabled Array cruises 6-10, the Coastal Endurance Array cruises 1-13, and the Global Irminger Sea Array cruises 1-6. We will continue to work on completing spreadsheets for past cruises as well as cruises going forward.
[caption id="attachment_20261" align="aligncenter" width="640"] Comparison of dissolved oxygen data on the Washington Shelf Surface Mooring with water sampling data from Endurance Cruise 13. Data from Deployment 10 and Deployment 11 are plotted together, and overlap during 5-7 July.[/caption]
Read More
Comparison of dissolved oxygen data on the Washington Shelf Surface Mooring with water sampling data from Endurance Cruise 13. Data from Deployment 10 and Deployment 11 are plotted together, and overlap during 5-7 July.[/caption]
Read More