
Posts Tagged ‘EA’
Life on Plastics: Deep-Sea Foraminiferal Colonization Patterns and Reproductive Morphology
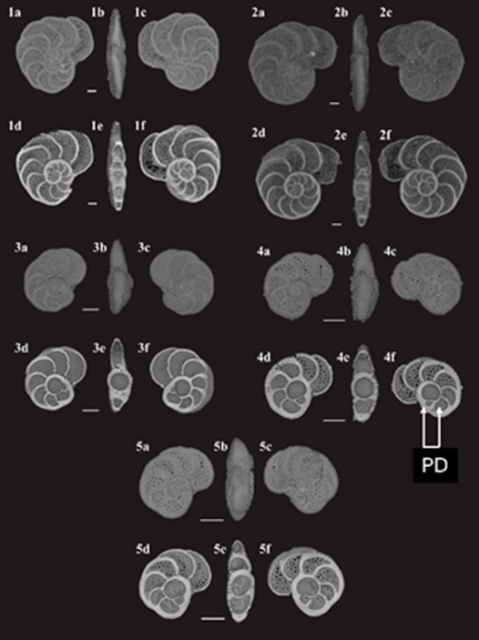
Burkett (2025) reports plastic debris has become a persistent feature of deep-sea ecosystems, yet its role as a habitat for calcifying organisms remains poorly understood. Foraminifera colonization has been observed in significant numbers on plastic surfaces, suggesting that these materials serve as novel and significant deep-sea colonization sites for these abundant calcifying organisms. Her study uses deep-sea experimental plastic substrates to examine the colonization and reproductive morphology of the benthic foraminifera Lobatula wuellerstorfi across three locations. Two sampling locations used OOI platforms on the Oregon continental margin: the Endurance Oregon Offshore site (575 m), and the Regional Cabled Array Southern Hydrate Ridge site (774 m). The third location, Station M (4000 m) was on the abyssal plain off central California. 482 individuals were analyzed for morphometric traits to investigate reproductive morphotypes. One feature examined was the proloculus diameter. The proloculus is the first chamber formed by the foraminifera. In L. wuellerstorfi, the proloculus is the spherical feature visible at the foraminifera center (see Fig. 2, specimen 4f).
The more traditional test morphology of L. wuellerstorfi —characterized by a flattened, biconvex test and consistently elevated and pore-free sutures — is well represented in the Oregon specimens. These samples also displayed a clear bimodal proloculus size distribution, consistent with alternating reproductive strategies, while Station M populations exhibited a broader, less defined bimodal distribution skewed toward megalospheric forms. This variation likely reflects environmentally driven morphologic responses rather than taxonomic divergence. Burkett’s findings demonstrate that plastics can serve as persistent colonization sites for deep-sea foraminifera, offering a unique experimental platform to investigate benthic population dynamics, ecological plasticity, and potential geochemical implications, as well as the broader impacts of foraminifera on deep-sea biodiversity and biogeochemical cycling.
[caption id="attachment_37568" align="alignnone" width="526"]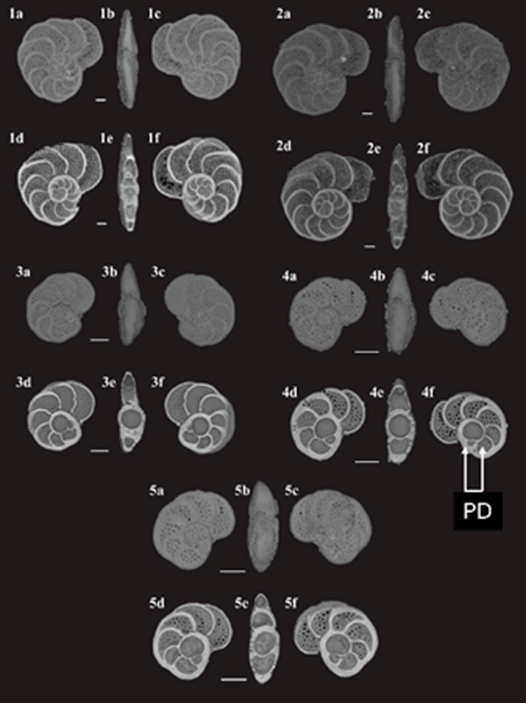 Lobatula wuellerstorfi specimens recovered from plastic substrates at the OOI Endurance Oregon Offshore (575 m water depth) after 264 days of deployment. Each specimen (1–5) is shown in six standardized views for comparative analysis. Specimens 1 and 2 represent microspheric forms; specimens 3–5 are megalospheric individuals that recently completed their first whorl and are smaller in overall test diameter. All scale bars = 100 μm. The proloculus diameter, PD, is indicated on specimen 4f.[/caption]
___________________
Reference:
Burkett, A.M. Life on Plastics: Deep-Sea Foraminiferal Colonization Patterns and Reproductive Morphology. J. Mar. Sci. Eng. 2025, 13, 1597. https://doi.org/10.3390/jmse13081597
Read MoreAccounting for Ocean Waves and Current Shear in Wind Stress Parameterization
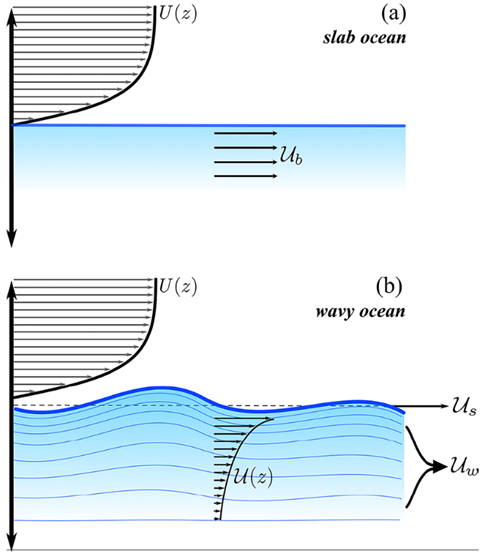
Ortiz-Suslow et al. (2025) use measurements of direct covariance wind stress, directional wave spectra, and current profiles from the OOI Coastal Endurance Array (Ocean Observatories Initiative) offshore of Newport, Oregon (2017–2023) to test a proposed new general framework for the bulk air-sea momentum flux that directly accounts for vertical current shear and surface waves in quantifying the stress at the interface. Their approach partitions the stress at the interface into viscous skin and (wave) form drag components, each applied to their relevant surface advections, which are quantified using the inertial motions within the sub-surface log layer and the modulation of waves by currents predicted by linear theory, respectively.
Their framework does not alter the overall dependence of momentum flux on mean wind forcing, and they found the largest impacts at relatively low wind speeds. Below 3 m s−1, accounting for sub-surface shear reduced form drag variation by 40–50% as compared to a current-agnostic approach. As compared to a shear-free current, i.e., slab ocean, a 35% reduction in form drag variation was found. At low wind forcing, neglecting the currents led to systematically overestimating the form stress by 20 to 50% — an effect that could not be captured by using the slab ocean approach. Their framework builds on the existing understanding of wind-wave-current interaction, yielding a novel formulation that explicitly accounts for the role of current shear and surface waves in air-sea momentum flux. Ortiz-Suslow et al. find their work holds significant implications for air-sea coupled modeling in general conditions.
In using the Oregon Shelf (CE02SHSM) data, Ortiz-Suslow et al. note, “There are several distinct advantages to using these data for this analysis: (1) the range of the dataset goes back seven years with good temporal coverage, (2) there are co-located wind, wave, and current measurements at hourly intervals for in-depth analysis, and (3) the site is exposed to a wide range of wind, wave, and current conditions. Furthermore, by using this dataset, we take advantage of internal quality data control and processing steps that are standardized across the OOI array network.”
[caption id="attachment_37363" align="alignnone" width="488"] Conceptual diagram highlighting the distinction between defining the relative wind velocity over the (a) slab ocean versus the (b) wavy interface. In the presence of near-surface shear, the relative contributions of viscous skin (Us) and wave form (Uw) must be directly accounted when calculating the relative wind at the base of the sheared wind profile (Figure 30, Ortiz-Suslow et al., 2025).[/caption]
___________________
Reference:
Ortiz-Suslow, D.G., N. Laxague, J-V. Björkqvist, M. Curcic, (2025). Accounting for Ocean Waves and Current Shear in Wind Stress Parameterization. Boundary-Layer Meteorology, 191(38), https://doi.org/10.1007/s10546-025-00926-9
Read MoreGap-Filled Dissolved Oxygen Data from the Ocean Observatories Initiative Endurance Array Inshore Moorings

Brandy Cervantes contributed the dataset described below to Zenodo. This dataset now appears in the OOI Community Datasets under the OOI home page.
The National Science Foundation Ocean Observatories Initiative (OOI) collects continuous in-situ measurements of dissolved oxygen (DO) on the Endurance Array moorings in the inner shelf region of the Oregon and Washington coasts. Aanderaa Optode 4831 oxygen sensors were deployed at 7 meters depth on the near surface instrument frame (NSIF) and on the collocated coastal surface piercing profiler (CSPP) moorings. The sensors suffer from calibration drift due to biofouling, which can cause a dramatic increase in DO during daylight hours and corresponding decrease at night compared to the conditions in the water column. This enhanced diel signal, when present, is much more pronounced on fixed-depth sensors and usually begins to occur 1-2 months after a mooring is deployed. After this biofouling issue was identified, OOI began deploying UV lamps adjacent to the oxygen sensor in spring 2018, after which there was substantial improvement in DO data quality. Each file in this dataset contains the measured near surface DO and the corrected near surface DO at the Oregon and Washington inner shelf surface moorings (ISSM) with gaps from periods of biofouling replaced with the DO measured by the CSPP.
___________________
References:
Cervantes, B. (2025). Gap-Filled Dissolved Oxygen Data from the Ocean Observatories Initiative Endurance Array Inshore Moorings [Data set]. Zenodo. https://doi.org/10.5281/zenodo.15742508
Read MoreSubsurface Temperature Anomalies off Central Oregon during 2014–2021

Brandy T. Cervantes, Melanie R. Fewings, and Craig M. Risien
Cervantes et al. (2024) use water temperature observations from a stationary oceanographic platform located in 80 m water depth off Newport, Oregon to calculate variations from the long term mean temperature at the surface, near surface, and bottom from 1999 to 2021. This site, known as NH-10, was occupied since 1999 successively by an Oregon State University National Oceanographic Partnership Program (OSU NOPP), GLOBEC Long Term Observation Program, Oregon Coastal Ocean Observing System (OrCOOS), NANOOS/CMOP. Since 2015 it has been occupied by the NSF OOI Coastal Endurance Oregon Shelf mooring (CE02SHSM). The temperature observations from these different programs that have not previously been combined into one long time series. Of particular interest are the details of the marine heatwave (MHW) periods of 2014–2016 and 2019– 2020, which had widespread impacts on marine ecosystems. Strong deviations from the mean water temperature observed near the ocean bottom during late 2016 are the largest sustained warm anomalies in the time series. The 2019–2020 period shows warm anomalies in the summer and fall that are only observed near the surface.
They also analyze the local winds during years with and without MHWs and find that spring/summer upwelling favorable, or northerly winds, which are important for bringing cold, nutrient rich water to the surface in coastal regions, interrupt MHW events and can lessen extreme heating during MHWs in coastal waters as illustrated in Figure 33.
The three periods detailed in Figure 33 show warmer daily surface temperatures during the MHW years than the non‐MHW years and several days during 2014–2016 with surface and bottom anomalies greater than 4°C and during 2014–2016 and 2019–2020 with surface anomalies greater than 4°C (Figure 12a). During upwelling favorable winds (negative wind stress), the three periods follow similar patterns with colder surface temperatures typically associated with higher wind stress magnitudes. During downwelling‐favorable winds (positive wind stress), 2014–2016 is substantially warmer at the surface than the other periods at all wind stress values.
[caption id="attachment_36388" align="alignnone" width="526"] Figure 33: 8‐Day low‐pass filtered surface temperature at NH‐10/CE02SHSM for (a) 1999–2000, (d) 2014–2015, and (g) 2019–2020; 8‐day low‐pass filtered along‐shelf surface velocity for (b) 1999–2000, (e) 2014–2015, and (h) 2019–2020; and NDBC 46050 wind stress vectors (thin light lines) and along‐shelf 8‐day wind stress (thick lines) (c) 1999–2000, (f) 2014–2015, and (i) 2019–2020. Events identified as surface marine heatwaves are shaded in gray. The thick black line in panels (a–b), (d–e), and (g–h) is the climatological mean computed over the full NH‐10 time series (Figure 33c), repeated twice, and the thin black lines are the 90th and tenth percentiles.[/caption]
___________________
References:
Cervantes, B. T., Fewings, M. R., & Risien, C. M. (2024). Subsurface temperature anomalies off central Oregon during 2014–2021. Journal of Geophysical Research: Oceans, 129, e2023JC020565. https://doi.org/10.1029/2023JC020565
Read MoreBloom Compression Alongside Marine Heatwaves Contemporary with the Oregon Upwelling Season

Black et al. (2024) examine the impacts of marine heatwave (MHW) events on upwelling-driven blooms off the Oregon coast. They combine OOI data from Endurance moorings off Oregon with satellite data and indices of upwelling and MHW presence to determine how MHW’s impact these blooms. Their work focuses on MHWs and coincident events that occurred off Oregon during the summers of 2015–2023. They found the presence of MHW’s limited the offshore extent of phytoplankton blooms. In late summer 2015 and 2019, both documented MHW years, coastal phytoplankton biomass extended on average 6 and 9 km offshore of the shelf break along the Newport Hydrographic Line, respectively. During years not influenced by anomalous warming, coastal biomass extended over 34 km offshore of the shelf break. Reduced biomass also occurs with reduced upwelling transport and nutrient flux during these anomalous warm periods. However, the enhanced front associated with a MHW aids in the compression of phytoplankton closer to shore. Over shorter events, heatwaves propagating far inshore also coincide with reduced chlorophyll a and sea-surface density at select cross-shelf locations, further supporting a physical displacement mechanism. Paired with the physiological impacts on communities, heatwave-reinforced physical confinement of blooms over the inner-shelf may have a measurable effect on the gravitational flux and alongshore transport of particulate organic carbon. Black is a PhD student at Oregon State University and notes that all data used in the paper, including of course OOI data, are open source. They provide details regarding data access methods and intermediate processing steps along with code modules to reproduce the work at https://github.com/IanTBlack/oregon-shelf-mhw.
Black et al. focus much of their analysis on the Oregon Offshore mooring, CE04 (Fig. x). Here they show individual warm events aligned with periods where Chl a was much lower than the time-series average and the climatological mean. The analysis period for 2019 had the lowest average Chl a across all years. From the CE04-derived Chl a climatology, they observed an occurrence of a regular spring bloom (April) and a summer bloom (September). The peak of the summer bloom appears contemporary with the warmest time of year at CE04, and years 2019 and 2023 were the only years that experienced MHWs during this same period. The summer blooms of 2019 and 2023 at CE04 were also noticeably suppressed and difficult to differentiate from surrounding Chl a values.
[caption id="attachment_35688" align="alignnone" width="624"] Figure 28: Ocean Observatories Initiative (OOI) CE04, Coastal Upwelling Transport Index (CUTI), and Biologically Effective Upwelling Transport Index (BEUTI) time series between 2015 and 2023. Daily mean values are in light blue. Red vertical spans indicate potential marine heatwave (MHW) events and gray vertical spans indicate the time between the spring and fall transition dates. A centered 11-d rolling mean was applied to smooth the data (black).[/caption]
___________________
Reference:
I Black, IT, Kavanaugh, MT, Reimers, CE. “Bloom compression alongside marine heatwaves contemporary with the Oregon upwelling season.” Limnology and Oceanography, no. (2024): First published: 16 December 2024, https://doi.org/10.1002/lno.12757
Read MoreImpact of Ocean Model Resolution on Temperature Inversions in the Northeast Pacific Ocean
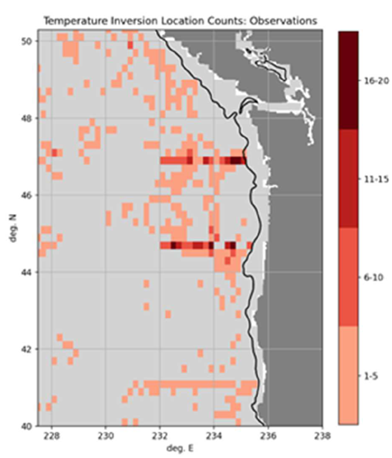
Temperature inversions are a local vertical minimum in temperature located at a shallower depth than a local maximum. In the Northeast Pacific, several water masses and multiple mechanisms for transforming or advecting ocean temperature (cold air events, upwelling, river discharge, cross-shelf eddy transport) create favorable conditions for temperature inversions. Modeling these temperature inversions is challenging. Osborne et al. (2023) analyze observations from 2020 and 2021 to characterize inversions in the Northeast Pacific. The data for these observations come largely from OOI Endurance Array gliders accessed through the GTS database. They compare the observed inversions to model results from the U.S. Navy’s Global Ocean Forecast System version 3.1 (GOFS 3.1) and two instances of the Navy Coastal Ocean Model. Temperature inversions are observed to be present in about 45% of profiles with temperature minimums between 50 – 150 m, temperature maximums between 75 – 175 m, and inversion thickness almost entirely less than 40 m. Modeled temperature inversions are present in only about 5% of model-observations comparisons, with weaker, shallower minimums. This is attributed to two primary causes: coarse model resolution at the inversion depth and the assimilation process which low-pass filters temperature, making inversions weaker. Osborn et al. identify additional work to test the impact of vertical grids on improving model performance.
[caption id="attachment_34977" align="alignnone" width="392"] Maps of inversion counts for observed profiles collected during 2020-2021 and analyzed in this work. Profiles have been filtered to be offshore of the 200 m isobath and to only one profile per collection platform per day (e.g., one profile per glider per day). Black line near the coast marks the 200 m isobath. Light gray indicates no profiles collected during the study period.[/caption]
___________________
References:
J. Osborne V, C. M. Amos and G. A. Jacobs, “Impact of Ocean Model Resolution on Temperature Inversions in the Northeast Pacific Ocean,” OCEANS 2023 – MTS/IEEE U.S. Gulf Coast, Biloxi, MS, USA, 2023, pp. 1-8, doi: 10.23919/OCEANS52994. 2023.10337390.
Read MoreDiel Vertical Migrators Respond to Short-Term Upwelling Events
Sato and Benoit-Bird, in their 2024 publication, explore how animals remain in a productive yet highly advective environment in the Northern California Current System using NSF OOI Regional Cabled Array (RCA) and Endurance Array (EA) data from the Oregon Shelf site. They characterized fish biomass using upward-looking active bio-acoustic sonar data from the RCA and interpreted results in consideration of upwelling and downwelling using EA wind data and combined cross-shelf velocity data from the RCA and EA.
Acoustic scatterers, consistent with swim bladder-bearing fish, were only present during the downwelling season as these animals avoided the cold waters associated with strong upwelling conditions in summer and fall. Fish responded to short-term upwelling events by increasing the frequency of diel vertical migration. Throughout the study, their vertical positions corresponded to the depth of minimum cross-shelf transport, providing a mechanism for retention. The observed behavioral response highlights the importance of studying ecological processes at short timescales and the ability of pelagic organisms to control their horizontal distributions through fine-tuned diel vertical migration in response to upwelling.
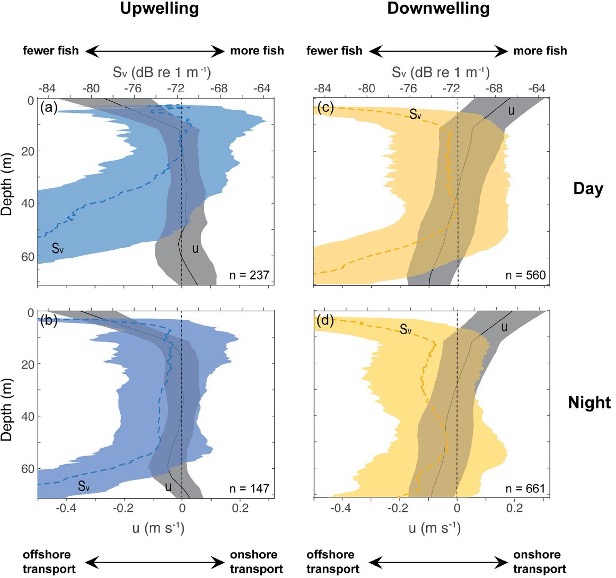
Time series data provided by the combined EA and RCA data made it possible for Sato and Benoit-Bird to perform consistent statistical analyses of bio-acoustic sonar, wind and ocean velocity data [Figure 22, after Figure 4, Sato and Benoit-Bird (2023)]. The vertical positions of scattering layers relative to the cross-shelf velocities revealed the careful positioning of animals at the depth of minimum onshore- offshore transport. The authors focused on cross-shelf transport, the most significant mechanism affecting population dynamics of pelagic organisms. During strong upwelling periods, cross-shelf velocities were strong near the surface and became nearly zero below 15-m depth. The peak scattering layers were in the upper 20 m of the water column during daytime, but organisms avoided the strong offshore currents at the surface (Figure 22a). At night, the scattering layers expanded their vertical distributions, but avoided the region nearest the bottom where onshore currents were strong (Figure 22b). During downwelling periods, scattering layers were located at the depth of minimal transport during day and night and animals avoided strong onshore currents near the surface and offshore currents near the bottom (Figures 22c and 22d).
[media-caption path="https://oceanobservatories.org/wp-content/uploads/2024/02/Science-Highlight-Feb-2024.jpg" link="#"]Figure 22: The influence of upwelling and downwelling on diel vertical migration[/media-caption]Sato and Benoit-Bird show that animals respond to the risk of offshore advection through active changes in their vertical movement that depend on upwelling conditions at daily time scales. Rapid behavioral response of animals to short-term upwelling events highlights their ability to finely tune their vertical positions relative to physical forcing which ultimately controls their horizontal distributions. This work expands our understanding of the ecological role of diel vertical migration beyond its role as a predator avoidance strategy and reveals a tight coupling between animal behavior and physical forcing.
Vertical profiles of cross-shelf velocities (u; gray, solid lines) and volume backscattering strength (Sv; colors, dotted lines), shown as mean ± standard deviations, during (a, b) strong upwelling periods with diel vertical migration and (c, d) strong downwelling periods without diel vertical migration. Data points qualified for strong upwelling and downwelling periods were selected from the time series over 14 months. Negative values in u indicate offshore transport and positive values indicate onshore transport, and larger Sv values suggest higher density of swim bladdered fish.
Read More