
Posts Tagged ‘Endurance Array’
Accounting for Ocean Waves and Current Shear in Wind Stress Parameterization
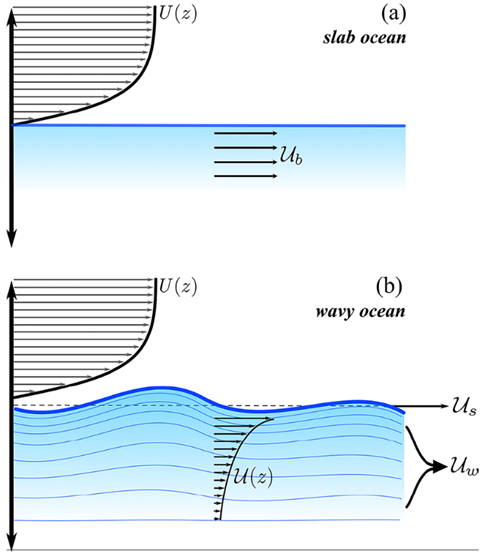
Ortiz-Suslow et al. (2025) use measurements of direct covariance wind stress, directional wave spectra, and current profiles from the OOI Coastal Endurance Array (Ocean Observatories Initiative) offshore of Newport, Oregon (2017–2023) to test a proposed new general framework for the bulk air-sea momentum flux that directly accounts for vertical current shear and surface waves in quantifying the stress at the interface. Their approach partitions the stress at the interface into viscous skin and (wave) form drag components, each applied to their relevant surface advections, which are quantified using the inertial motions within the sub-surface log layer and the modulation of waves by currents predicted by linear theory, respectively.
Their framework does not alter the overall dependence of momentum flux on mean wind forcing, and they found the largest impacts at relatively low wind speeds. Below 3 m s−1, accounting for sub-surface shear reduced form drag variation by 40–50% as compared to a current-agnostic approach. As compared to a shear-free current, i.e., slab ocean, a 35% reduction in form drag variation was found. At low wind forcing, neglecting the currents led to systematically overestimating the form stress by 20 to 50% — an effect that could not be captured by using the slab ocean approach. Their framework builds on the existing understanding of wind-wave-current interaction, yielding a novel formulation that explicitly accounts for the role of current shear and surface waves in air-sea momentum flux. Ortiz-Suslow et al. find their work holds significant implications for air-sea coupled modeling in general conditions.
In using the Oregon Shelf (CE02SHSM) data, Ortiz-Suslow et al. note, “There are several distinct advantages to using these data for this analysis: (1) the range of the dataset goes back seven years with good temporal coverage, (2) there are co-located wind, wave, and current measurements at hourly intervals for in-depth analysis, and (3) the site is exposed to a wide range of wind, wave, and current conditions. Furthermore, by using this dataset, we take advantage of internal quality data control and processing steps that are standardized across the OOI array network.”
[caption id="attachment_37363" align="alignnone" width="488"] Conceptual diagram highlighting the distinction between defining the relative wind velocity over the (a) slab ocean versus the (b) wavy interface. In the presence of near-surface shear, the relative contributions of viscous skin (Us) and wave form (Uw) must be directly accounted when calculating the relative wind at the base of the sheared wind profile (Figure 30, Ortiz-Suslow et al., 2025).[/caption]
___________________
Reference:
Ortiz-Suslow, D.G., N. Laxague, J-V. Björkqvist, M. Curcic, (2025). Accounting for Ocean Waves and Current Shear in Wind Stress Parameterization. Boundary-Layer Meteorology, 191(38), https://doi.org/10.1007/s10546-025-00926-9
Read MoreSubmarine canyon sediment transport and accumulation during sea level highstand: Interactive seasonal regimes in the head of Astoria Canyon, WA
Lahr et al. (2025) use in-situ hydrodynamic data from a benthic tripod deployment in the head of Astoria Canyon to show that sediment resuspension and transport during summer is driven by internal tides and plume-associated nonlinear internal waves. Observations of shoreward-directed currents and low shear stresses (<0.14 Pa) along with sediment trap data suggest that seasonal loading of the canyon head occurs during summer. Nearby long-term wave data from the OOI Washington Shelf mooring shows that winter storm significant wave height often exceeds 10 m, driving shear stress capable of resuspending all grain sizes present within the canyon head. Swell events are generally concurrent with downwelling flows, providing a mechanism for episodic downcanyon sediment flux. This study indicates that canyon heads can continue to function as sites of sediment winnowing and bottom boundary layer export even with a detached, shelf-depth canyon head.
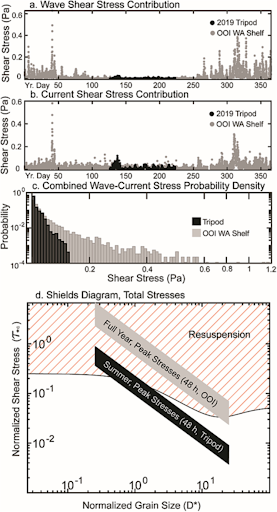
As part of this study, Lahr et al. (2025), used data from the OOI Washington Shelf Surface Mooring located 81 km north of the tripod site in Astoria Canyon. The 2019 benthic tripod deployment by Ogston was done as an ancillary activity on the Endurance 11B cruise aboard R/V Oceanus. The data used were concurrent spectral surface wave and meteorological data near bed current velocity for 2016 (chosen for its complete records). Figure xx shows the benthic tripod stress overlaid with the OOI Washington shelf mooring stress. Over the summer, the benthic tripod stress and OOI estimated stress compare well. Winter stresses (available from OOI mooring only) are much larger than those observed in summer.
[caption id="attachment_37116" align="alignnone" width="277"] Figure 1. Shear stress computed from the Astoria Canyon tripod deployment (black) and the OOI Shelf mooring (gray). Panels a) and b) depict relative stress contributions from waves and currents respectively, c) the distribution of total stresses, and d) maximum shear stresses from summer and winter on a Shields diagram. (Figure 3, Lahr et al., 2025)[/caption]
___________________
Reference:
Lahr, E.J., A.S. Ogston, J.C. Hill, H.E. Glover, and K.J. Rosenberger (2025). Submarine canyon sediment transport and accumulation during sea level highstand: Interactive seasonal regimes in the head of Astoria Canyon, WA. Marine Geology, no. (2025): 107516. https://www.sciencedirect.com/science/article/pii/S0025322725000416.
Read MoreOOI Endurance Array: December Virtual Office Hours
The OOI Endurance Array team will host monthly virtual office hours on the first Wednesday of each month at 12 PM ET / 9 AM PT.
Drop in to ask questions, connect with the team, or just stay in the loop.
Zoom Link: https://oregonstate.zoom.us/j/93329747805?pwd=31ofVyNtza6u33rGfoqXO6JZIBGn3v.1
Read MoreGap-Filled Dissolved Oxygen Data from the Ocean Observatories Initiative Endurance Array Inshore Moorings

Brandy Cervantes contributed the dataset described below to Zenodo. This dataset now appears in the OOI Community Datasets under the OOI home page.
The National Science Foundation Ocean Observatories Initiative (OOI) collects continuous in-situ measurements of dissolved oxygen (DO) on the Endurance Array moorings in the inner shelf region of the Oregon and Washington coasts. Aanderaa Optode 4831 oxygen sensors were deployed at 7 meters depth on the near surface instrument frame (NSIF) and on the collocated coastal surface piercing profiler (CSPP) moorings. The sensors suffer from calibration drift due to biofouling, which can cause a dramatic increase in DO during daylight hours and corresponding decrease at night compared to the conditions in the water column. This enhanced diel signal, when present, is much more pronounced on fixed-depth sensors and usually begins to occur 1-2 months after a mooring is deployed. After this biofouling issue was identified, OOI began deploying UV lamps adjacent to the oxygen sensor in spring 2018, after which there was substantial improvement in DO data quality. Each file in this dataset contains the measured near surface DO and the corrected near surface DO at the Oregon and Washington inner shelf surface moorings (ISSM) with gaps from periods of biofouling replaced with the DO measured by the CSPP.
___________________
References:
Cervantes, B. (2025). Gap-Filled Dissolved Oxygen Data from the Ocean Observatories Initiative Endurance Array Inshore Moorings [Data set]. Zenodo. https://doi.org/10.5281/zenodo.15742508
Read MoreSubsurface Temperature Anomalies off Central Oregon during 2014–2021

Brandy T. Cervantes, Melanie R. Fewings, and Craig M. Risien
Cervantes et al. (2024) use water temperature observations from a stationary oceanographic platform located in 80 m water depth off Newport, Oregon to calculate variations from the long term mean temperature at the surface, near surface, and bottom from 1999 to 2021. This site, known as NH-10, was occupied since 1999 successively by an Oregon State University National Oceanographic Partnership Program (OSU NOPP), GLOBEC Long Term Observation Program, Oregon Coastal Ocean Observing System (OrCOOS), NANOOS/CMOP. Since 2015 it has been occupied by the NSF OOI Coastal Endurance Oregon Shelf mooring (CE02SHSM). The temperature observations from these different programs that have not previously been combined into one long time series. Of particular interest are the details of the marine heatwave (MHW) periods of 2014–2016 and 2019– 2020, which had widespread impacts on marine ecosystems. Strong deviations from the mean water temperature observed near the ocean bottom during late 2016 are the largest sustained warm anomalies in the time series. The 2019–2020 period shows warm anomalies in the summer and fall that are only observed near the surface.
They also analyze the local winds during years with and without MHWs and find that spring/summer upwelling favorable, or northerly winds, which are important for bringing cold, nutrient rich water to the surface in coastal regions, interrupt MHW events and can lessen extreme heating during MHWs in coastal waters as illustrated in Figure 33.
The three periods detailed in Figure 33 show warmer daily surface temperatures during the MHW years than the non‐MHW years and several days during 2014–2016 with surface and bottom anomalies greater than 4°C and during 2014–2016 and 2019–2020 with surface anomalies greater than 4°C (Figure 12a). During upwelling favorable winds (negative wind stress), the three periods follow similar patterns with colder surface temperatures typically associated with higher wind stress magnitudes. During downwelling‐favorable winds (positive wind stress), 2014–2016 is substantially warmer at the surface than the other periods at all wind stress values.
[caption id="attachment_36388" align="alignnone" width="526"] Figure 33: 8‐Day low‐pass filtered surface temperature at NH‐10/CE02SHSM for (a) 1999–2000, (d) 2014–2015, and (g) 2019–2020; 8‐day low‐pass filtered along‐shelf surface velocity for (b) 1999–2000, (e) 2014–2015, and (h) 2019–2020; and NDBC 46050 wind stress vectors (thin light lines) and along‐shelf 8‐day wind stress (thick lines) (c) 1999–2000, (f) 2014–2015, and (i) 2019–2020. Events identified as surface marine heatwaves are shaded in gray. The thick black line in panels (a–b), (d–e), and (g–h) is the climatological mean computed over the full NH‐10 time series (Figure 33c), repeated twice, and the thin black lines are the 90th and tenth percentiles.[/caption]
___________________
References:
Cervantes, B. T., Fewings, M. R., & Risien, C. M. (2024). Subsurface temperature anomalies off central Oregon during 2014–2021. Journal of Geophysical Research: Oceans, 129, e2023JC020565. https://doi.org/10.1029/2023JC020565
Read MoreTagging and Tracking Large Fish Along the PNW Coast

A Navy-funded project is currently monitoring Pacific Salmon along the coasts of Oregon and Washington, using specialized tracking technology to better understand fish movements in near-real time. This effort, led by Dr. Taylor Chapple of Oregon State University, is part of the Marine Species Monitoring initiative, supported by the U.S. Navy Pacific Fleet.
While separate from the U.S. National Science Foundation’s Ocean Observatories Initiative (OOI) cruises, this project takes advantage of OOI’s Endurance Array moorings by placing Vemco VR2C tag readers on select moorings to detect and track tagged fish. The collected data provides valuable insights that could benefit commercial fishers, marine conservation efforts, and naval operations.
Tracking Salmon in Real-Time
As part of this initiative, researchers are tagging Pacific Salmon and tracking their movements using Vemco VR2C tag readers. These specialized instruments have been deployed on three OOI Endurance Array moorings: the Oregon Inshore Surface Mooring (CE01ISSM), the Washington Inshore Surface Mooring (CE06ISSM), and the Washington Shelf Surface Mooring (CE07SHSM).
When a tagged fish approaches one of these moorings, the tag reader records the encounter and transmits the data to shore within hours. This near-real-time data can be useful for commercial fishers, military operations, and other maritime stakeholders operating in the Pacific Northwest.
Expanding the Scope: Tracking Other Marine Life
Beyond salmon, the tag readers detect other marine species that have been tagged through separate research projects. These include sharks tagged from California to Alaska, sturgeon, other large fish, and even Dungeness crabs. The data collected from these detections is shared through OOI’s raw data server, contributing to a growing body of research on marine life movements in the region.
Data Access
To make the data easily available, each mooring with a tag reader generates a CSV file whenever it transmits data. These files have been combined into larger datasets, organized by mooring deployment, allowing researchers to analyze fish migration patterns and ecosystem dynamics.
By using OOI’s moorings for data collection, this project enhances our understanding of large fish movements along the Pacific Northwest coast, demonstrating the value of integrated ocean monitoring and advanced tagging technology.
To learn more and access the full dataset, visit the Tagging and Tracking of Large Fish Along the PNW Coast webpage.
Bloom Compression Alongside Marine Heatwaves Contemporary with the Oregon Upwelling Season

Black et al. (2024) examine the impacts of marine heatwave (MHW) events on upwelling-driven blooms off the Oregon coast. They combine OOI data from Endurance moorings off Oregon with satellite data and indices of upwelling and MHW presence to determine how MHW’s impact these blooms. Their work focuses on MHWs and coincident events that occurred off Oregon during the summers of 2015–2023. They found the presence of MHW’s limited the offshore extent of phytoplankton blooms. In late summer 2015 and 2019, both documented MHW years, coastal phytoplankton biomass extended on average 6 and 9 km offshore of the shelf break along the Newport Hydrographic Line, respectively. During years not influenced by anomalous warming, coastal biomass extended over 34 km offshore of the shelf break. Reduced biomass also occurs with reduced upwelling transport and nutrient flux during these anomalous warm periods. However, the enhanced front associated with a MHW aids in the compression of phytoplankton closer to shore. Over shorter events, heatwaves propagating far inshore also coincide with reduced chlorophyll a and sea-surface density at select cross-shelf locations, further supporting a physical displacement mechanism. Paired with the physiological impacts on communities, heatwave-reinforced physical confinement of blooms over the inner-shelf may have a measurable effect on the gravitational flux and alongshore transport of particulate organic carbon. Black is a PhD student at Oregon State University and notes that all data used in the paper, including of course OOI data, are open source. They provide details regarding data access methods and intermediate processing steps along with code modules to reproduce the work at https://github.com/IanTBlack/oregon-shelf-mhw.
Black et al. focus much of their analysis on the Oregon Offshore mooring, CE04 (Fig. x). Here they show individual warm events aligned with periods where Chl a was much lower than the time-series average and the climatological mean. The analysis period for 2019 had the lowest average Chl a across all years. From the CE04-derived Chl a climatology, they observed an occurrence of a regular spring bloom (April) and a summer bloom (September). The peak of the summer bloom appears contemporary with the warmest time of year at CE04, and years 2019 and 2023 were the only years that experienced MHWs during this same period. The summer blooms of 2019 and 2023 at CE04 were also noticeably suppressed and difficult to differentiate from surrounding Chl a values.
[caption id="attachment_35688" align="alignnone" width="624"] Figure 28: Ocean Observatories Initiative (OOI) CE04, Coastal Upwelling Transport Index (CUTI), and Biologically Effective Upwelling Transport Index (BEUTI) time series between 2015 and 2023. Daily mean values are in light blue. Red vertical spans indicate potential marine heatwave (MHW) events and gray vertical spans indicate the time between the spring and fall transition dates. A centered 11-d rolling mean was applied to smooth the data (black).[/caption]
___________________
Reference:
I Black, IT, Kavanaugh, MT, Reimers, CE. “Bloom compression alongside marine heatwaves contemporary with the Oregon upwelling season.” Limnology and Oceanography, no. (2024): First published: 16 December 2024, https://doi.org/10.1002/lno.12757
Read MoreExploring the Coastal Surface Piercing Profiler (CSPP): Capabilities, Challenges & Impact
The Coastal Surface Piercing Profiler (CSPP) is an important component of the Ocean Observatories Initiative (OOI), uniquely designed to collect high-resolution data from the ocean’s surface to the seafloor over the Oregon Shelf. Importantly, as the name implies, the CSPP does not stop at the ocean surface but some of its sensors actually pierces the interface into the near surface atmosphere. Operating in a highly dynamic environment, the CSPP provides valuable datasets that enhance our understanding of ocean-atmosphere interactions, nearshore processes, and biological activity in the upper water column.
In this interview, Jon Fram, co-PI and Program Manager for the Endurance Array (EA), explores the technical capabilities of the CSPP, the difficulties of operating in dynamic coastal conditions, and the significance of its unique datasets. With its ability to profile up through the air-sea interface and its collection of advanced sensors, the CSPP bridges critical gaps in ocean observation. Jon discusses the practical realities of deploying and maintaining the profiler, including a notable recovery effort that illustrates the complexity of coastal oceanographic work.
How does the CSPP operate in such a dynamic environment, and what are some of the challenges associated with deploying and maintaining it?
In between profiles, CSPPs park near the seafloor where currents from waves and tides are relatively calm. As CSPPs winch themselves up to the air-sea interface, they measure winchline tension and they alter their profiling speed to keep the tension constant. This behavior enables CSPPs to surface when waves are up to 3 meters high without the winchline over-wrapping or experiencing snap loads. We monitor conditions so CSPPs don’t profile when seas are too rough. Most of a CSPP’s battery energy goes to operating its winch, so CSPPs need to be recovered/redeployed every 2-3 months and they are limited to 2-4 profiler per day during each deployment (when conditions are sufficiently calm).
What types of sensors and instruments are on the profiler, and what specific data do they collect?
CSPPs average 25 cm/s as they profile upwards. Their CTDs sample at 16 Hz, which corresponds to a measurement every 1.5 cm. Their ~1 Hz instruments include dissolved oxygen (DOSTA), point velocity (VELPT), nitrate (NUTNR), spectral irradiance (SPKIR), photosynthetically active radiation (PARAD), and chlorophyll-a—optical backscatter—CDOM (FLORT). The CSPP is a particularly useful platform for the optical attenuation and absorption instrument (OPTAA), which can be used to characterize phytoplankton communities at the top of the water column.
What are the unique capabilities of the CSPP, and how do its datasets differ from those collected by other platforms within the OOI?
The CSPP is OOI’s only profiler that samples up to the air-sea interface.
How has the profiler contributed to understanding the relationship between atmospheric and oceanic processes in the area?
So far, OOI’s CSPPs have been used to fill in time gaps in mooring data and to fill in spatial gaps between mooring near-surface (NSIF) and benthic (MFN) data. Inshore and shelf CSPP data have been used together to calculate cross-shore exchange of nitrate, which is increased each spring due to coastal upwelling. CSPPs measure at the air-sea surface, so their measurements could be used to validate satellite data.
How could the near-time data transmission from the profiler benefit research efforts or inform stakeholders such as fisheries, conservation groups, or local communities?
Datasets are available within a week after each deployment. They can telemeter all data when they are on the surface at the top of each profile, however, we transfer only data needed for operational decisions to reduce the chance of winchline fouling.
Can you share an anecdote about a particularly challenging or rewarding moment during the deployment, maintenance, or operation of the profiler?
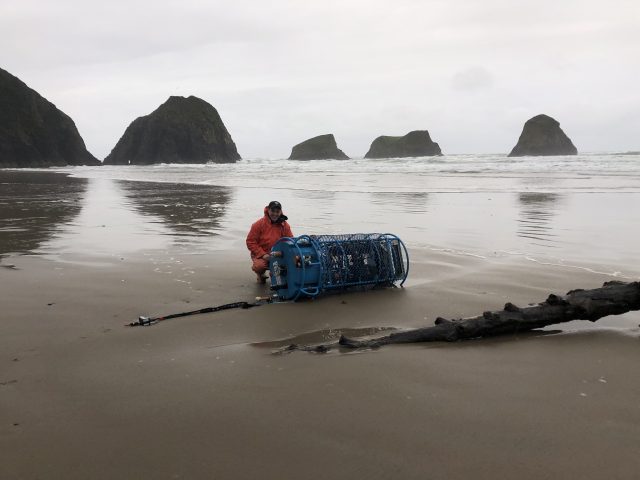
One challenging moment occurred 06 April 2019. During a storm, rough seas (~7m significant wave height, >1 m/s currents) dislodged our 25m depth Oregon Inshore CSPP and deposited it 75 nm north on a pocket beach in Ecola State Park. We climbed down to it, pulled it above the high tide line, disassembled it, and packed it out piece-by-piece up a steep trail in pouring rain. The Endurance Array inshore CSPP and adjacent surface mooring measure the northward fresh/turbid surface current that hugs the Pacific Northwest coast during winter, and which strengthens during storms. This is one example of how the CSPP data can be used to improve our wind, wave and current forecast models.
[caption id="attachment_35671" align="alignnone" width="640"]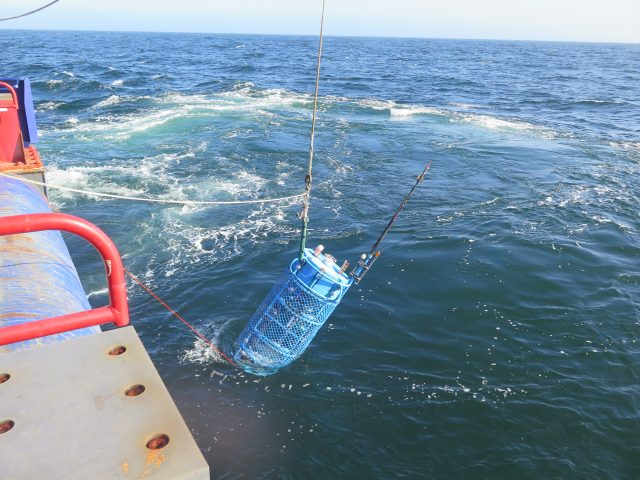 Deployment of CSPP. (c) Jon Fram[/caption]
[caption id="attachment_35670" align="alignnone" width="640"] Beach recovery effort. Pictured: Ian Black, OSU. (c): Jon Fram[/caption]
Read More
Deployment of CSPP. (c) Jon Fram[/caption]
[caption id="attachment_35670" align="alignnone" width="640"] Beach recovery effort. Pictured: Ian Black, OSU. (c): Jon Fram[/caption]
Read More Impact of Ocean Model Resolution on Temperature Inversions in the Northeast Pacific Ocean
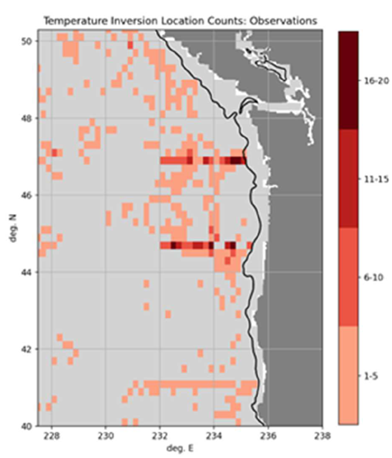
Temperature inversions are a local vertical minimum in temperature located at a shallower depth than a local maximum. In the Northeast Pacific, several water masses and multiple mechanisms for transforming or advecting ocean temperature (cold air events, upwelling, river discharge, cross-shelf eddy transport) create favorable conditions for temperature inversions. Modeling these temperature inversions is challenging. Osborne et al. (2023) analyze observations from 2020 and 2021 to characterize inversions in the Northeast Pacific. The data for these observations come largely from OOI Endurance Array gliders accessed through the GTS database. They compare the observed inversions to model results from the U.S. Navy’s Global Ocean Forecast System version 3.1 (GOFS 3.1) and two instances of the Navy Coastal Ocean Model. Temperature inversions are observed to be present in about 45% of profiles with temperature minimums between 50 – 150 m, temperature maximums between 75 – 175 m, and inversion thickness almost entirely less than 40 m. Modeled temperature inversions are present in only about 5% of model-observations comparisons, with weaker, shallower minimums. This is attributed to two primary causes: coarse model resolution at the inversion depth and the assimilation process which low-pass filters temperature, making inversions weaker. Osborn et al. identify additional work to test the impact of vertical grids on improving model performance.
[caption id="attachment_34977" align="alignnone" width="392"] Maps of inversion counts for observed profiles collected during 2020-2021 and analyzed in this work. Profiles have been filtered to be offshore of the 200 m isobath and to only one profile per collection platform per day (e.g., one profile per glider per day). Black line near the coast marks the 200 m isobath. Light gray indicates no profiles collected during the study period.[/caption]
___________________
References:
J. Osborne V, C. M. Amos and G. A. Jacobs, “Impact of Ocean Model Resolution on Temperature Inversions in the Northeast Pacific Ocean,” OCEANS 2023 – MTS/IEEE U.S. Gulf Coast, Biloxi, MS, USA, 2023, pp. 1-8, doi: 10.23919/OCEANS52994. 2023.10337390.
Read MoreUG2 Workshop ’24: A Collaborative Hub for Underwater Glider Innovation

The UG2 Workshop ’24, held from September 10-12 on the University of Michigan campus, brought together leading researchers, industry professionals, and practitioners to advance the capabilities and collaborative efforts of the underwater glider community. National Science Foundation Ocean Observatories Initiative (OOI) attendees included Ed Dever, Principal Investigator of the Northeast Pacific Endurance Array (EA), Peter Brickley, Senior Engineer with the Coastal and Global Scale Nodes (CGSN), and EA glider lead Stuart Pearce and glider tech Jonathan Whitefield. Over the course of three days, OOI participants contributed to in-depth discussions on data management, operational best practices, and emerging technologies, laying the foundation for future advancements in ocean monitoring and glider operations.
Workshop Goals and Objectives
The primary objective of UG2 is to foster a cohesive community that promotes the sharing of glider mission resources within the U.S. and internationally. The 2024 Workshop aimed to:
- Harmonize Glider Efforts: Improve data management and foster partnerships while documenting best practices to enhance collaboration.
- Share New Developments: Highlight recent advancements in sensors, glider technologies, and novel applications.
- Refine Operational Activities: Enhance strategies for sustained ocean observations and explore the impact of glider data on ocean modeling.
- Identify Action Items and Needs: Address communication gaps and improve UG2’s communication platforms for the future.
- Network with Glider Users: Facilitate interactions among U.S. and international glider users to strengthen partnerships.
Key Highlights
The workshop featured several interactive components that fostered deep engagement and collaborative dialogue:
- Liesl Hotaling’s Plenary Talk and Breakout Session: Liesl Hotaling’s plenary talk and subsequent breakout session focused on developing microcredentials for ocean technology professionals. This initiative aims to address workforce needs by creating stackable credentials that recognize core competencies. Her session, co-led with Josh Kohut, invited attendees to discuss the application of these credentials in building capacity for glider maintenance and piloting.
- Data Management Sessions (Day 2): A significant portion of Day 2 was dedicated to addressing challenges in glider data management. Facilitators Jennifer Bowers, Leila Baghdad-Brahim, and Jennifer Sevadjian led discussions on best practices for data collection, registration, and sharing. The sessions provided valuable insights into the U.S. IOOS National Glider Data Assembly Center (DAC) and efforts to standardize glider data handling, ensuring efficient management of multidimensional data. All OOI glider data are routinely reported to the DAC using code developed by Stuart Pearce and others.
- Sustained National Glider Network Session (Day 2): Daniel Rudnick and J. Xavier Prochaska facilitated this session, which emphasized the importance of a sustained glider-based observation network within the Global Ocean Observing System (GOOS). Participants explored the feasibility of creating a coordinated network that integrates coastal and basin-scale observations, building on previous efforts by the Ocean Gliders Boundary Ocean Observing Network (BOON). The OOI’s Endurance Array lines are part of the BOON along the US Pacific coast.
- Poster Presentations: The poster sessions showcased a wide range of research and operational insights. OOI contributed two posters.
- Stuart Pearce et al. presented a poster on “OOI In-Air Oxygen Calibration Adjustments and Improved Oxygen Sensor Mount,” highlighting advancements in sensor calibration for improved accuracy.
- Peter Brickley et al. showcased “OOI Glider Operations in the Mid-Atlantic Bight,” detailing operational strategies and findings from extensive glider deployments in this dynamic region.
Outcomes and Next Steps
The workshop successfully facilitated deep engagement and collaboration, resulting in several key outcomes:
- Enhanced Data Management Practices: The data management sessions provided a comprehensive overview of current challenges and future directions, including early-stage data federation efforts aimed at harmonizing international standards.
- Support for a Sustained Glider Network: The discussions around a national glider network laid the groundwork for future collaboration, emphasizing the need for long-term, high-resolution coastal and deep ocean observations.
- Advancements in Professional Training: The workshop underscored the importance of developing innovative, stackable educational opportunities to build capacity in the blue economy. These efforts aim to enhance workforce skills and provide diverse learning pathways for individuals seeking careers in ocean technology.
[caption id="attachment_34904" align="alignnone" width="640"]
 Stuart Pearce (OSU Endurance, left), Brian VerWey (OSU research glider group, center), and Jonathan Whitefield (OSU Endurance, right) pose during discussions around Brian’s poster.[/caption]
Read More
Stuart Pearce (OSU Endurance, left), Brian VerWey (OSU research glider group, center), and Jonathan Whitefield (OSU Endurance, right) pose during discussions around Brian’s poster.[/caption]
Read More