
Posts Tagged ‘Endurance Array’
Endurance Team Overcomes All Challenges to Complete its 20th Expedition
“Early spring cruises always present some weather challenges and this year was no exception,” said Coastal Endurance Project Manager and Chief Scientist on the Endurance 20 Expedition Jonathan Fram.
For this, the twentieth NSF OOI Coastal Endurance Array cruise, conditions were typical for the time of the year in the northeast Pacific. Temperatures on deck ranged from 44-52 degrees F. Winds blew in from the north at a low of 5 and up to 25 knots. Wave heights were up to 12–15-foot swells. In short, there was a lot to contend with, which forced the R/V Sikuliaq and the Endurance 20 team to sit it out in port for two weather days, waiting for conditions to abate.
“We re-arranged the schedule to take advantage of intermittent weather windows and are pleased that we succeeded in accomplishing almost all of our mission objectives. We appreciate being one of the first cruises of the year because it allows us to get fresh moorings in the water around the time of spring transition. In spring, the predominant wind direction shifts to from the North, which upwells water along the West Coast.”
Despite the less-than-ideal working conditions, the Endurance 20 team and crew of the Sikuliaq got the job done. They successfully completed all cruise activities except for the deployment of the Washington Inshore Coastal Surface Piercing Profiler and one glider. Both had failed pre-deployment checks. Since both gliders and CSPPs can be deployed from smaller boats, the decision was made to hold their deployments. Ship reservation requests have already been made to get them into the water later this spring.
In total, the team recovered and deployed six surface moorings (two battery powered buoys and four large buoys powered by wind and solar energy), one offshore and two surface piercing profiler moorings (CSPP), and three gliders. One glider experiencing navigation issues was recovered. CTD casts (to measure conductivity, temperature, and depth) and water sampling were conducted along with each mooring operation.
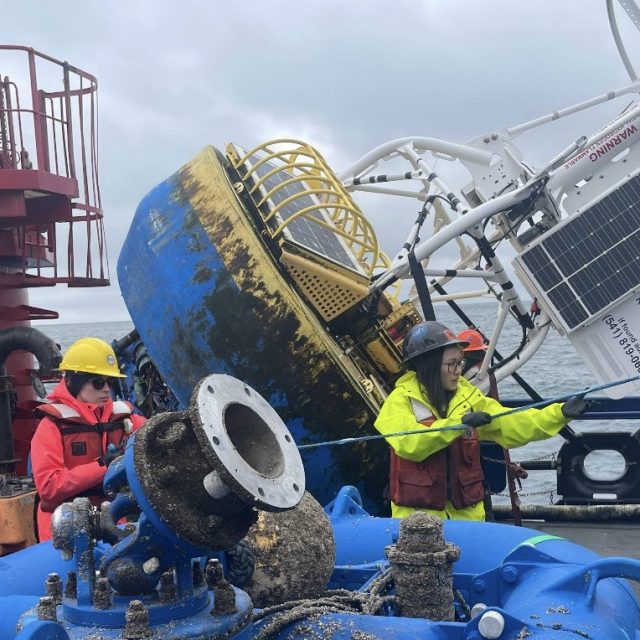
[media-caption path="https://oceanobservatories.org/wp-content/uploads/2024/04/Sea-lions.jpeg" link="#"]California sea-lions haul out on Endurance Array shelf buoys during the day. These buoys ride higher at night, which corresponds to when the sea-lions leave to feed. Aluminum guards keep the sea-lions off the solar panels and prevent sea-lions from chewing wires and connectors. The team sprayed off biofouling after getting the buoy on board. Credit: Jonathan Fram, OSU.[/media-caption]The expedition marked several firsts: This was the first cruise in which all buoy deck solar panels on all moorings operated for the entire previous deployment. This was also the first deployment in which all buoys incorporated new sea lion guards, thanks to the idea and implementation by Deck Lead Alex Wick. This was also the first time that Raelynn Heinitz took the reins of deck lead from Alex Wick. There were other less notable firsts. A field of crab pots surrounded the Inshore Washington Mooring. One derelict pot was even found far offshore wrapped around the Washington shelf mooring. The crab pots posed extra hazards that the Sikuliaq and recovery team had to maneuver around.
[media-caption path="https://oceanobservatories.org/wp-content/uploads/2024/04/Crab-pots-.jpg" link="#"]Image of crab pots surrounding the ship as the R/V Sikuliaq and the Endurance 20 team were adjacent to the Washington Inshore Surface Mooring. The primary purpose of this radar is to detect sea ice, but it works well on crab pot floats too. The circle’s radius is ¾ nautical miles. Credit: Jonathan Fram, OSU.[/media-caption]In addition to the mission objectives, the Endurance Team successfully completed ancillary scientific operations. They helped scientific partners University of South Carolina researcher Eric Tappa and Oregon State University student Faith Schell recover and deploy a sediment trap adjacent to OOI’s Oregon Slope Base site. This is part of an ongoing research effort of OSU Associate Professor Jennifer Fehrenbacher and USC Professor Claudia Benitez-Nelson, who study the geochemistry, biomineralization, and marine biology of the sediments. The Team also deployed fish tag readers for OSU Assistant Professor Taylor Chapple to support his work studying sharks and other large marine predators.
“These ongoing collaborations with scientists are beneficial to everyone,” added Fram. “They not only maximize the use of ship time but increase the understanding of the areas in which we are gathering data. Plus, it’s great for us who do the data gathering to interact directly with the scientists who are using the data.”
A review of the day-to-day operations of the Endurance 20 Team can be found here.
Read More
Diel Vertical Migrators Respond to Short-Term Upwelling Events
Sato and Benoit-Bird, in their 2024 publication, explore how animals remain in a productive yet highly advective environment in the Northern California Current System using NSF OOI Regional Cabled Array (RCA) and Endurance Array (EA) data from the Oregon Shelf site. They characterized fish biomass using upward-looking active bio-acoustic sonar data from the RCA and interpreted results in consideration of upwelling and downwelling using EA wind data and combined cross-shelf velocity data from the RCA and EA.
Acoustic scatterers, consistent with swim bladder-bearing fish, were only present during the downwelling season as these animals avoided the cold waters associated with strong upwelling conditions in summer and fall. Fish responded to short-term upwelling events by increasing the frequency of diel vertical migration. Throughout the study, their vertical positions corresponded to the depth of minimum cross-shelf transport, providing a mechanism for retention. The observed behavioral response highlights the importance of studying ecological processes at short timescales and the ability of pelagic organisms to control their horizontal distributions through fine-tuned diel vertical migration in response to upwelling.
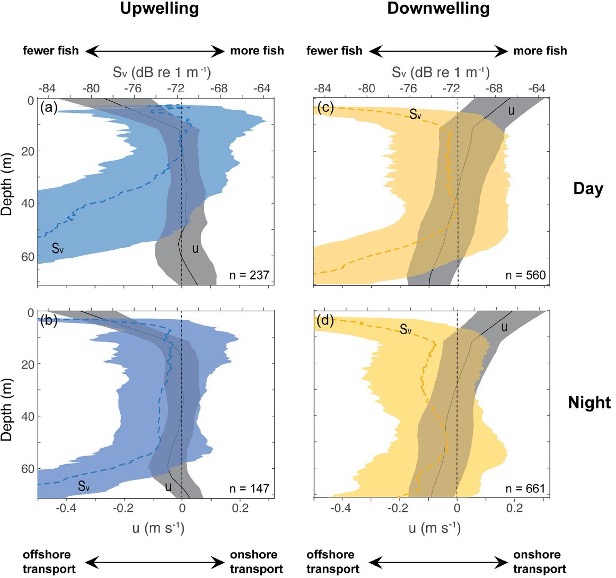
Time series data provided by the combined EA and RCA data made it possible for Sato and Benoit-Bird to perform consistent statistical analyses of bio-acoustic sonar, wind and ocean velocity data [Figure 22, after Figure 4, Sato and Benoit-Bird (2023)]. The vertical positions of scattering layers relative to the cross-shelf velocities revealed the careful positioning of animals at the depth of minimum onshore- offshore transport. The authors focused on cross-shelf transport, the most significant mechanism affecting population dynamics of pelagic organisms. During strong upwelling periods, cross-shelf velocities were strong near the surface and became nearly zero below 15-m depth. The peak scattering layers were in the upper 20 m of the water column during daytime, but organisms avoided the strong offshore currents at the surface (Figure 22a). At night, the scattering layers expanded their vertical distributions, but avoided the region nearest the bottom where onshore currents were strong (Figure 22b). During downwelling periods, scattering layers were located at the depth of minimal transport during day and night and animals avoided strong onshore currents near the surface and offshore currents near the bottom (Figures 22c and 22d).
[media-caption path="https://oceanobservatories.org/wp-content/uploads/2024/02/Science-Highlight-Feb-2024.jpg" link="#"]Figure 22: The influence of upwelling and downwelling on diel vertical migration[/media-caption]Sato and Benoit-Bird show that animals respond to the risk of offshore advection through active changes in their vertical movement that depend on upwelling conditions at daily time scales. Rapid behavioral response of animals to short-term upwelling events highlights their ability to finely tune their vertical positions relative to physical forcing which ultimately controls their horizontal distributions. This work expands our understanding of the ecological role of diel vertical migration beyond its role as a predator avoidance strategy and reveals a tight coupling between animal behavior and physical forcing.
Vertical profiles of cross-shelf velocities (u; gray, solid lines) and volume backscattering strength (Sv; colors, dotted lines), shown as mean ± standard deviations, during (a, b) strong upwelling periods with diel vertical migration and (c, d) strong downwelling periods without diel vertical migration. Data points qualified for strong upwelling and downwelling periods were selected from the time series over 14 months. Negative values in u indicate offshore transport and positive values indicate onshore transport, and larger Sv values suggest higher density of swim bladdered fish.
Read More
Battling the Corrosive Properties of Seawater
OOI engineers face the challenge of keeping ocean observing equipment operational in demanding locations for up to a year at a time. In addition to wind, waves, extreme pressure, ship traffic and trawling disruption, engineers continually battle the corrosive properties of salt water.
Senior Technician for OOI’s Coastal Endurance Array Kristin Politano provided a primer on OOI’s tactics to prevent corrosion of its equipment and instrumentation. “It’s a fun balancing act between cost versus strength versus weight versus durability. Different metals are great for certain things, so we use them in different places.”
OOI engineers try to avoid all forms of corrosion, especially galvanic corrosion, an electrochemical process where one metal corrodes preferentially in the presence of an electrolyte. In this case, seawater serves as the electrolyte or the corrosion “enabler.” When two dissimilar metals are connected in seawater, one of them is going to corrode faster than the other.
Since zinc is very prone to corrosion and corrodes much faster than other materials used on OOI moorings, engineers use it as a “sacrificial lamb” in OOI operations. They place zinc strategically on the moorings to encourage galvanic corrosion to occur on the zinc, rather than degrading instruments, electronics, and the frames that hold the moorings and instrumentation in place.
Politano gave an example of how zinc works to protect other metals used on the moorings. Aluminum is used on the Coastal Surface Piercing Profiler frames (CSPP), the Near-Surface Instrument Frames (NSIF), a cage that contains ocean observing instruments below surface moorings, and Multi-function Nodes (MFN) frames, which are at the base of some surface moorings and act both as anchors as well as platforms to affix instruments.
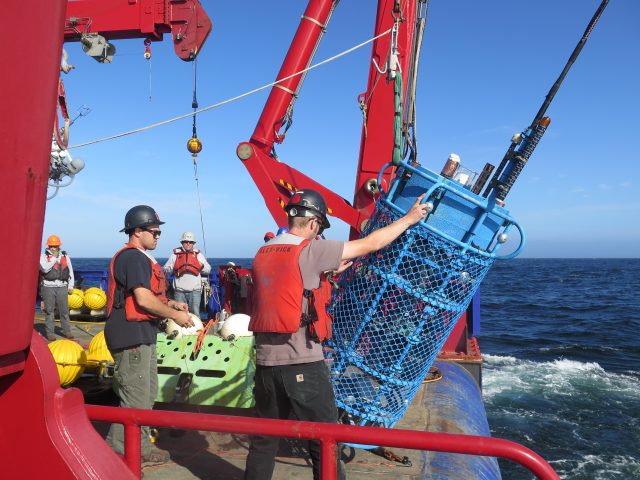
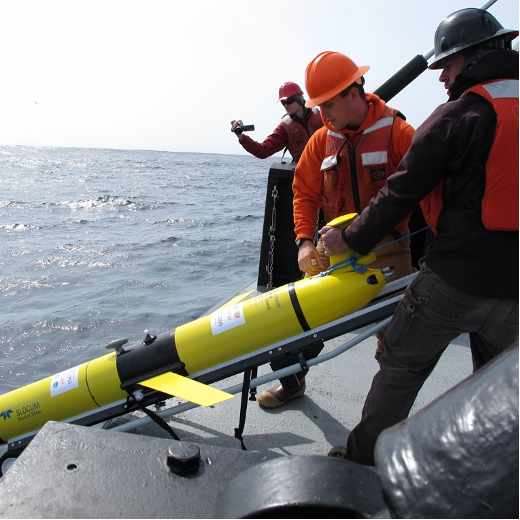
[media-caption path="https://oceanobservatories.org/wp-content/uploads/2024/01/IMG_376765-scaled.jpg" link="#"]Members of the Coastal Endurance Team deploy a Coastal Surface Piercing Profiler (CSPP) into the Pacific off the coast of Oregon. The zincs are the bare metal disks attached to the CSPP frame near loops at the top of the frame. Credit: Jon Fram, OSU.[/media-caption]The NSIF, MFN, and CSPP have sacrificial zinc cylinders attached so that when the frames containing the instruments go into the water, the aluminum doesn’t degrade as quickly as it might otherwise. The zinc will degrade first, providing a protective layer for the important assets within the frames. “Zinc serves as a really effective form of galvanic corrosion protection,” Politano added. “Zincs come in many different form factors, but we use ones that can be bolted directly to the mooring frames and other mechanical components,” said Politano.
Location Dictates Effectiveness
Zincs are used on both the Coastal Endurance’s inshore and offshore mooring platforms. The zincs on the inshore platforms dissolve faster and require replacement more often due to low dissolved oxygen conditions and that encourage corrosion. Zincs on the offshore moorings last longer due to a higher oxygenated environment offshore.
Decisions about materials to use on various parts of the moorings also in part, depends on durability, conditions, and cost. Stainless steel is very durable and reacts to form a protective oxide film on its outer surface, but this reaction needs oxygen to grow and repair itself. In areas with hypoxia (lack of oxygen) particularly in the summer months, there is not enough oxygen in the water column for the stainless oxide layer to rebuild and repair itself.
[media-caption path="https://oceanobservatories.org/wp-content/uploads/2024/01/MFN.jpg" link="#"]Coastal Pioneer Array Team members get ready to deploy a 9000-pound multi-function node off the coast of Martha’s Vineyard. Credit: Rebecca Travis © WHOI.[/media-caption]Delrin, a high-grade plastic (acetyl resin), is also used on the moorings as a corrosion preventive measure. Because of Delrin’s durability, stiffness, light weight, and water resistance, Delrin is used in instrument housings and electrical panels because it doesn’t conduct electricity, but it lacks the strength of aluminum. “Delrin is strong, but not as strong as aluminum. So, we wouldn’t make a mooring tower or a mooring Halo out of a plastic material,” said Politano. Components above water are made from aluminum because it is lightweight and extremely strong. To increase strength and resilience, above water aluminum components are powder coated that prevents water from contacting the metal. The powder coating contains various pigments, polymer resins, curatives, leveling agents, and other additives, which is applied to an aluminum surface with an electrostatic spray. “The powder coating is sprayed on, and cured in an oven that triggers a chemical reaction that hardens the coating, making a hard shell, protecting the metal beneath it,” she explained. “A good way to imagine it is like a big M&M covering the chocolate metal inside,” she added.
The OOI team uses silicon bronze (bronze coated with a silica coating) and titanium for many underwater components. The silicon bronze has mild anti-fouling properties, which is important for OOI’s coastal arrays to help reduce biofouling. The mooring components go from a bright coppery color to a green, blue patina color. The patina acts as a durable, strong, protective layer that is highly resistant to corrosion and doesn’t fatigue. “We use silicon bronze to bolt instrument clamps to MFN and NSIF frames and to attach instrument to the frames. The benefit of silicon bronze is that it is much cheaper than some of the other materials like titanium, so we can afford to use it many places,” said Politano.
Balancing Cost and Placement Considerations
Titanium is a fantastic material to use in the marine environment because it is highly corrosion resistance, very strong, and can remain in a marine environment for a long time. The downside is that it is very expensive, so it is used judiciously. Titanium also has a high strength to weight ratio, which makes it ideal for floating things in the water column and it is used to bolt together all of the critical structural mooring components. For instance, titanium bolts are used to connect surface buoys to the electromechanical chain (EM), which contains electrical components allowing power and communication with the below surface elements, to the NSIF and stretch hoses to the MFN, which anchors the mooring on the sea floor. Like stainless steel, titanium has a protective oxide layer with the ability to “heal itself.”
In addition to strength, durability, and cost the OOI team must consider the mix of materials it uses, avoiding places where two metals might touch each other. For example, copper is used as a primary anti-fouling material to mitigate the ever-present challenge of minimizing marine growth. Copper is soft so it isn’t used to attach critical mooring components. Care must be taken to avoid any dissimilar metals coming in contact with one another. The outcome of such contact would be an extreme case of galvanic corrosion!
“It really is this sort of ballet of trying to balance the cost of the material versus the strength of the material versus the weight. We put lightweight materials above the water. The expensive materials that are really strong are used to hold the whole mooring together. And then the in-between materials that are strong, but not as expensive as the really strong materials, are used to hold all the instruments together. So, it’s a fun little balancing act,” Politano concluded.
As it turns out choosing the right materials also is a good return on investment. According to OOI Lead Systems Engineer Matthew Palanza, “While the cost of these corrosion-prevention materials is high, the loss of equipment and data due to failures caused by corrosion is much greater. Incorporating corrosion-prevention materials into the array extends their service life much longer. This makes it possible for some housings, connectors, and other components to be re-used every time an array is redeployed. In fact, some housings are designed to last for the 30-year duration of the program.”
Read MoreNew Coastal Endurance Array Video
Learn about Coastal Endurance Array operations through the lens of Oregon State University videographer Kim Kenny.
[embed]https://youtu.be/5_Yb7kN0BcI?si=AYrVivjUbXwOhF5r[/embed] Read MoreNSF Grants OSU Ocean Research Consortium $220 million
The Daily Barometer reported on a recent National Science Foundation $220 million award to a consortium of ocean research institutions — Woods Hole Oceanographic Institution, Oregon State University and the University of Washington — to carry on the operation and maintenance of the NSF-funded Ocean Observatories Initiative. The funding runs through 2028. Read the article here.
Read MoreCollaborative Data Partnership Providing Fuller, More Robust Picture of Conditions in Northeast Pacific
A new data initiative involving more than 20 years of oceanographic data from Olympic Coast National Marine Sanctuary (OCNMS) promises to provide scientists and the public with a more robust picture of changing ocean conditions within the sanctuary and Northeast Pacific Ocean.
Funded by the National Oceanic and Atmospheric Administration’s (NOAA) Climate Program Office, a team from Oregon State University is working to make 23 years of sanctuary mooring data and data from CTD (Conductivity, Temperature, and Depth) casts available through publicly accessible data repositories. The three-year project will also combine the sanctuary’s data with complementary data sets in the region, including data from the Ocean ObservatorIes Initiative (OOI) Coastal Endurance Array.
“The OCNMS data are a critically important data set that has not been fully unlocked and represents a treasure chest of information that we’ve only begun to crack open,” said Jenny Waddell, research coordinator at Olympic Coast National Marine Sanctuary and a collaborator on the project. “The data will provide information about marine heat waves, changes in timing of spring transition to upwelling, seasonal hypoxia, and ocean acidification, all of which will help improve the management of marine resources in the sanctuary.”
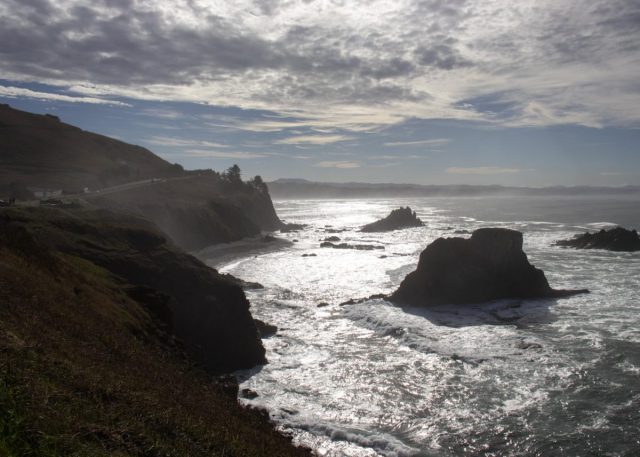
Olympic Coast National Marine Sanctuary, along Washington State’s outer coast, represents one of North America’s most productive marine ecosystems. An area of summertime upwelling of cold nutrient-rich waters, the sanctuary hosts a diverse ecosystem that is home to many commercially and culturally important fisheries.
[media-caption path="https://oceanobservatories.org/wp-content/uploads/2023/06/SP_stern_JWaddell_Aug2021.jpeg" link="#"]The stern of the R/V Storm Petrel hints at some of the enhanced capacity that this new vessel brings to research on the Olympic Coast, including a larger work area on the back deck, an upper deck for seabird and mammal surveys, a new pot hauler and knuckle boom crane, and a much more capable A-frame and winch. Credit: Jenny Waddell © NOAA.[/media-caption]Collected by 10 oceanographic moorings, the process of taking 23 years of the sanctuary’s quality-controlled data (water temperature, salinity, density, spiciness, velocity, and dissolved oxygen concentration) and meshing them with data from 700 CTD casts is a huge undertaking that will be conducted in multiple steps. The first step was the handover of all processed and raw data by the sanctuary to data experts Brandy Cervantes and Craig Risien at OSU. The data experts, who are Co-PIs on the NOAA project, are going through all the data and reprocessing where necessary to make sure that all the data are interoperable. The high-resolution CTD data are of particular interest, having never been made widely available before. These data will provide information about the water column to complement and validate the data collected by the instruments on the moorings.
OOI’s Contribution
The Coastal Endurance Array’s Washington Inshore mooring is the shallowest of the three OOI moorings off Washington State and lies just inside the sanctuary’s southern boundary. This location helps provide an in-depth look at ongoing conditions nearer the coast. While the other two Endurance Array moorings off Washington State are farther offshore and to the south, not formally within the sanctuary boundaries, they provide valuable year-round data, which are particularly helpful for context on conditions farther offshore from the sanctuary and for regional forecasting and prediction efforts of ocean conditions. Sanctuary moorings are seasonal, collecting data when they are deployed in May through the first week of October when they are recovered, except for a single overwintering mooring, so OOI data also provide important year-round context for OCNMS.
“Data from the other two Endurance Array moorings not within the sanctuary boundary are equally valuable, not just for prediction purposes, but to our tribal partners. A unique thing about the Olympic Coast National Marine Sanctuary is that nearly the entire sanctuary is within the Usual and Accustomed Fishing Areas of the four coastal treaty tribes in Washington — the Hoh Tribe, Makah Tribe, Quileute Tribe, and the Quinault Indian Nation. The sanctuary and OOI-derived data are particularly valuable to the Quinault Tribe, who use these data to estimate fish runs. They have found, for example, that our oxygen data are a good predictor of the Coho salmon run size in some of the coastal rivers,” Waddell explained.
Olympic Coast Data Applications
Sanctuary data are the foundation of the LiveOcean model, an ongoing project of the University of Washington Coastal Modeling Group that provides short-term (three-day) forecasts of ocean conditions—currents, temperature, salinity and biogeochemical fields such as harmful algal blooms. Sanctuary data also are incorporated in the J-SCOPE model, operated by the Northwest Association of Networked Ocean Observing Systems (NANOOS), for seasonal (six to nine month) forecasts of ocean conditions that are relevant to management decisions for fisheries, protected species, and ecosystem health.
Sanctuary and OOI data also serve as the basis for novel estimates of pre-industrial and near future (2030–2050) ocean acidification conditions on the Olympic Coast led by NOAA Pacific Marine Environmental Laboratory ocean carbon scientists. These estimates are made possible by rich NOAA Ocean Acidification Program-funded coastal observing efforts and inform state and tribal fisheries and water quality management (cf. Alin et al. 2023 in press).
Changing Conditions
“In the 23 years that we’ve been collecting data, we have been documenting changing ocean conditions that are quite alarming,” said Waddell. The 465-page latest Condition Report for the Sanctuary details how ocean conditions along the Olympic Coast continue to change and intensify in response to climate change. The report lays out concerns about the impacts from ocean acidification, warming ocean temperatures, increased stratification, rising sea levels, and declines in dissolved oxygen, in addition to the intermittent occurrences from more intense and frequent marine heatwaves, harmful algal blooms, and coastal storms.
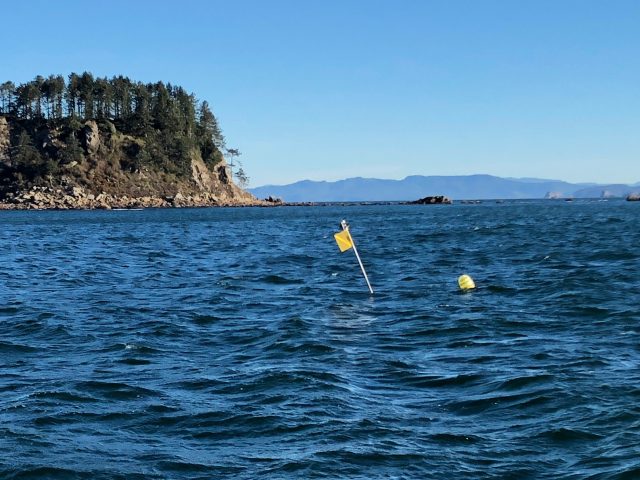
[media-caption path="https://oceanobservatories.org/wp-content/uploads/2023/06/IMG_4898.jpg" link="#"]Oceanographic moorings deployed by Olympic Coast National Marine Sanctuary, such as this mooring near Cape Alava, have been tracking changes in ocean conditions along this remote and rugged coastline for more than two decades. Credit: Jenny Waddell ©NOAA.[/media-caption]To help bring this information to the public, the sanctuary has developed a user-friendly and searchable graphic interface that provides easy access to data within the report. Called the Web Condition Report (WebCR), the interface is designed to connect people with information they are interested in.
[media-caption path="https://oceanobservatories.org/wp-content/uploads/2023/06/OCNMS_O2_plots_5panel_2018-scaled.jpg" link="#"]
This is an example of the type of information available through WebCR. Like animals on land, most marine animal species need oxygen to survive. To obtain oxygen, whales and turtles periodically breathe air at the water’s surface, while most fish species obtain oxygen that is dissolved in seawater. Low oxygen levels can harm marine animals or force them to move to areas with more hospitable conditions. Cape Elizabeth in the south (2006–2017), for example, has gotten progressively worse over time and in recent years is hypoxic 44 percent of the time. Image source: Alin et al., 2023 in prep. Also reprinted from: Office of National Marine Sanctuaries. 2022. Olympic Coast National Marine Sanctuary Condition Report: 2008–2019. U.S. Department of Commerce, National Oceanic and Atmospheric Administration, Office of National Marine Sanctuaries, Silver Spring, MD. 453 pp.[/media-caption] “These 23 years of data now being sorted will help us get a handle on what is really going on in the Pacific Northwest. It’s an important microcosm of what’s happening on a larger scale. Only around 25,000 people live along the Olympic Coast between Neah Bay and Ocean Shores, so the human footprint of this place is minimal. Most of what we’re seeing and what the data are telling us are climate forced issues coming to bear here,” added Waddell. “And having our data in the hands of senior oceanographers who know exactly what to do with it is just so incredibly valuable to understand not only what’s happening at the ocean surface, but within the full water column, which is where most of the impacts of climate change are occurring.”
The Principal Investigator (PI) for this project is College of Earth, Ocean and Atmospheric Science (CEOAS) Oregon State University (OSU) Associate Professor Melanie R. Fewings. Co-principal Investigators are Craig M. Risien, OSU Senior Faculty Research Assistant II and OOI Cyberinfrastructure Project Manager; Co-Principal Investigator Brandy T. Cervantes, OSU Senior Research Associate.
In addition to the PIs and NOAA’s Waddell, other collaborators include Dr. Simone Alin, NOAA Pacific Marine Environmental Laboratory, Katie Wrubel, Resource Protection Specialist, OCNMS, Joe Schumacker, Marine Resources Scientist, Quinault Indian Nation, Dept. of Fisheries, Tommy Moore, Oceanographer, Northwest Indian Fisheries Commission, Charles Seaton, Senior Oceanographer, Columbia River Inter-Tribal Fish Commission, Kym Jacobson, Research Zoologist, NOAA Northwest Fisheries Science Center, Jennifer Fisher, NOAA Cooperative Institute for Marine Ecosystem and Resources Studies, OSU, and Maria Kavanaugh, Assistant Professor, CEOAS, OSU, and Principal Investigator of the Marine Biodiversity Network.
Read More
Slope and Shelf Flow Anomalies Off Oregon
Slope and Shelf Flow Anomalies Off Oregon Influenced by the El Niño Remote Oceanic Mechanism in 2014–2016
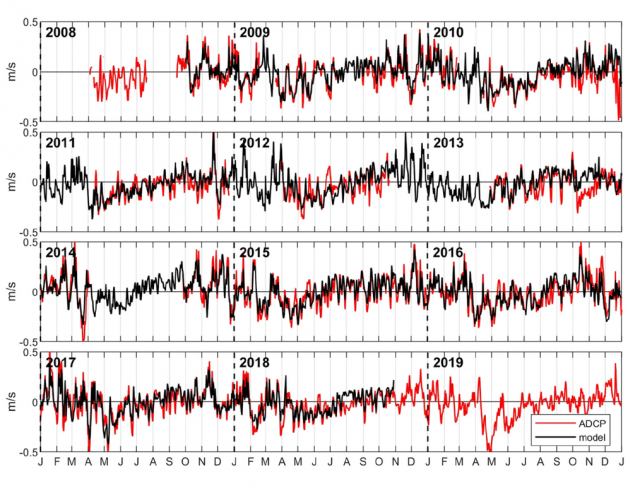
Adapted and condensed by OOI from Kurapov et al., 2022, doi.org/10.1029/2022JC018604.
[media-caption path="/wp-content/uploads/2023/01/Endurance-science-highlight-fixed.png" link="#"]Time series of the daily averaged meridional current component at the Oregon shelf location, averaged in the vertical between 60 and 70 m below the surface: (red) ADCP data and (black) model. Data from before 2015 come from various moorings maintained at the NH-10 site. Data after 2015 come from the OOI Oregon shelf site. The model reproduces the observed variability over the entire 10-year period very well, except for episodes in Dec 2010 and Oct 2013. Overall, no systematic biases or trends are found. See Fig. 7 Kurapov et al. (2022).[/media-caption]Kurapov et al. analyze outputs of a regional ocean circulation model to demonstrate the measurable impact of the El Niño remote oceanic forcing mechanism along the US West Coast during the major heat wave period of 2014–2016. The 2-km horizontal resolution model, based on the Regional Ocean Modeling System (ROMS), was run for the period of 2009–2018. Though the model does not assimilate observations, it performs well by comparison with time series data (including OOI data, Figure above) explaining observed variability on temporal scales from several days to seasonal and interannual.
The El Niño-related oceanic anomalies provided by a global state estimate are introduced in the regional model at the southern boundary at 24N. These propagate alongshore with coastally trapped waves (CTWs) and influence the variability off Oregon (41°–46°N). In particular, CTWs are evident in the subsurface along-slope current, vs, and in the depth of the 26.5 kg m3 isopycnal surface over the slope, z26.5. In summer 2014 and 2015, vs anomalies are positive (northward) and z26.5 anomalies are negative (deeper) along the US West Coast. In addition to the CTW patterns, z26.5 anomalies also exhibit slow-moving features associated with undercurrent widening, separation, and subsurface eddy variability. Over the Oregon shelf, El Niño conditions contributed to the sharp weakening of the southward alongshore current throughout the water column in July 2014 and 2015, despite the near-average southward, upwelling-favorable winds.
Kurapov, A. L., Rudnick, D. L., Cervantes, B. T., & Risien, C. M. (2022). Slope and shelf flow anomalies off Oregon influenced by the El Niño remote oceanic mechanism in 2014–2016. J. Geophys. Res.: Oceans, 127, e2022JC018604. doi.org/10.1029/2022JC018604.
Read MoreAlex Wick: Conducting Sea-going Operations
OOI Coastal Endurance Array Deck Lead Alex Wick has been working on ships for more than a decade. He is a classic example of learning the ropes from the bottom up. After receiving a degree in marine biology from the University of Santa Cruz, he took some scuba diving lessons, but really didn’t know what he wanted to do.
Wick started his journey aboard ships in 2012 sorting tools for a marine technician onboard the R/V Point Sur, out of Moss Landing, California. When offered the job, he had no idea what he was getting into. He showed up in shorts, street shoes, with no personal protective gear (PPE) at all, and no at-sea experience.
But he learned quickly and advanced from sorting sockets to needle-gunning the deck, which involves removing all of the old paint with a needle gun before applying a new coat of paint. This activity was when Wick was given his first set of PPE – safety glasses, knee pads, hard hat, and gloves – which gave him a real understanding of their importance during five days of back-breaking work.
[media-caption path="/wp-content/uploads/2023/01/Alex.jpeg" link="#"]Alex Wick has been deck lead for Endurance Operations since 2018. Credit: Darlene Trew Crist ©WHOI.[/media-caption]
Wick started repainting the deck of the boat. The captain, at the time, recognized Wick’s work ethic and dedication and continued to expose him to shipboard duties. From one cruise as a deck hand, he advanced to an 84-day expedition to Antarctica. He jokes that at the time he didn’t even know how to use a ratchet strap, which is widely used to secure heavy equipment on ships and elsewhere.
“The captain told me to secure a small boat under the A-frame,” said Wick. “I had no idea how to do, but figured it out. With one day of oceanographic experience under my belt, I was off to Antarctica.” As it turned out, it was the best possible hands-on learning experience for Wick, which ultimately led to him spending about 500 days at sea and his role with the Endurance Array team today.
“There was nothing like driving a boat in Antarctica with a guy with a crossbow on the bow of the boat directing me around chasing Minke whales,” added Wick. “We would come up alongside one of them, shoot a crossbow bolt into its dorsal fin to retrieve a bio-sample. I thought it was the coolest thing ever.”
This Antarctica expedition provided Wick with the foundational knowledge he now uses aboard the R/V Thomas G. Thompson during bi-annual recovery and deployment expeditions for the Coastal Endurance Array. His time on the Point Sur taught him how to run winches, use the A and J frames, which support the lifting of heavy equipment in and out of the ocean, and most importantly, how to work on a ship in a safe manner.
After Antarctica, Wick spent six years as a deck hand and marine technician, where he developed an innate understanding of how all the pieces move on deck. Jonathan Fram, who often serves as chief scientist for the Endurance expeditions likens Wick to a symphony conductor. “He directs the operations while always having an eye on each member of the ‘orchestra’ and what they should be doing at certain times. This orchestration is critical to getting the heavy equipment we deal with on and off board without incident.”
Wick moved to Oregon State University when his wife was accepted into a PhD program there. He was hired on as a marine technician on the R/V Oceanus, where he sailed for up to 100 days a year. But, a man of many interests, Wick grew tired of being away from home for such long stretches. He missed his family, mountain bike, fishing, and other activities afforded by living in Oregon. He applied for the job as deck lead with the Endurance Array team and has been on the job since December 2018.
His first trip to the dock in Newport after a fall Endurance expedition, where he saw the massive amount of equipment moved on and off the ship and in and out of the water, provided Wick with his leadership philosophy.
“I think that the person running the deck should be basically completely hands off. That way, we are able to actually observe everything and see the bigger picture of what’s happening,” said Wick. “As we’re doing recoveries or deployments, I’m always thinking of the next pieces of the puzzle. I want the folks on the back deck and on the bridge to know what to expect, so everyone knows what’s ahead and can plan for what they’re going to be doing.”
From the seeds of his earliest experience aboard the R/V Point Sur, Wick is totally committed to overseeing a safe operation. “The deck lead is responsible for everyone’s safety and making sure we’re doing things appropriately,” he explained. “Sure unexpected things can happen, but back deck operations can and should be done safely. I feel a great responsibility for making sure that everybody comes back with all their digits and we all return to shore having successfully completed the job and return to our family and friends.”
Wick’s favorite part of the job is working with the team. He joked, “We are all part of the communal suffering. Doing the same thing together. We have a lot of big toys that we get to play with safely. And, it really is special at sea. It’s cool to see the whales breaching, the dolphins racing the ship, the bioluminescence, and skies filled with stars. No matter how crusty and jaded we might be, it takes a team to put these moorings in the water, and deep down, I think we all really enjoy doing this.”
Wick has served as deck lead for six Endurance expeditions and has overseen the movement, deployment and recovery of 270 tons of scientific equipment. Not a bad record for a kid who started out sorting tools.
[media-caption path="/wp-content/uploads/2023/01/Alex-2.jpeg" link="#"]Wick choreographs the recovery and deployment of the Endurance Array moorings. Credit: Darlene Trew Crist ©WHOI. [/media-caption]
Read More
Improving Reliability and Availability of Dissolved Oxygen Glider Data
OOI’s Coastal Endurance Array Team is making great strides in ensuring the accuracy of glider dissolved oxygen measurements and making these data readily available to researchers. The team has compared glider oxygen data with independent transects and climatologies compiled by west coast colleagues. They are increasing the number of in situ comparisons of glider oxygen data with bottle samples taken in proximity to the gliders. They have built a benchtop system to do two-point calibrations for oxygen sensors to help ensure their accuracy when the gliders are in the water. And, working with OOI colleagues at WHOI, the team is helping to design and test improved sensor mounts to perform in situ air calibrations of glider oxygen measurements.
“A couple of years ago, Endurance Glider Lead Stuart Pearce developed code to put all of the oxygen data collected by our glider fleet into the DAC, the national central database for glider data,” said Ed Dever, Principal Investigator of the Coastal Endurance Array and Professor at Oregon State University. “Prior to doing this, Stuart examined the data and metadata for any gross errors and issues. That was the first of many steps we have taken to ensure OOI oxygen data are reliable and available so they can be trusted and used by researchers. Our effort is paying off. The glider data available on the DAC are identical to that now available on OOI’s Data Explorer. Endurance glider lines off Newport, OR and Grays Harbor, WA will be the backbone for the northern Californian Current part of the nascent Boundary Ocean Observing Network. The OOI glider lines map seasonal development of hypoxic areas off Oregon and Washington from the coast to the edge of the continental shelf.”
[media-caption path="/wp-content/uploads/2022/11/glider.png" link="#"]More than 137 glider missions have occurred along the Newport and Grays Harbor lines since 2014. Credit: Coastal Endurance Array at OSU.[/media-caption]
Collaborations
Enough oxygen data has been collected and shared in the northeast Pacific that is now possible to make high resolution regional climatologies of temperature, salinity and oxygen. Risien et al. (2022) compiled ~20 years of data taken by Jennifer Fisher (NOAA) and many others, to develop analysis ready transects of water property data off Newport, Oregon. These datasets include both climatologies and individual interpolated, quality-controlled, transect data. The Endurance Team compared glider dissolved oxygen with shipboard CTD samples collected by Fisher along the Newport transect in July 2021. Oxygen measurements from the gliders and CTDs samples compared well and provided confidence that glider and shipboard transects can map hypoxic conditions at comparable resolution and accuracy. Added Dever, “We were able to do a side-by-side comparison of the temperature, salinity, and oxygen data collected by the gliders over our Newport hydrographic line with the CTD data sampled by the Fisher’s team using the R/V Elakha. The comparison was quite good and served to validate the quality of the glider data that are an integral part of the Endurance Array.”
Engineering Solutions
A couple years ago, team member Jonathan Whitefield worked with Scripps Institution for Oceanography to build an oxygen Winkler titration rig so the team can titrate its own oxygen samples. The system can be used both in the lab and onboard to validate glider and moored oxygen data. The titration rig has been used to increase the number bottle samples taken during glider deployments and recoveries and to reduce the time between sample acquisition and analysis.
Building on this, Whitefield and others recently assembled in-house two-point calibration baths for pre- and post deployment of oxygen data collected by gliders and moorings. Calibrations are performed at anoxic and near-saturated conditions. The two-point calibration system is based on a similar one used at Scripps Institution for Oceanography (López-García, P., et al., 2022). A sodium sulfite solution is injected into bottle samples to get the low endpoint oxygen calibration point. The high endpoint oxygen calibration point is achieved using a stirred bath at 10°C to get to near saturation. The high endpoint oxygen is measured with replicate Winkler titrations. The calibration baths better ensure accuracy by making it possible to perform routine in-house checks of vendor calibrations on glider and moored sensors as well as identify calibration drift after deployment.
What’s ahead
Oxygen data are reviewed weekly by operators and annotated. Real-time automated quality control using QARTOD tests is in development. In-situ air calibration tests of oxygen optodes are planned for spring 2023. At the suggestion of outside investigators, OOI’s Coastal and Global Scale Node team at Woods Hole Oceanographic Institution modified Slocum glider optode mounts to allow in-situ air calibrations of dissolved oxygen on the Irminger Sea and Pioneer Arrays. The mount, however, affected the flow around gliders with radome fins and caused navigation problems. Modeling done at WHOI showed these problems may be due to vortices of the optode on the starboard side of the fin. The Endurance gliders will test a new mount placement during its upcoming bi-annual operations and maintenance cruise in March of 2023.
“We’re part of the community of practice for glider oxygen calibration and validation,” said Dever. “We engage with colleagues, adopt standard practices and widely share data. This community of users will help all of us get a better handle on ongoing changes in our ocean regions.”
References
Risien et al. (2022) Spatially gridded cross-shelf hydrographic sections and monthly climatologies from shipboard survey data collected along the Newport Hydrographic Line, 1997–2021, https://doi.org/10.1016/j.dib.2022.107922
López-García, et al. (2022) Ocean Gliders Oxygen SOP, Version 1.0.0. Ocean Gliders, 55pp. DOI: http://dx.doi.org/10.25607/OBP-1756. (GitHub Repository, Ocean Gliders Oxygen SOP.
Read More
Particle Trajectories in an Eastern Boundary Current
Adapted and condensed by OOI from Wong-Ala et al., 2022, doi:/10.1016/j.jmarsys.2022.103757
To study the transport and dispersal of marine organisms during spawning, Wong-Ala* et al. developed and applied a Lagrangian particle tracking (LPT) model to compare and contrast particle drift patterns during the spring transition off the Oregon coast. They studied the Oregon coast as it has distinct upwelling and downwelling regimes and variable shelf width. They contrasted years (2016–18) using Regional Ocean Modeling System (ROMS) with different horizontal spatial resolutions (2 km, 250 m). They found the finer spatial resolution model significantly increased retention along the Oregon coast. Particles in the 250 m ROMS were advected to depth at specific times and locations for each simulated year, coinciding with the location and timing of a strong and shallow alongshore undercurrent that is not present in the 2 km ROMS. Additionally, ageostrophic dynamics close to shore, in the bottom boundary layer, and around headlands not present in the coarser model emerged in the 250 m resolution model. They concluded that the higher horizontal model resolution and bathymetry generated well-resolved mesoscale and submesoscale features (e.g., surface, subsurface, and nearshore jet) that vary annually. These results have implications for modeling the dispersal, growth, and development of coastal organisms with dispersing early life stages.
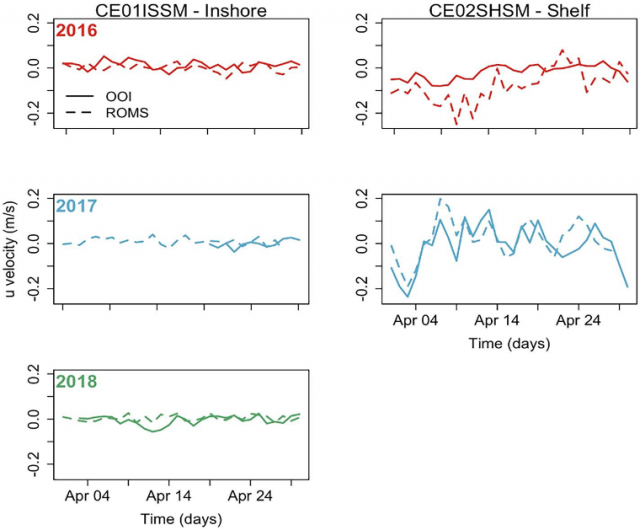
[media-caption path="/wp-content/uploads/2022/11/Endurance-Highlight.png" link="#"]Figure 1: (Fig 9 from Wong-Ala et al. (2022). Comparison of u-velocity (zonal velocity) data between the 250 m ROMS and an inshore mooring and shelf mooring off the Oregon coast collecting data at seven meters depth. The panel is organized by year: 2016 (row 1), 2017 (row 2), 2018 (row 3), and location of data collection: inshore (column 1) and shelf (column 2). In April 2018, there are no data available from the shelf mooring ADCP.[/media-caption]The model applied by Wong-Ala assimilates satellite sea surface temperature and along-track altimetry. Model atmospheric forcing is from the NOAA North American Mesoscale Model (NAM). To validate their model, Wong-Ala et al., used OOI Endurance Array time series data from 2016 to 2018 from the Oregon inshore and shelf moorings (CE01ISSM and CE02SHSM). They compared available OOI zonal and meridional velocities, temperature, and salinity to model output of these parameters for the month of April in each year when they ran their model (Figure 1). They found the modeled currents and temperature from the 250 m ROMS model closely follow the observed data from inshore and shelf moorings compared to the 2 km ROMS. The 250 m ROMS modeled currents and observed currents at the inshore mooring are similar for all three years (Figure 1).
They also found that the 250 m ROMS modeled temperature and observed data are similar in 2017 at the inshore and shelf location. In April 2017 and 2018, the modeled temperature from the 250 m ROMS is about 1 °C cooler than the observed temperatures.
_____________________
*Wong-Ala is a PhD student at Oregon State University. She is a Pacific Islander.
Reference:A. T. K. Wong-Ala, Ciannelli, L., Durski, S. M., and Spitz, Y., Particle trajectories in an eastern boundary current using a regional ocean model at two horizontal resolutions, Journal of Marine Systems, vol. 233, p. 103757, 2022. https://doi.org/10.1016/j.jmarsys.2022.103757.
Read More