
Posts by Amber Coogan
Empowering Ocean Research: The Evolution of the OOI Data Center at Oregon State University

Written by Craig Risien, OOI Data Center Program Manager, and reviewed by Jack Barth, DC Principal Investigator
Oregon State University (OSU) in collaboration with Dell Technologies, has led the development and operation of the Ocean Observatories Initiative (OOI) Data Center since 2021. This facility serves as the backbone of OOI, supporting the collection, management and distribution of scientific data from across the OOI network.
Working closely with Dell Technologies, OSU built and configured the OOI 2.0 Data Center – a secure, scalable, and modern computing environment that become the official system of record on July 30, 2021. The transition from Rutgers University was completed without any downtime or disruption to services. Since then, the OSU team has maintained continuous operations with zero unplanned outages.
In 2025, OSU and Dell Technologies completed a major upgrade, launching the OOI 2.5 Data Center. This refresh doubled the data storage capacity, increased the network speeds by a factor of four, and greatly expanded the compute capacity, ensuring that OOI can continue to meet the growing demands of ocean data processing and delivery. The upgrade also significantly enhanced OOI’s cybersecurity by partnering with the National Science Foundation (NSF) funded Texas Advanced Computing Center (TACC), which provides a geographically remote, immutable backup of all OOI scientific data. The transition from OOI 2.0 to 2.5 was completely in Spring 2024.
Today, the OOI Data Center manages approximately 3.3 petabytes (PB) of data and distributes over 200 terabytes (TB) of data each year in response to more than 50 million data requests.
To simplify user access, the Data Center adopted CILogon, an NSF and Department of Energy (DOE) supported identity management system. This allows users to securely log in with credentials from their home institutions or identity providers such as ORCID, removing the need for multiple accounts.
OOI’s cybersecurity program continues to grow under the guidance of Trusted CI, the NSF Cybersecurity Center of Excellence. In 2022, the Data Center joined the first Trusted CI framework assessment cohort. In 2023, it became a member of the Trusted CI Research Infrastructure Security Community (RISC). In 2024, the team completed a framework reassessment alongside three other NSF Major Facilities, reaffirming its leadership position in cybersecurity.
The Data Center also offers a JupyterHub environment that givers researchers and students direct access to OOI data with no downloads required. This free resource supports Python, R, and MATLAB and includes NVIDIA GPUs for AI and machine learning work. JupyterHub has supported multiple community activities, including the 2023 Bio-optics Sensors and 2025 Acoustics OOIFB Summer Schools, the 2025 Imaging FlowCytobot (IFCB) Workshop, and numerous undergraduate courses, helping researchers and educators explore OOI data more efficiently.
[caption id="attachment_37174" align="alignnone" width="2560"]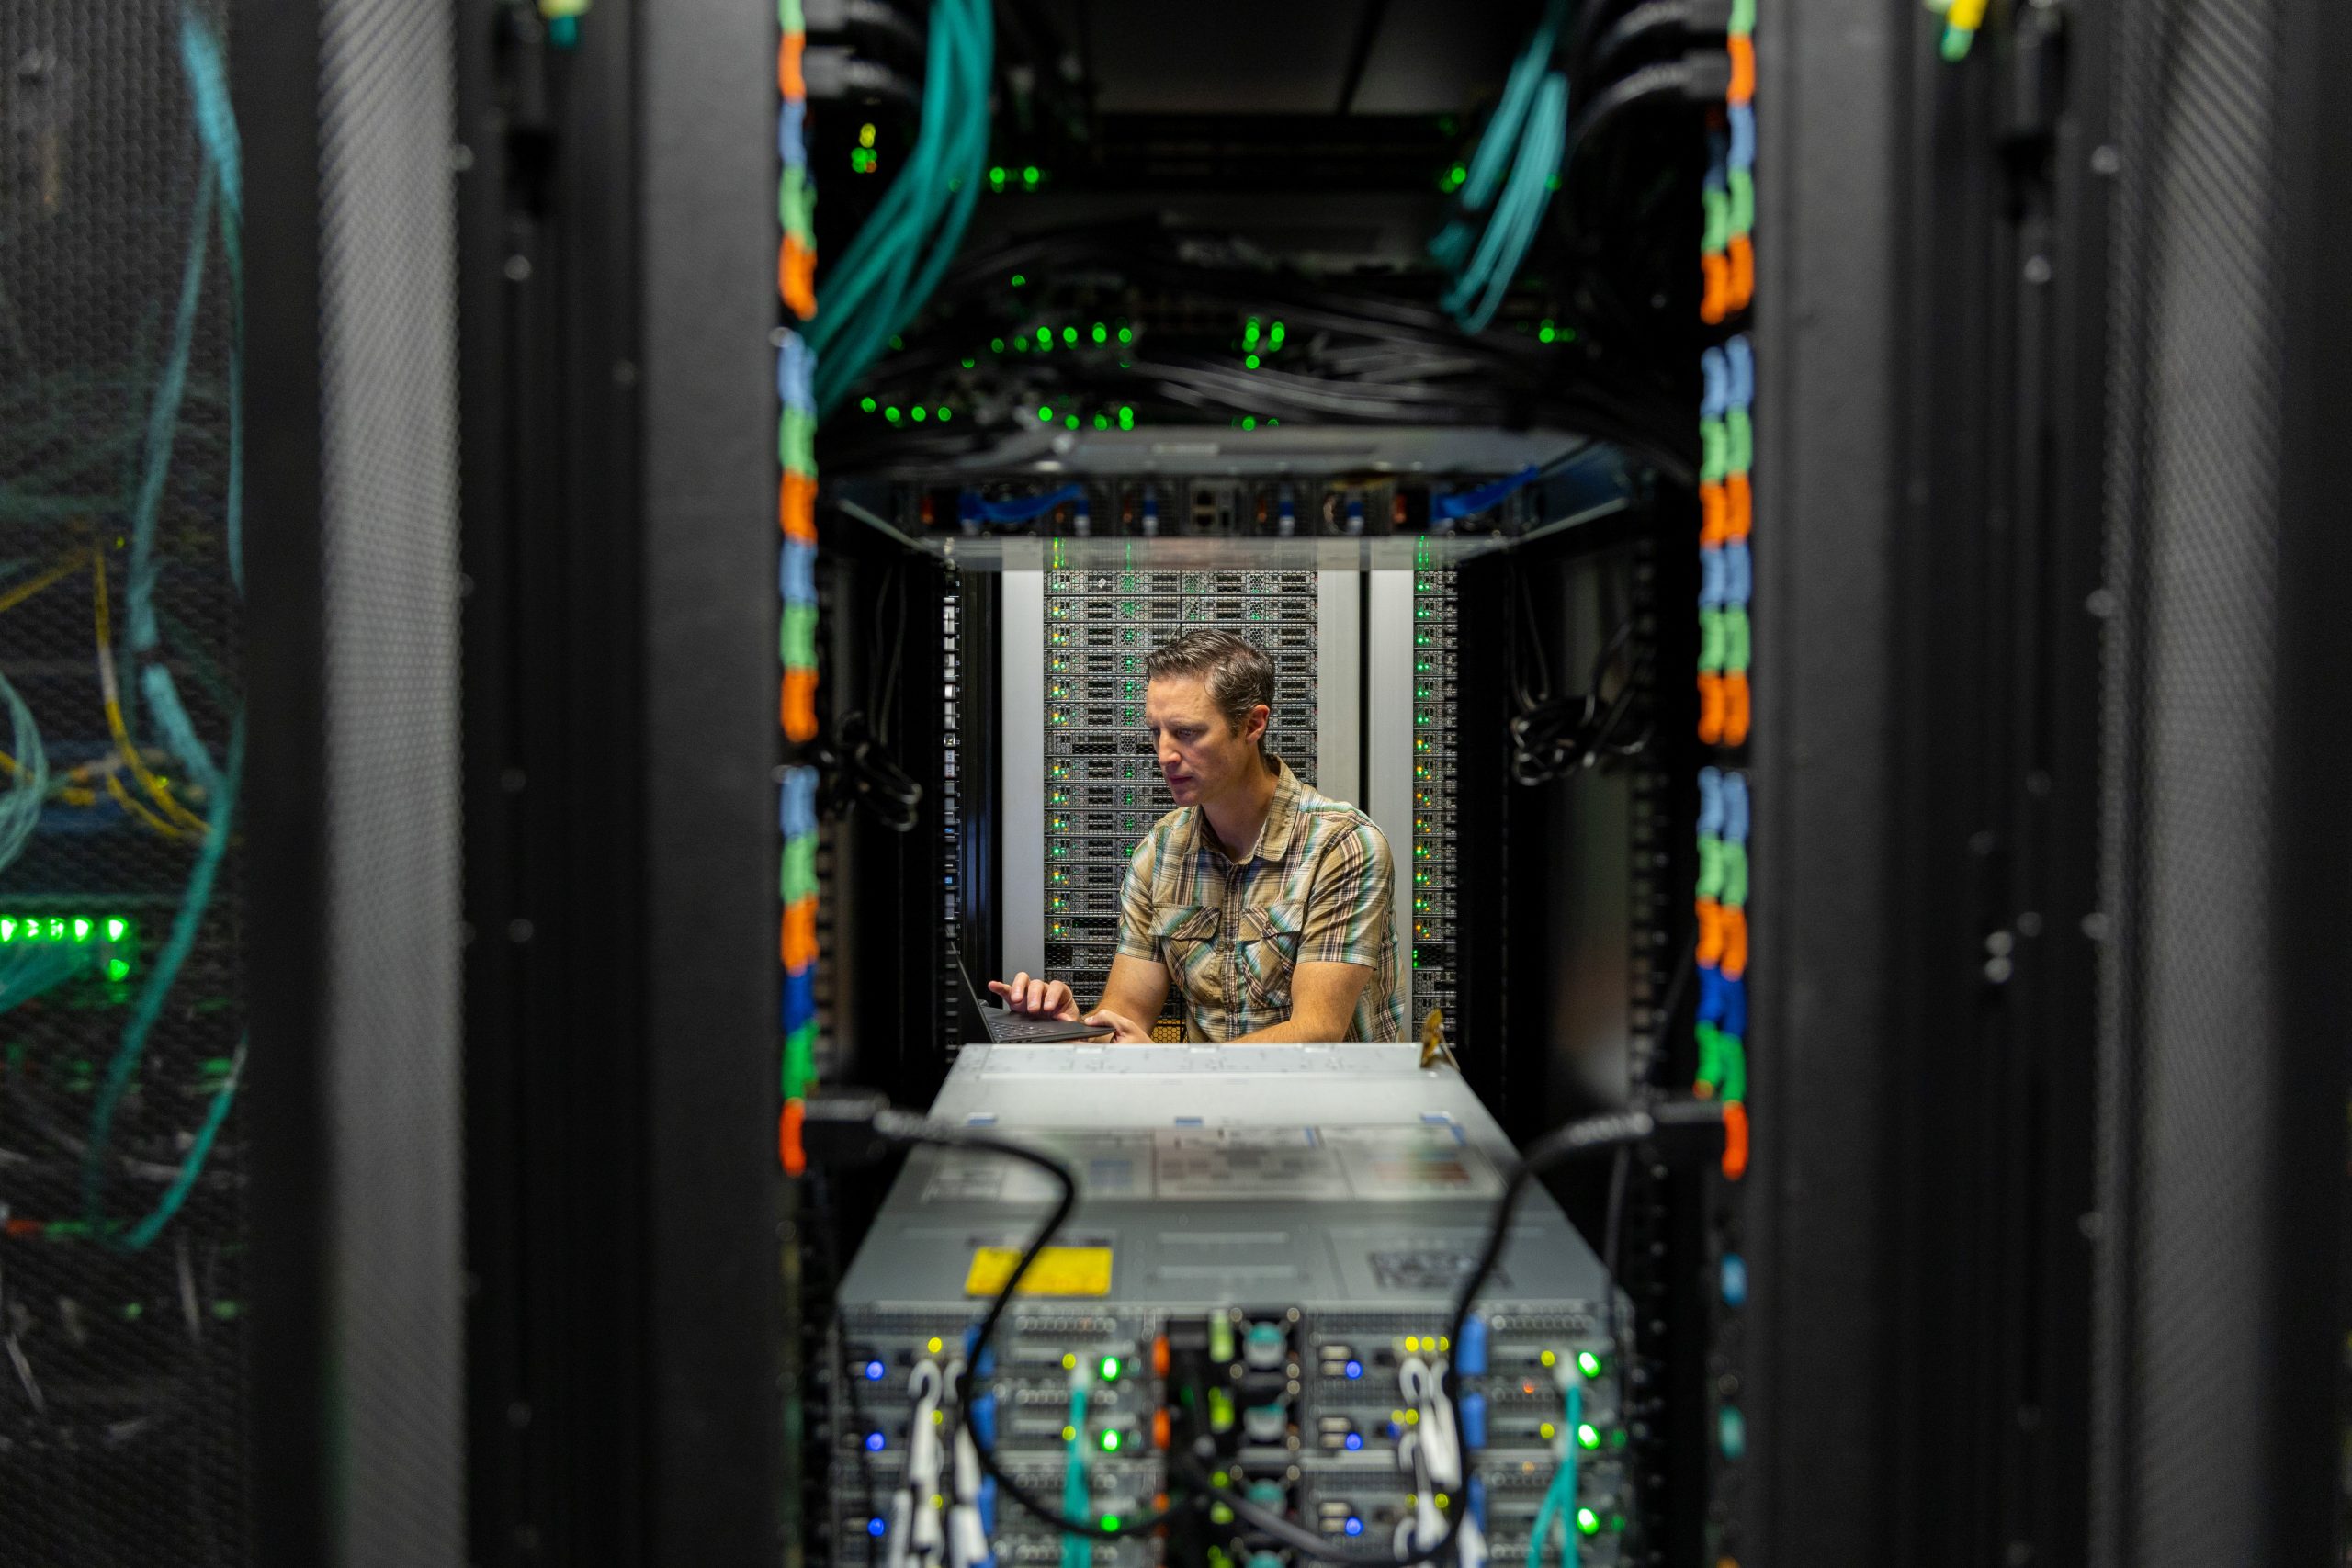 Credit: Oregon State University (OSU)[/caption]
Read More
Credit: Oregon State University (OSU)[/caption]
Read More UW researcher launches new technology for underwater acoustics
Earlier this month, a UW researcher deployed fiber optic cables — which are cables used to rapidly transmit audio and video data — into the Puget Sound, opening the floor for innovative research into marine mammals.
The fiber optic cable system was developed in the UW Ocean Data Lab, run by professor Shima Abadi. Abadi’s research focuses on passive underwater acoustics in oceanography, or listening for noises in the ocean.
A hydrophone, or underwater microphone, is typically used to record acoustics. The Ocean Observatories Initiative, a project funded by the National Science Foundation, has recorded underwater data for 10 years to observe long term trends in ocean ambient noise in Oregon and Washington. Read more from THEDAILY.
Read MoreThe 2019 marine heatwave at Ocean Station Papa
(Adapted from Kohlman et al., 2024)
Marine Heat Waves (MHW; Hobday et al., 2016) are prolonged periods of extreme ocean sea surface temperature (SST) anomalies. MHWs are typically identified in satellite SST and/or ocean color records; subsurface data and interdisciplinary variables are often lacking. Ocean Station Papa (OSP) provided long-term, interdisciplinary, subsurface data to examine the physical and biochemical characteristics of a MHW in the Northeast Pacific.
MHWs may have multi-faceted causes, as well as impacts on primary production and higher trophic levels. A recent paper by Kohlman et al. (2024) examines the 2019 NE Pacific MHW using gridded satellite SST data and in-situ observations from multiple OSP platforms including the NOAA Pacific Marine Environmental Lab (PMEL) surface mooring, two OOI Flanking Moorings, the Applied Physics Lab (U. Washington) waverider mooring and shipboard samples from OOI and the Department of Fisheries and Oceans, Canada.
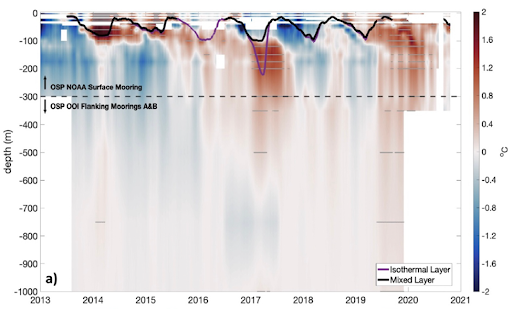
The 2019 MHW was identified in satellite SST data, but the Kohlman et al. study also assessed vertical stratification and the subsurface extent of the temperature signal. The PMEL surface mooring provided temperature and salinity (T/S) down to 300 m. The OOI Flanking Moorings extended the T/S data to 1500 m. The resulting composite time series from 2013-2020 is shown in Fig. 1. Both the extended 2013-2015 MHW and the 2019 MHW are identifiable. Subsurface temperature anomalies during 2013-2014 were strongest above the mixed layer depth (MLD). In the winter and spring of 2017, deeper waters (120–300 m) remained anomalously warm. This anomaly persisted into 2018 due to strong stratification from a fresher surface layer. During the 2019 MHW, anomalously warm waters extended down to 1000 m, whereas the 2013-2015 MHW extended only to about 150 m.
The authors used interdisciplinary data available from Station Papa platforms to assess the drivers and impacts of the 2019 MHW. They found that weaker winds and smaller significant wave height prior to the summer of 2019 created favorable pre-conditioning in the form of an unusually shallow winter MLD. During the MHW, they found that dissolved inorganic carbon and pCO2 decreased, while pH increased. Shipboard samples indicated a decrease in nutrients and an increase in primary productivity. Finally, they speculated that the increased productivity may have had an impact on higher trophic levels – more blue whale calls were recorded in 2019 at Station Papa than normal for Aug-Sep.
This project shows that the characteristics of MHWs are complex. Sustained, multi-disciplinary, subsurface observations are needed to unravel the drivers, pre-conditioning, characteristics, and impacts of these events. Station Papa, among the longest sustained ocean time series sites, is uniquely suited due to the task due to the collaborative observing effort at the site.
[caption id="attachment_37120" align="alignnone" width="512"] Figure 1. Subsurface temperature anomalies at Staton Papa during 2013-2020. Data from the surface to 300 m are from the PMEL surface mooring. Data below 300 m are from the OOI Flanking Moorings. Anomalies are relative to the 1999-2020 Argo climatology. The density-based mixed layer depth (black) and isothermal depth (purple) are overlaid. From Kohlman et al., 2024.[/caption]
___________________
References:
Hobday, A.J., Alexander, L.V., Perkins, S.E., Smale, D.A., Straub, S.C., Oliver, E.C.J., et al. (2016). A hierarchical approach to defining marine heatwaves. Prog. Oceanog., 141(0079–6611), 227–238. https://doi.org/10.1016/j.pocean.2015.12.014.
Kohlman, C., Cronin, M.F., Dziak, R., Mellinger, D.K., Sutton, A., Galbraith, M., et al. (2024). The 2019 marine heatwave at Ocean Station Papa: A multi‐disciplinary assessment of ocean conditions and impacts on marine ecosystems. J. Geophys. Res., 129, e2023JC020167. https://doi.org/10.1029/2023JC020167.
Read MoreSubmarine canyon sediment transport and accumulation during sea level highstand: Interactive seasonal regimes in the head of Astoria Canyon, WA
Lahr et al. (2025) use in-situ hydrodynamic data from a benthic tripod deployment in the head of Astoria Canyon to show that sediment resuspension and transport during summer is driven by internal tides and plume-associated nonlinear internal waves. Observations of shoreward-directed currents and low shear stresses (<0.14 Pa) along with sediment trap data suggest that seasonal loading of the canyon head occurs during summer. Nearby long-term wave data from the OOI Washington Shelf mooring shows that winter storm significant wave height often exceeds 10 m, driving shear stress capable of resuspending all grain sizes present within the canyon head. Swell events are generally concurrent with downwelling flows, providing a mechanism for episodic downcanyon sediment flux. This study indicates that canyon heads can continue to function as sites of sediment winnowing and bottom boundary layer export even with a detached, shelf-depth canyon head.
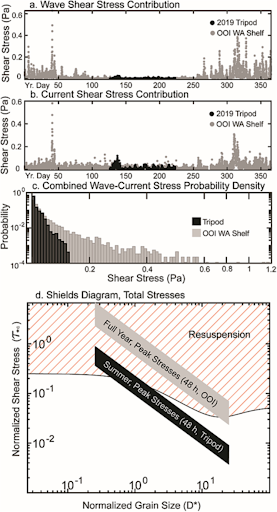
As part of this study, Lahr et al. (2025), used data from the OOI Washington Shelf Surface Mooring located 81 km north of the tripod site in Astoria Canyon. The 2019 benthic tripod deployment by Ogston was done as an ancillary activity on the Endurance 11B cruise aboard R/V Oceanus. The data used were concurrent spectral surface wave and meteorological data near bed current velocity for 2016 (chosen for its complete records). Figure xx shows the benthic tripod stress overlaid with the OOI Washington shelf mooring stress. Over the summer, the benthic tripod stress and OOI estimated stress compare well. Winter stresses (available from OOI mooring only) are much larger than those observed in summer.
[caption id="attachment_37116" align="alignnone" width="277"] Figure 1. Shear stress computed from the Astoria Canyon tripod deployment (black) and the OOI Shelf mooring (gray). Panels a) and b) depict relative stress contributions from waves and currents respectively, c) the distribution of total stresses, and d) maximum shear stresses from summer and winter on a Shields diagram. (Figure 3, Lahr et al., 2025)[/caption]
___________________
Reference:
Lahr, E.J., A.S. Ogston, J.C. Hill, H.E. Glover, and K.J. Rosenberger (2025). Submarine canyon sediment transport and accumulation during sea level highstand: Interactive seasonal regimes in the head of Astoria Canyon, WA. Marine Geology, no. (2025): 107516. https://www.sciencedirect.com/science/article/pii/S0025322725000416.
Read MoreRCA Broadband Provides First Report of Tremor-Like Signals Offshore Cascadia
The recent publication “Possible Shallow Tectonic Tremor Signals Near the Deformation Front in Central Cascadia” (Krauss et al., 2025) presents the first report of tectonic tremor-like signals offshore Cascadia. As described by the authors, deep slow-slip events in Cascadia—lasting from hours to weeks—have been documented by land-based stations for decades. These events can accommodate a significant portion of overall plate motion and may serve as precursors to megathrust earthquakes. Over the past two decades, significant tectonic tremor activity (1–10 Hz) has been observed as a feature of slow slip every 10.5–15.5 months beneath Vancouver Island to northern Oregon (Bombardier et al. 2024), with annual slip events equivalent to a magnitude ~6.5 earthquake. These typically occur well inland, at depths of approximately 30–40 km. Contrastingly, it is unknown whether slow-slip events and accompanying tectonic tremor occur at shallow subduction depths in the offshore region.
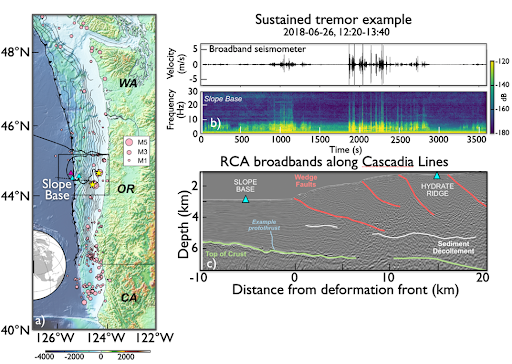
Krauss et al. (2025) analyzed data collected 2015-2024 from buried ocean-bottom seismometers (OBS) at two sites: Slope Base (2,920 m depth), located 5 km seaward of the deformation front, and Southern Hydrate Ridge (790 m depth), approximately 20 km landward. The analysis incorporated in-situ bottom current data. After applying short- and long-term averaging techniques, the study identified 85,000 signals at Slope Base and 30,055 at Southern Hydrate Ridge, encompassing T-phase events, ship noise, and tectonic tremor-like signals. Notably, tectonic tremor-like signals were observed exclusively at Slope Base.
These signals cannot be attributed to ship traffic or environmental noise. Instead, they are hypothesized to originate from slow slip on one of many nearby tectonic structures: the décollement fault, faults near the subduction zone front and outermost accretionary wedge, faults on the incoming Juan de Fuca Plate, or nearby strike-slip structures such as the Alvin Canyon Fault. However, without additional observations of these signals on multiple stations, it is unclear whether they are tectonic or represent another signal altogether.
Future deployments, such as those planned through the Cascadia Offshore Subduction Zone Observatory (COSZO) will improve our ability to pinpoint the sources of these offshore tremors. The full dataset and results are available on GitHub (https://github.com/zoekrauss/obs_tremor) and archived on Zenodo (https://zenodo.org/records/14532861).
[caption id="attachment_37111" align="alignnone" width="512"] Figure 1. a) Location of the Regional Cabled Array cabled broadband seismometers (OBS’s -cyan triangles) offshore Newport Oregon and an autonomous instrument (purple triangle), earthquakes (pink circles) and along and just offshore the Cascadia Margin. b) sustained tremor-like signals from the broadband at Slope Base. c) Subsurface structure across strike of the margin showing location of Slope Base and Southern Hydrate Ridge OBS’s, accretionary margin faults and demarcation of a boundary interpreted to be a protothrust between the sedimentary column and the incoming Juan de Fuca Plate crust.[/caption]
___________________
References:
Krauss, Z., Wilcock, W.D.S., and Creager, K.C. (2025) Possible shallow tectonic tremor signals near the deformation front in Central Caldera. Seismica, https://seismica.library.mcgill.ca/article/view/1540.
Bombardier, M., Cassidy, J.F., Dosso, S.E., and K. Honn (2024) Spatial distribution of tremor episodes from long-term monitoring in the northern Cascadia Subduction Zone. Journal of Geophysical Research, https://doi.org/10.1029/2024JB029159.
Read MoreOOI Contributions Featured at 2025 Slocum Glider User’s Conference & Sentinel Launch

The global oceanographic community gathered in Woods Hole October 7–9 for the 2025 Slocum Glider User’s Conference. The meeting convened users, scientists, engineers, and mission planners to advance next-generation autonomous ocean observing.
For OOI, the event provided a timely forum to share nearly a decade of experience integrating Slocum gliders into sustained, basin-scale observing. OOI has deployed Slocums to collect high-resolution profiles of temperature, salinity, oxygen, chlorophyll, nitrate, optical properties, and currents across energetic and climatically sensitive regions. These long records (gathered in all seasons and weather) have supported research on boundary currents, carbon cycling, marine heatwaves, ecosystem change, and storm-ocean interaction.
The OOI Team presented two posters at the conference, one documenting eight years of glider operations at the OOI Pioneer New England Shelf Array and the other describing the operational approach and initial outcomes from the Pioneer Mid-Atlantic Bight Array, which was started in April 2004. Diana Wickman presented a talk on “Tips, Tricks and Best Practices” for long-duration glider missions, an area where OOI has unique expertise.
The conference week concluded with the October 10 launch of the Sentinel Mission, the first attempt to autonomously circumnavigate the globe by AUV, using REDWING, a Slocum Sentinel Glider.
[caption id="attachment_37105" align="alignnone" width="2560"] Diana Wickman (WHOI) gives a tour of the Glider Lab at LOSOS. © Andy Robinson / WHOI[/caption]
[caption id="attachment_37106" align="alignnone" width="2560"] Tour of the Glider Lab at LOSOS. © Andy Robinson / WHOI[/caption]
[caption id="attachment_37101" align="alignnone" width="1920"]
Diana Wickman (WHOI) gives a tour of the Glider Lab at LOSOS. © Andy Robinson / WHOI[/caption]
[caption id="attachment_37106" align="alignnone" width="2560"] Tour of the Glider Lab at LOSOS. © Andy Robinson / WHOI[/caption]
[caption id="attachment_37101" align="alignnone" width="1920"] Peter de Menocal (WHOI) speaks at Sentinel Mission Launch event. © Amber Coogan / WHOI[/caption]
![]()
![]()
PAMPortal Highlights OOI Acoustic Data

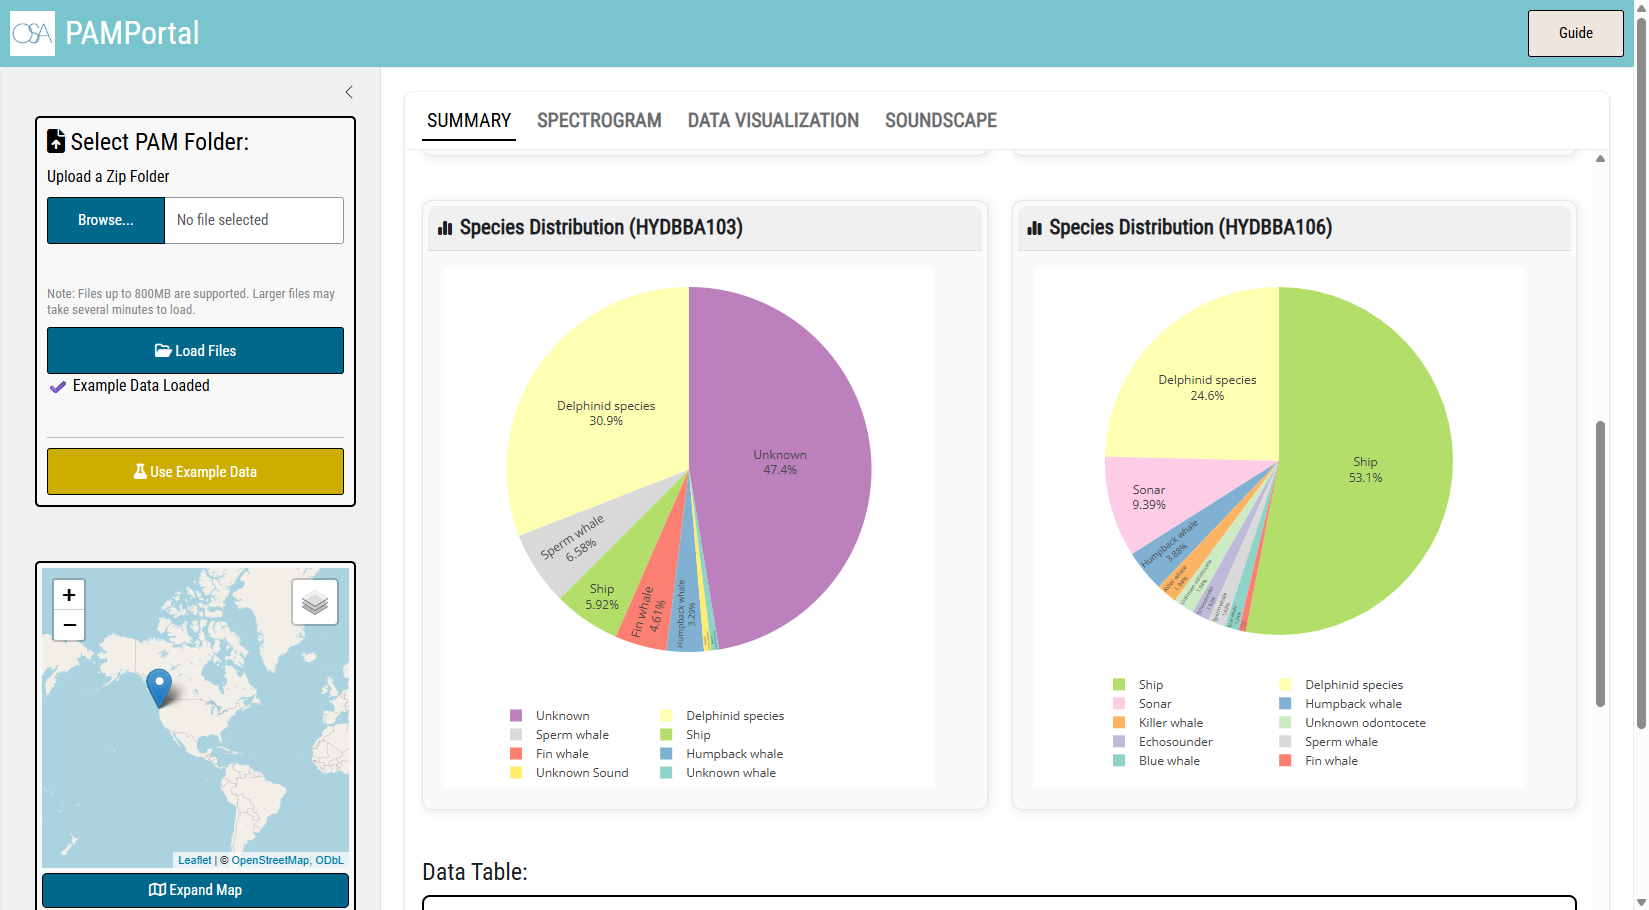
OOI data are now featured in PAMPortal, a new cloud-based tool that makes it easier for researchers to explore acoustic detections and soundscape metrics. PAMPortal integrates the passive acoustic analysis workflow using PAMGuard and PAMpal as part of its internal processing services (rather than as general public support tool for independent PAMGuard or PAMpal processing). This setup allows users to engage directly with marine mammal detection products and acoustic summaries.
For the OOI community, this connection is especially exciting. The tool’s built-in example dataset is drawn from OOI acoustic data. By selecting “Use Example Data,” users will see an informational card that acknowledges OOI and links to additional resources, providing a clear entry point into OOI’s rich acoustic archive.
By presenting OOI data in an accessible, interactive format, PAMPortal aims to make it easier to work with complex acoustic datasets and encourages broader use of OOI resources in research and discovery.
Wave Energy Converter Project Moves Toward At-Sea Testing

OOI, in partnership with the U.S. Department of Energy’s (DOE’s) Water Power Technologies Office (WPTO) is preparing to deploy a wave energy converter (WEC) device on the Pioneer MAB central surface mooring. The project aims to demonstrate how wave energy can provide reliable, renewable power for sustained ocean observation.
A recent visit brought together the team, which is comprised of experts from OOI, WPTO, Sandia National Laboratories, the National Renewable Energy Laboratory (NREL), Evergreen Innovations, Johns Hopkins University, East Carolina University, and Woods Hole Oceanographic Institution (WHOI) to focus on engineering validation for the Pioneer WEC, a critical step before at-sea testing later in the fall.
During the visit, the team carried out subsystem testing, integrated the WEC with the buoy, assembled the full system, and tested it under varied scenarios. This rigorous preparation is crucial for de-risking the upcoming deployment.
This project represents an important step toward persistent ocean observing systems. By reducing reliance on ship-based servicing and enabling longer-term autonomous operation, wave energy has the potential to transform how sustained ocean science is conducted.
[caption id="attachment_37035" align="alignnone" width="1813"]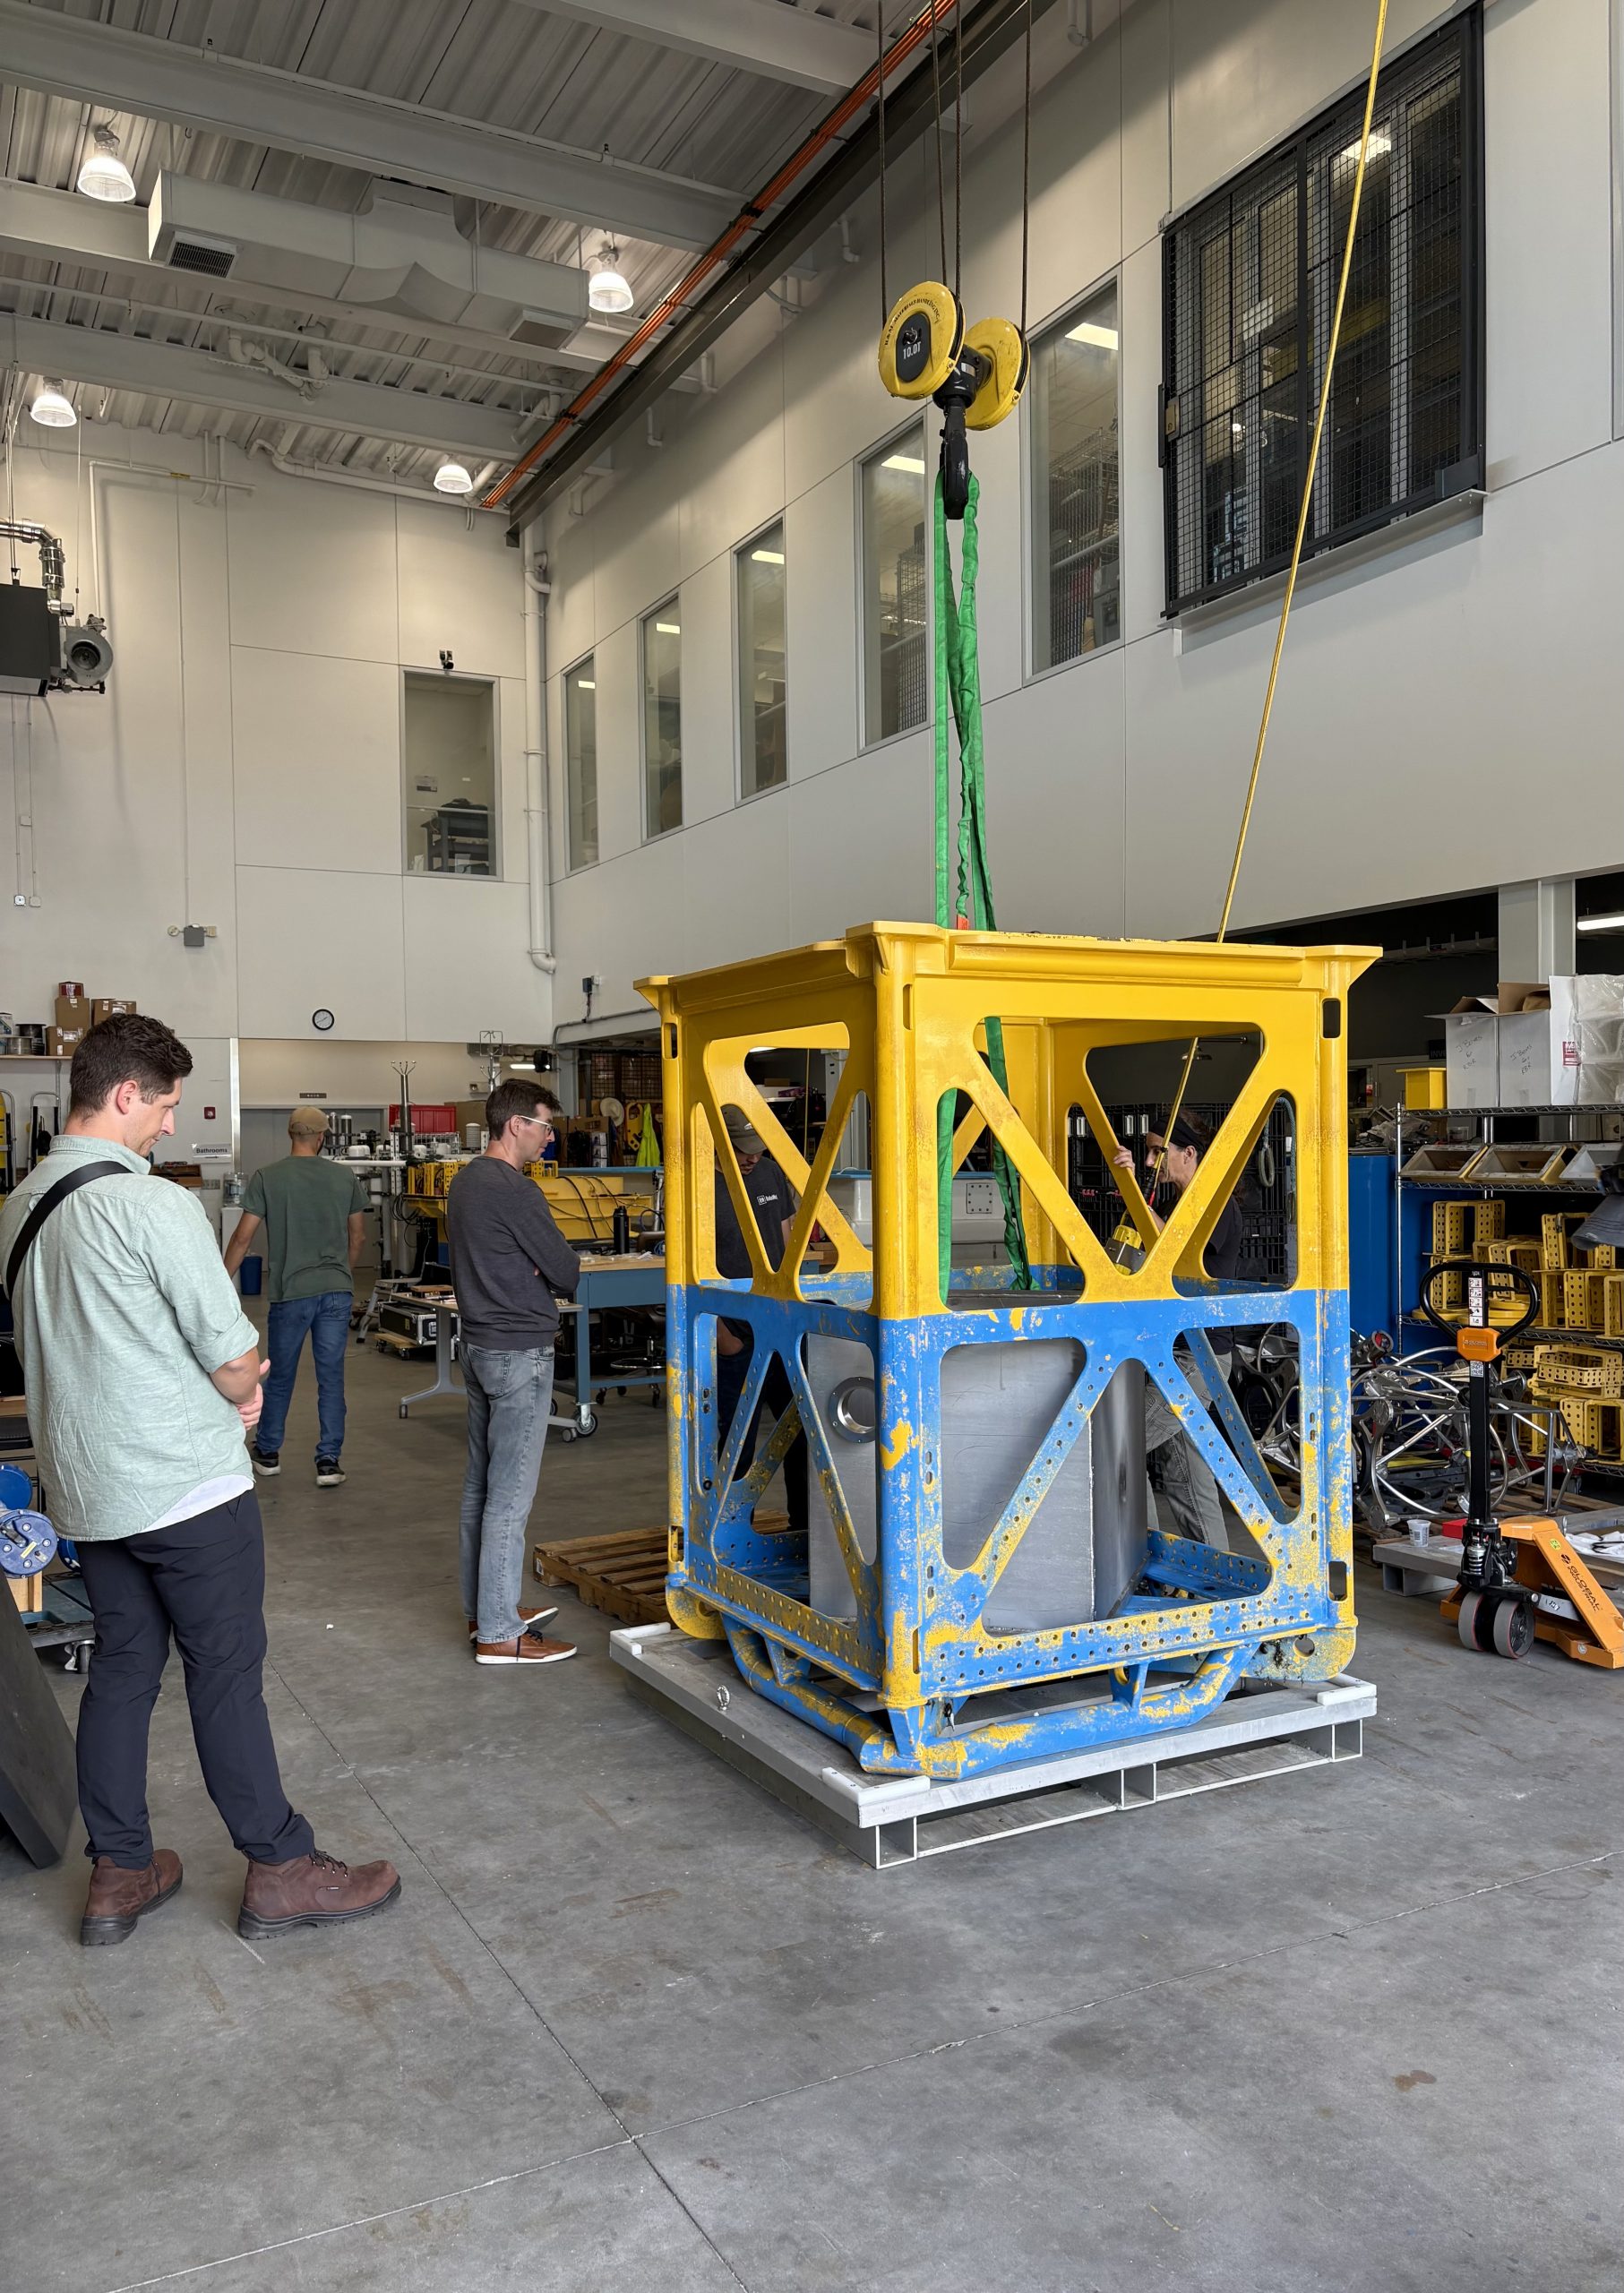 Taylor Mankle, NREL, and Johannes Spinneken, Evergreen Innovations, inspect the WEC housing installed in the buoy base. © Amber Coogan, WHOI[/caption]
[caption id="attachment_37037" align="alignnone" width="2560"]
Taylor Mankle, NREL, and Johannes Spinneken, Evergreen Innovations, inspect the WEC housing installed in the buoy base. © Amber Coogan, WHOI[/caption]
[caption id="attachment_37037" align="alignnone" width="2560"]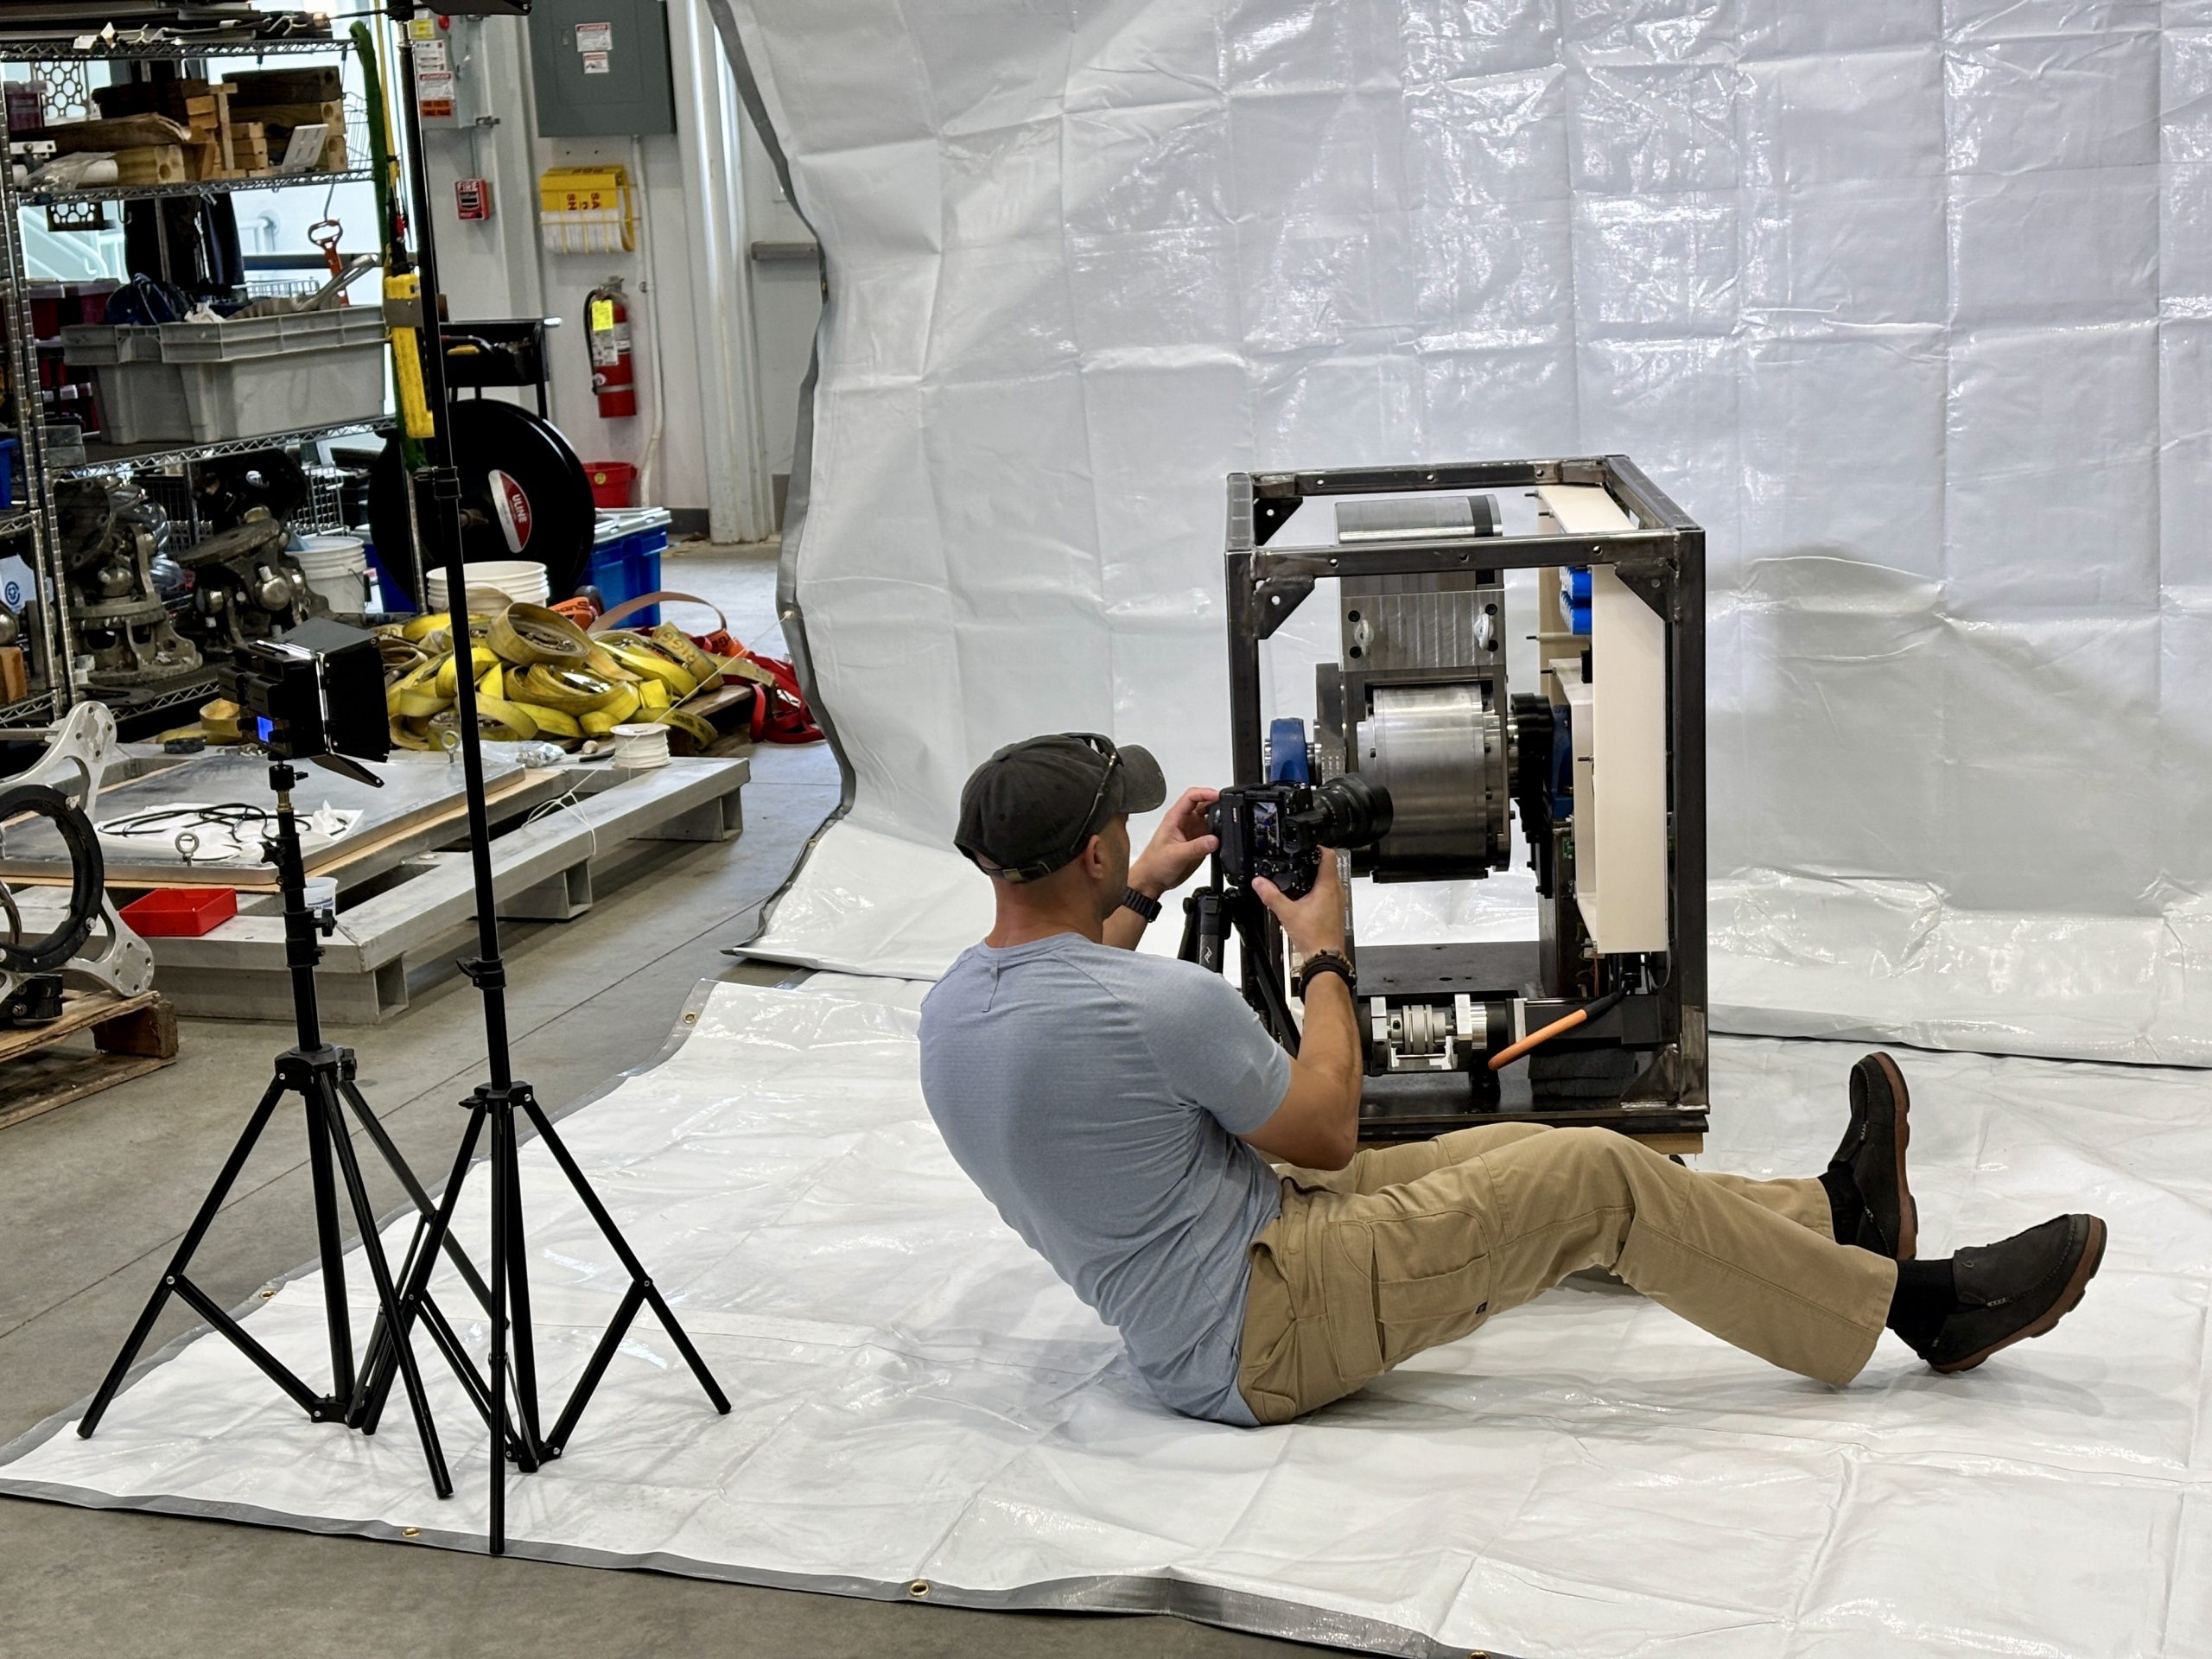 Joshua Bauer, NREL, captures still images for a 360° photographic reconstruction of WEC. © Ken Kostel, WHOI[/caption]
[caption id="attachment_37038" align="alignnone" width="2560"]
Joshua Bauer, NREL, captures still images for a 360° photographic reconstruction of WEC. © Ken Kostel, WHOI[/caption]
[caption id="attachment_37038" align="alignnone" width="2560"]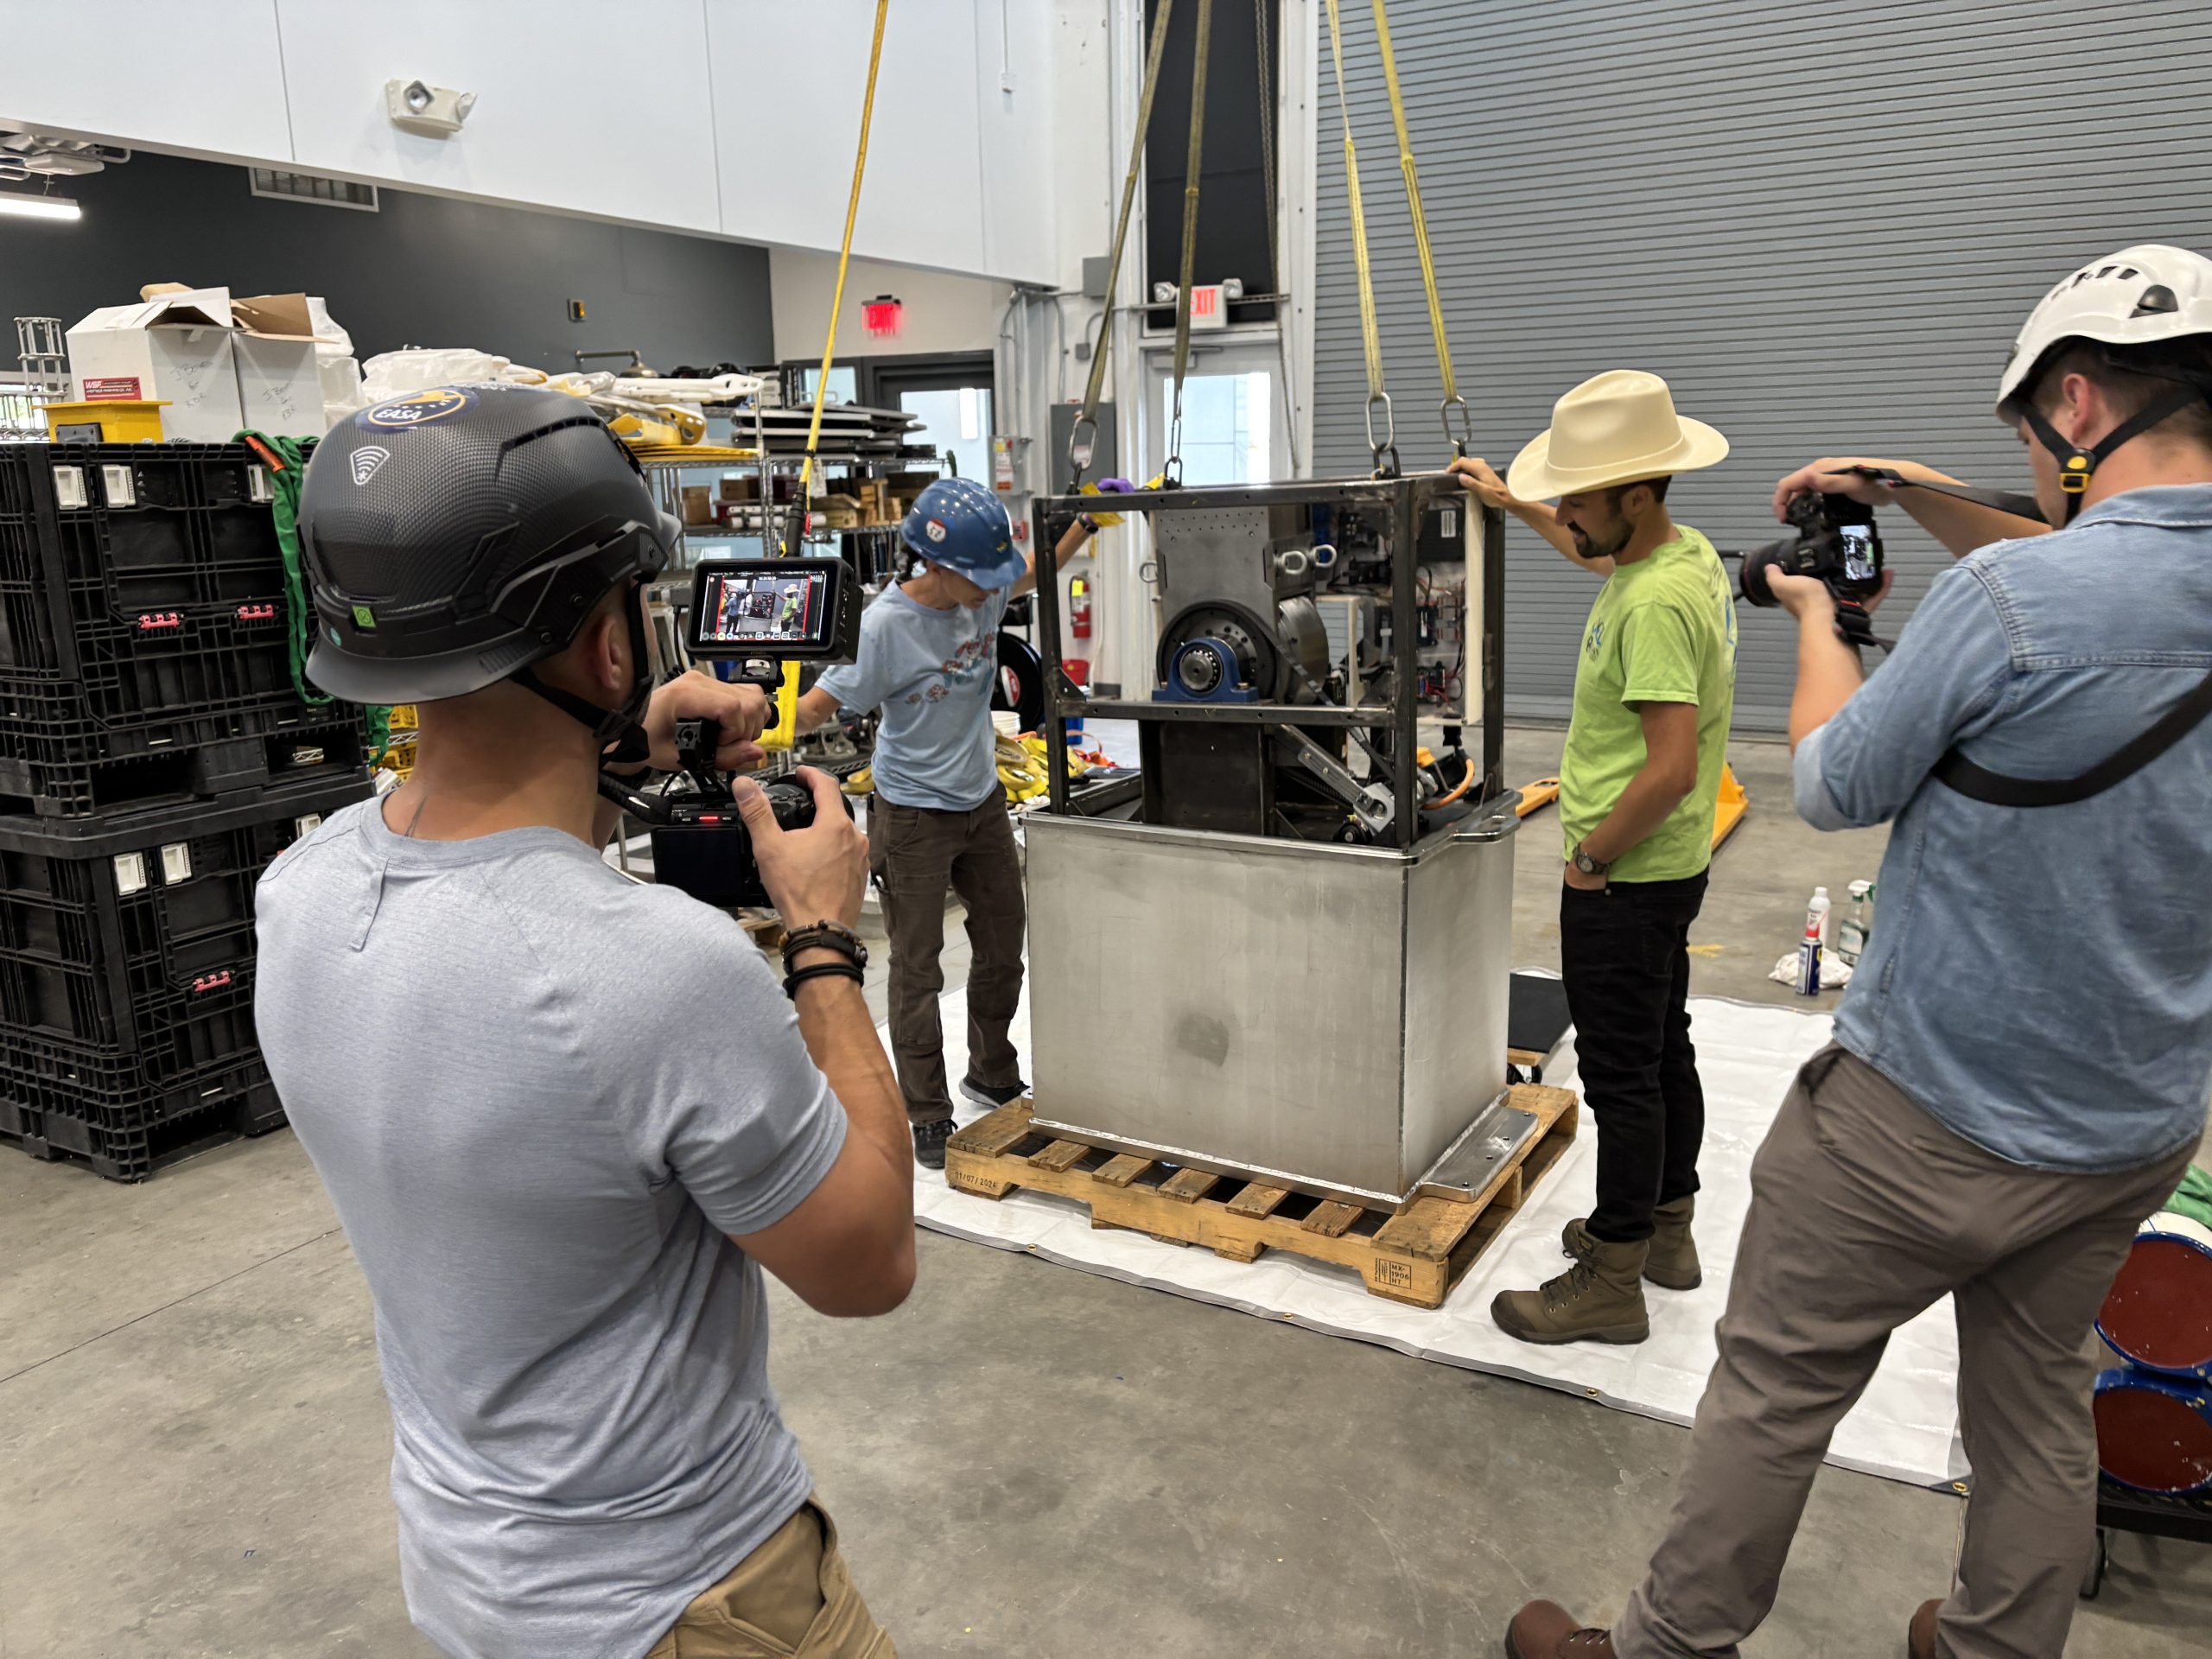 Joshua Bauer, NREL; Taylor Mankle, NREL; Meghan Donohue, WHOI; and Alex Franks, WHOI, install the WEC system into its watertight housing. © Ken Kostel, WHOI[/caption]
Read More
Joshua Bauer, NREL; Taylor Mankle, NREL; Meghan Donohue, WHOI; and Alex Franks, WHOI, install the WEC system into its watertight housing. © Ken Kostel, WHOI[/caption]
Read More This research vessel studies an underwater volcano off Oregon’s coast

The Research Vessel Atlantis is a ship currently around 300 miles off of the Oregon Coast, as it monitors the Axial Seamount underwater volcano and replaces sensors and equipment that are part of the Regional Cabled Array. Read more from Fox 12 Oregon.
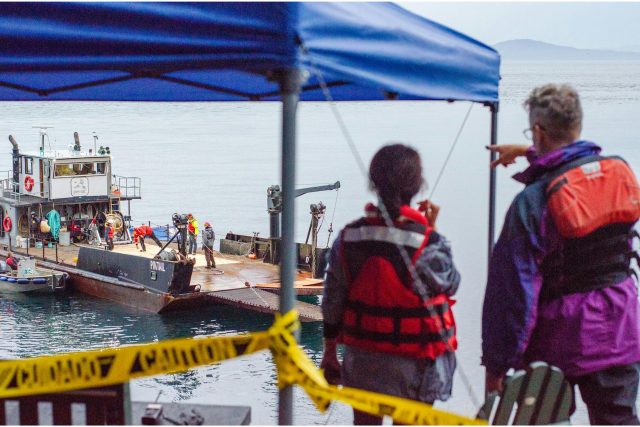
Read MoreMiniboat Hesperia Deployed from R/V Atlantis During OOI RCA Cruise
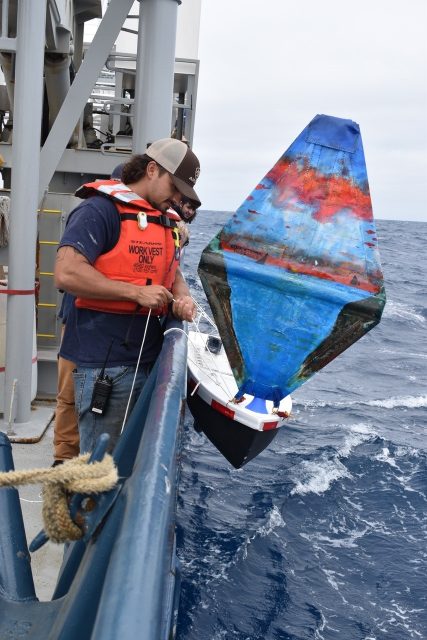
On August 24, 2025, during the 2025 Regional Cabled Array (RCA) Operations and Maintenance cruise, a small miniboat named M/B Hesperia was launched into the Pacific. About two hours after departing Axial Seamount, the boat was carefully deployed by hand off the starboard side of the R/V Atlantis.
The deployment was conducted at 15:31 PDT by Bosun Ed Popowitz and Able-Bodied Seaman Esteban Mogollon at coordinates 45.809950° N, 129.575011° W. The launch was met with enthusiasm and excitement from the crew, who gathered to watch Hesperia set sail.
This effort supports the Educational Passages Program and the Oregon Coast STEM Hub, part of Oregon Sea Grant, helping connect students and communities with ocean science through hands-on exploration.
You can follow the journey of M/B Hesperia in real time here: Track the boat.
[caption id="attachment_36992" align="alignnone" width="1280"]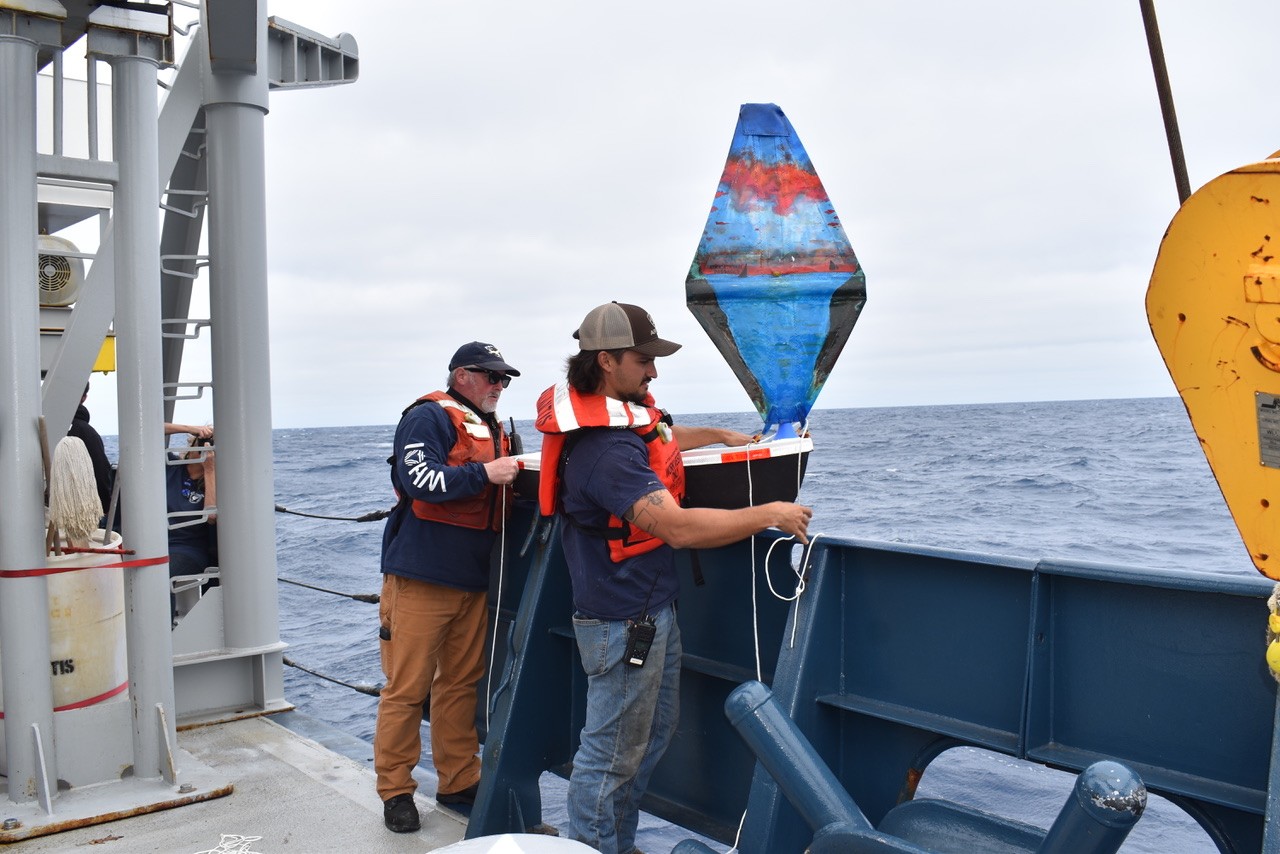 M. Elend, University of Washington, V25[/caption]
[caption id="attachment_36994" align="alignnone" width="1280"]
M. Elend, University of Washington, V25[/caption]
[caption id="attachment_36994" align="alignnone" width="1280"]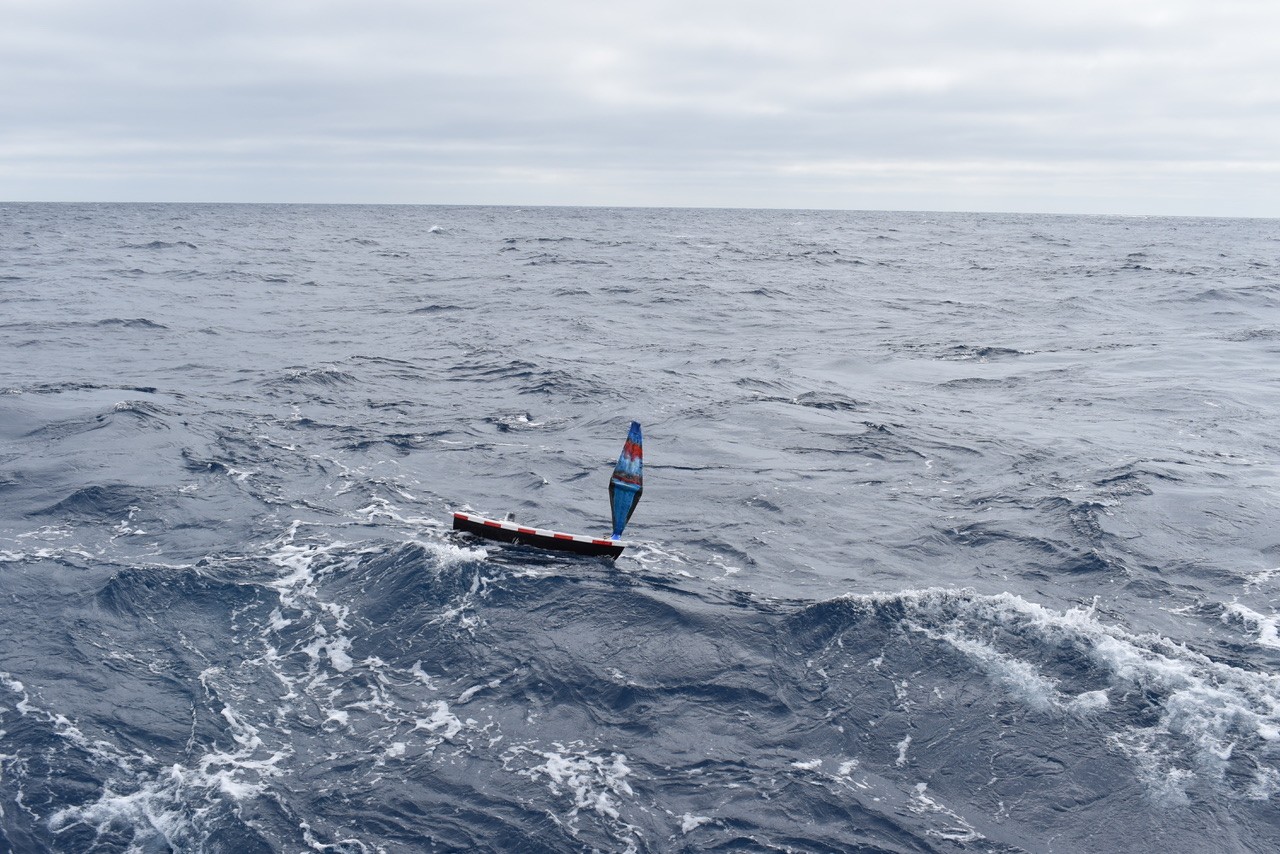 M. Elend, University of Washington, V25[/caption]
[caption id="attachment_36995" align="alignnone" width="1280"]
M. Elend, University of Washington, V25[/caption]
[caption id="attachment_36995" align="alignnone" width="1280"]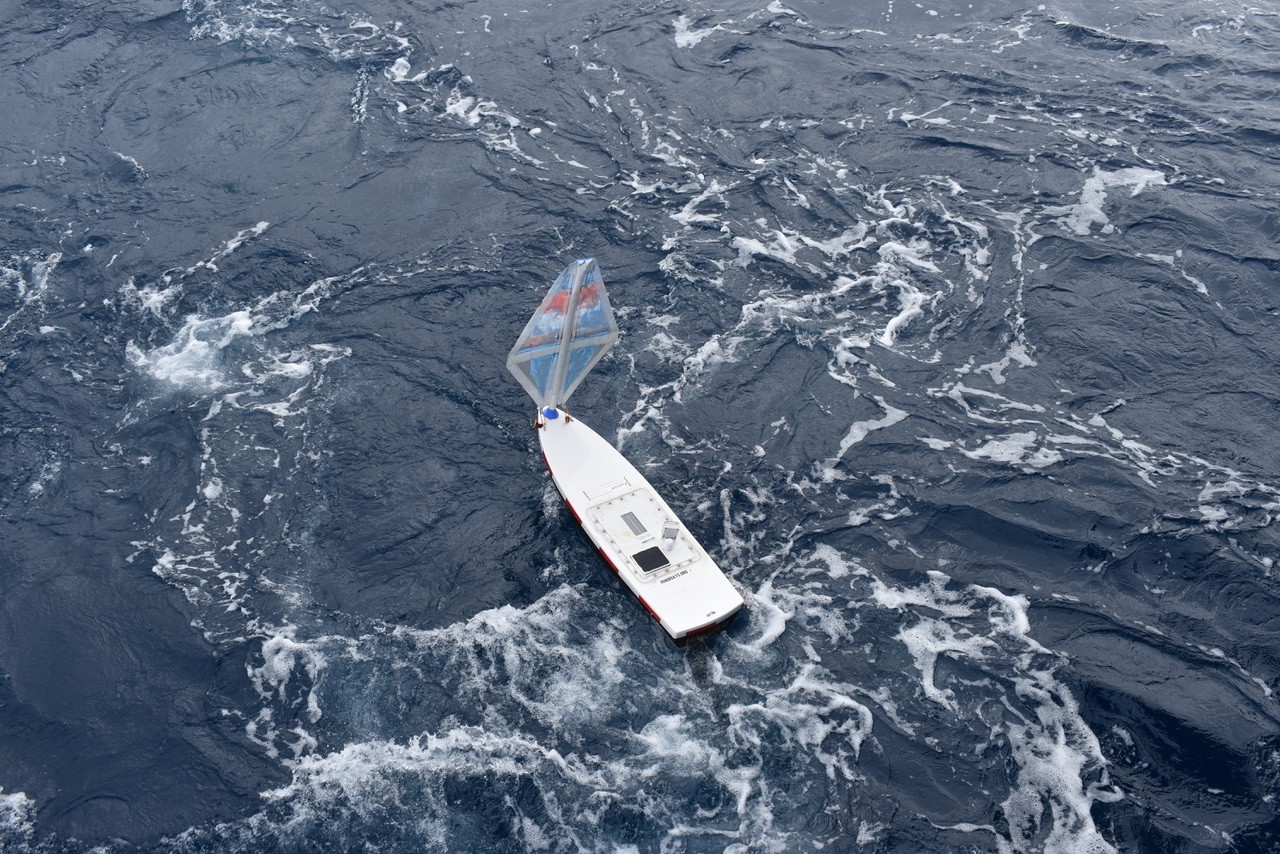 M. Elend, University of Washington, V25[/caption]
Read More
M. Elend, University of Washington, V25[/caption]
Read More