
Posts by Craig Risien
Endurance Array Measures Impact of Forest Fire Smoke
On September 8th 2020, wildfires spread quickly across western Oregon causing tremendous damage and shrouding the region with smoke for more than a week. Smoke from these fires, driven by an extreme Santa Ana-type easterly wind event, could be seen from satellites (figure 1). The smoky air moved directly across the path of the Coastal Endurance Array. A data view of this phenomenon is available here.
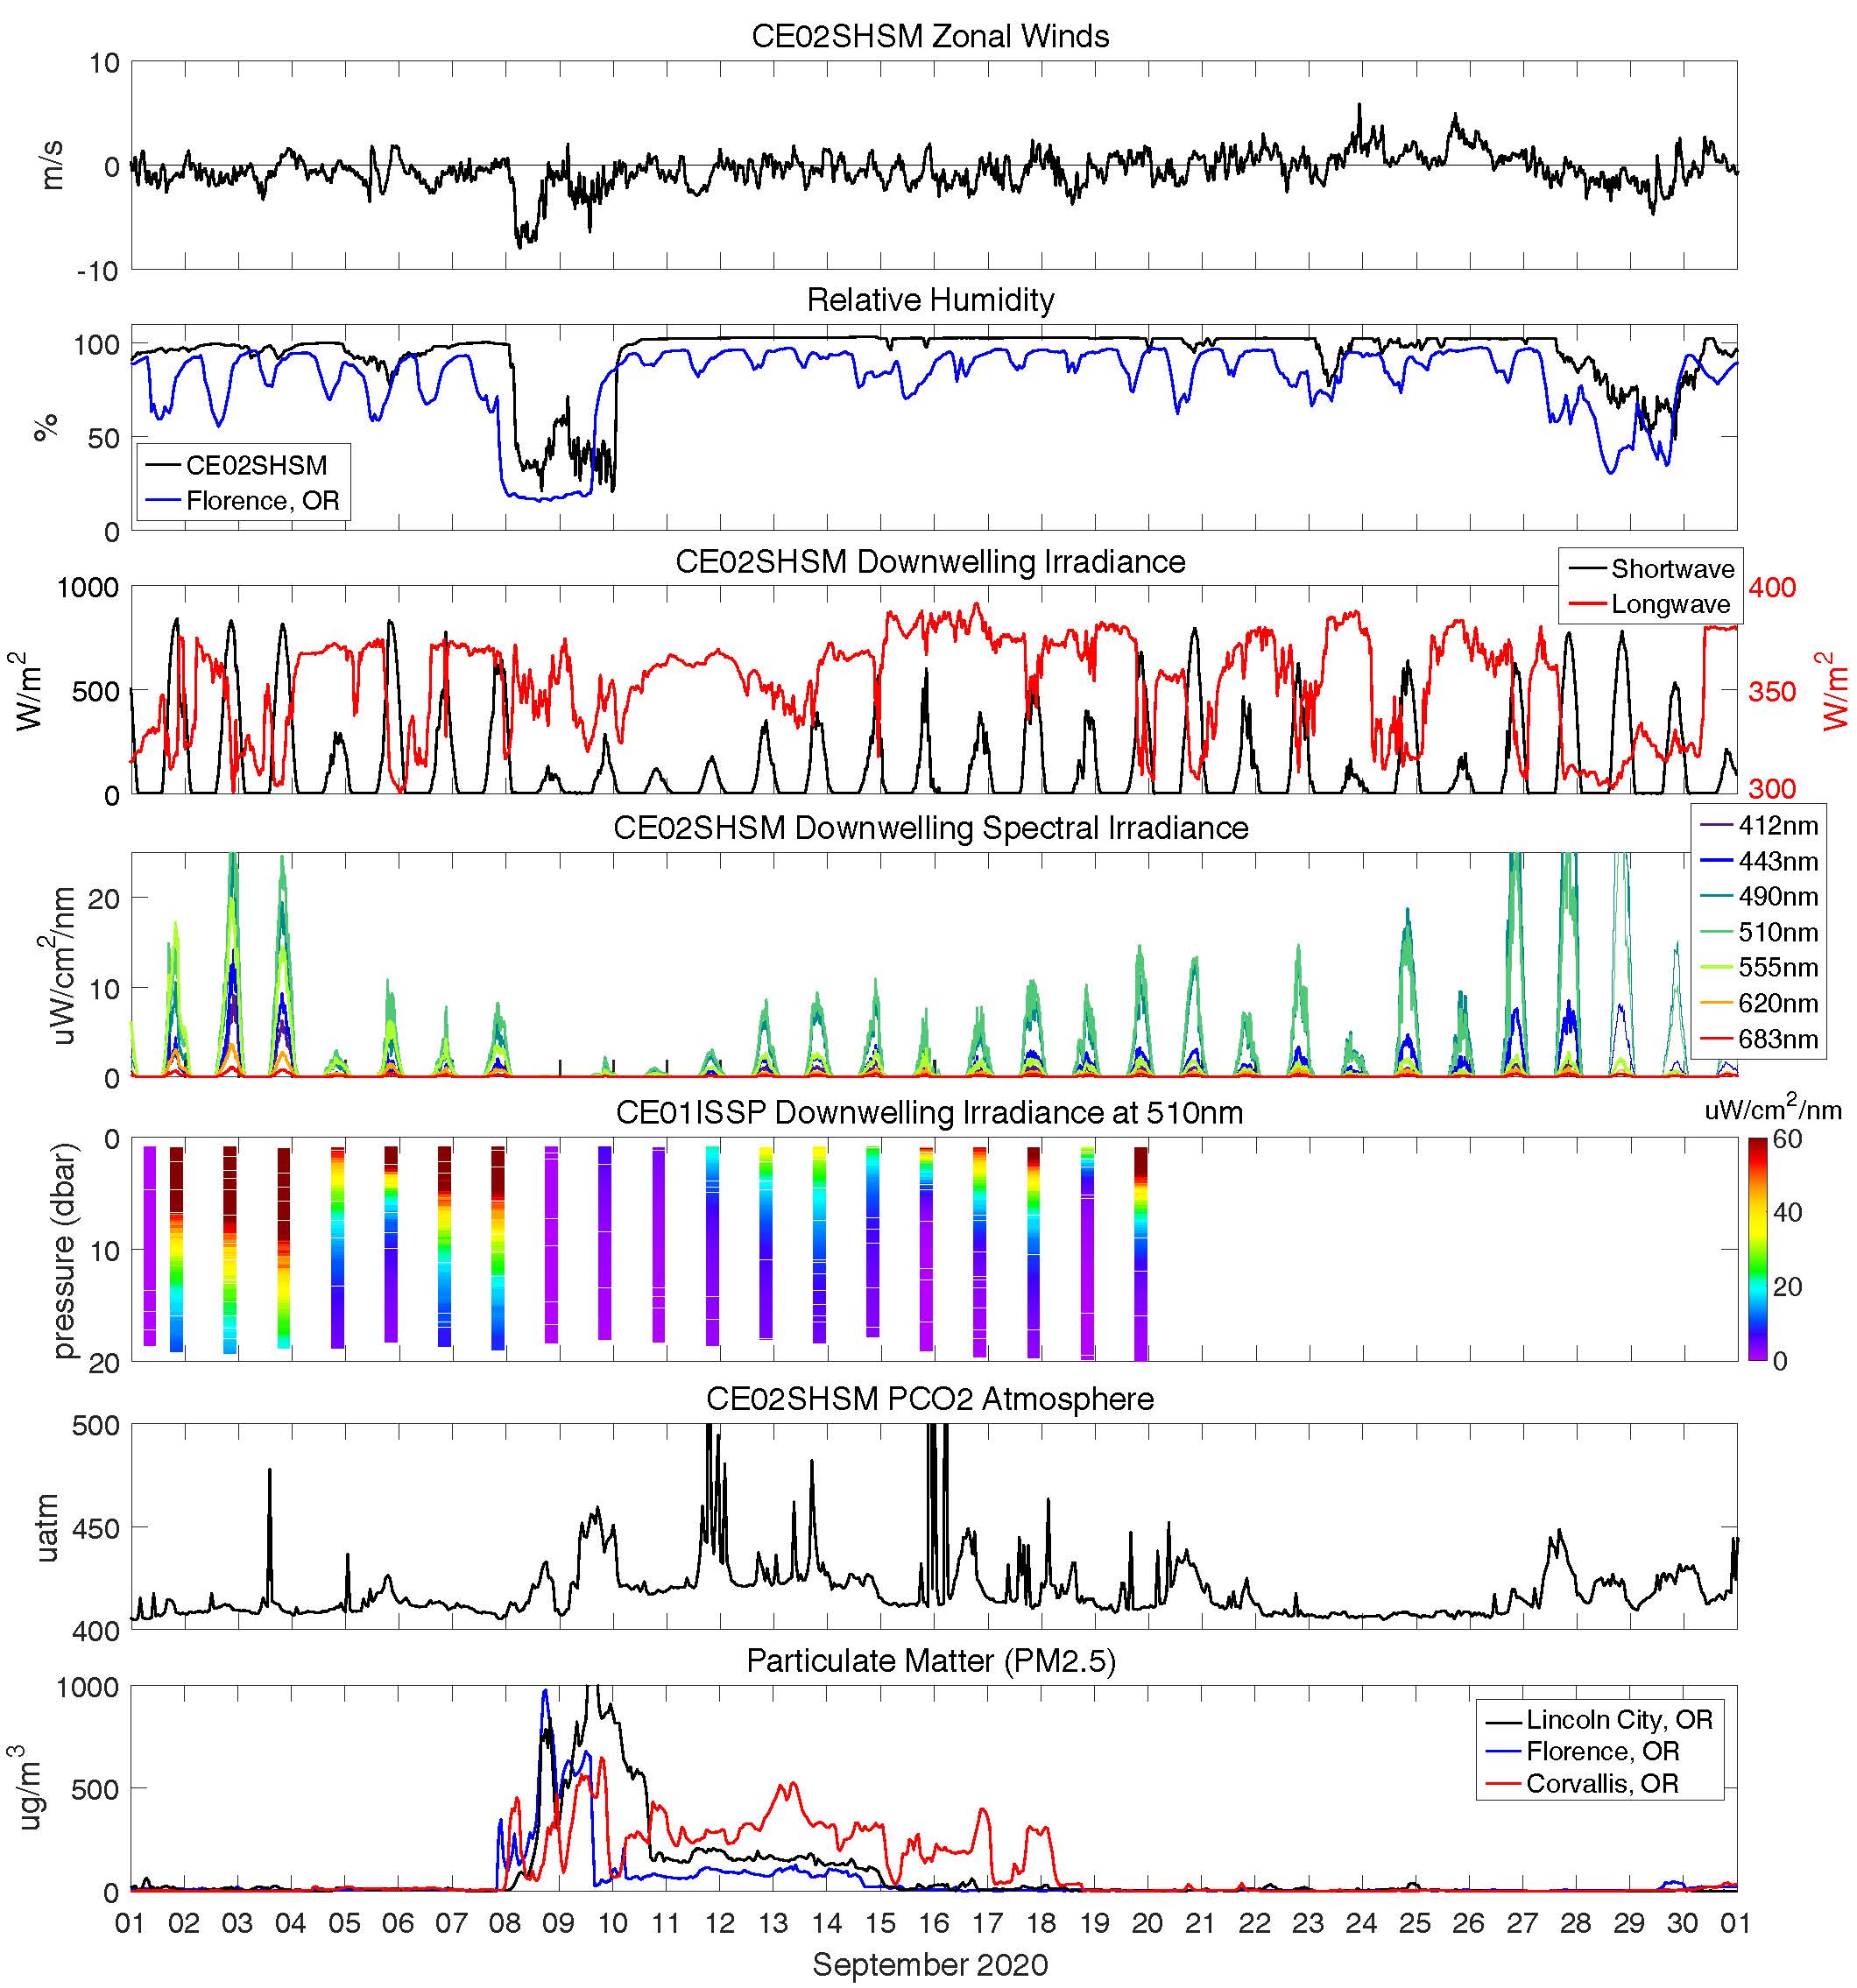
[caption id="attachment_20182" align="aligncenter" width="450"] The impact of the strong, dry offshore winds was measured by Coastal Endurance Array sensors shown here.[/caption]
Beginning on the 8th, strong, dry offshore winds blew past the Oregon Shelf Surface Mooring (CE02SHSM) 10 nautical miles west of Newport, which measured the lowest relative humidity values (<18%) since it was first deployed in April 2015 (panels a & b). These winds were followed by a week of reduced sunlight (panel c). Six meters below the surface, sunlight was reduced by the red smoke more in some colors than in others (panel d). Closer to shore at the Oregon Inshore site, light levels were measured throughout the water column by an OOI coastal surface piercing profiler (panel e). The smoky air had relatively high concentrations of carbon dioxide (panel f). Other Coastal Endurance Array sensors, such as bioacoustic sonars, also may have measured additional effects from these fires.
At the coast, the smokiest air cleared after a few days, although air particulates were elevated for more than a week (panel g). During the worst of the smoke, the iconic bridge over Yaquina Bay in Newport was hardly visible (figure 2). In Corvallis, 100 km inland and in the center of the Willamette Valley, unhealthy air blanketed the town for 10 days. These measurements are but one example of the type and quality of data being continuously collected by the Coastal Endurance Array.
[caption id="attachment_20185" align="aligncenter" width="640"]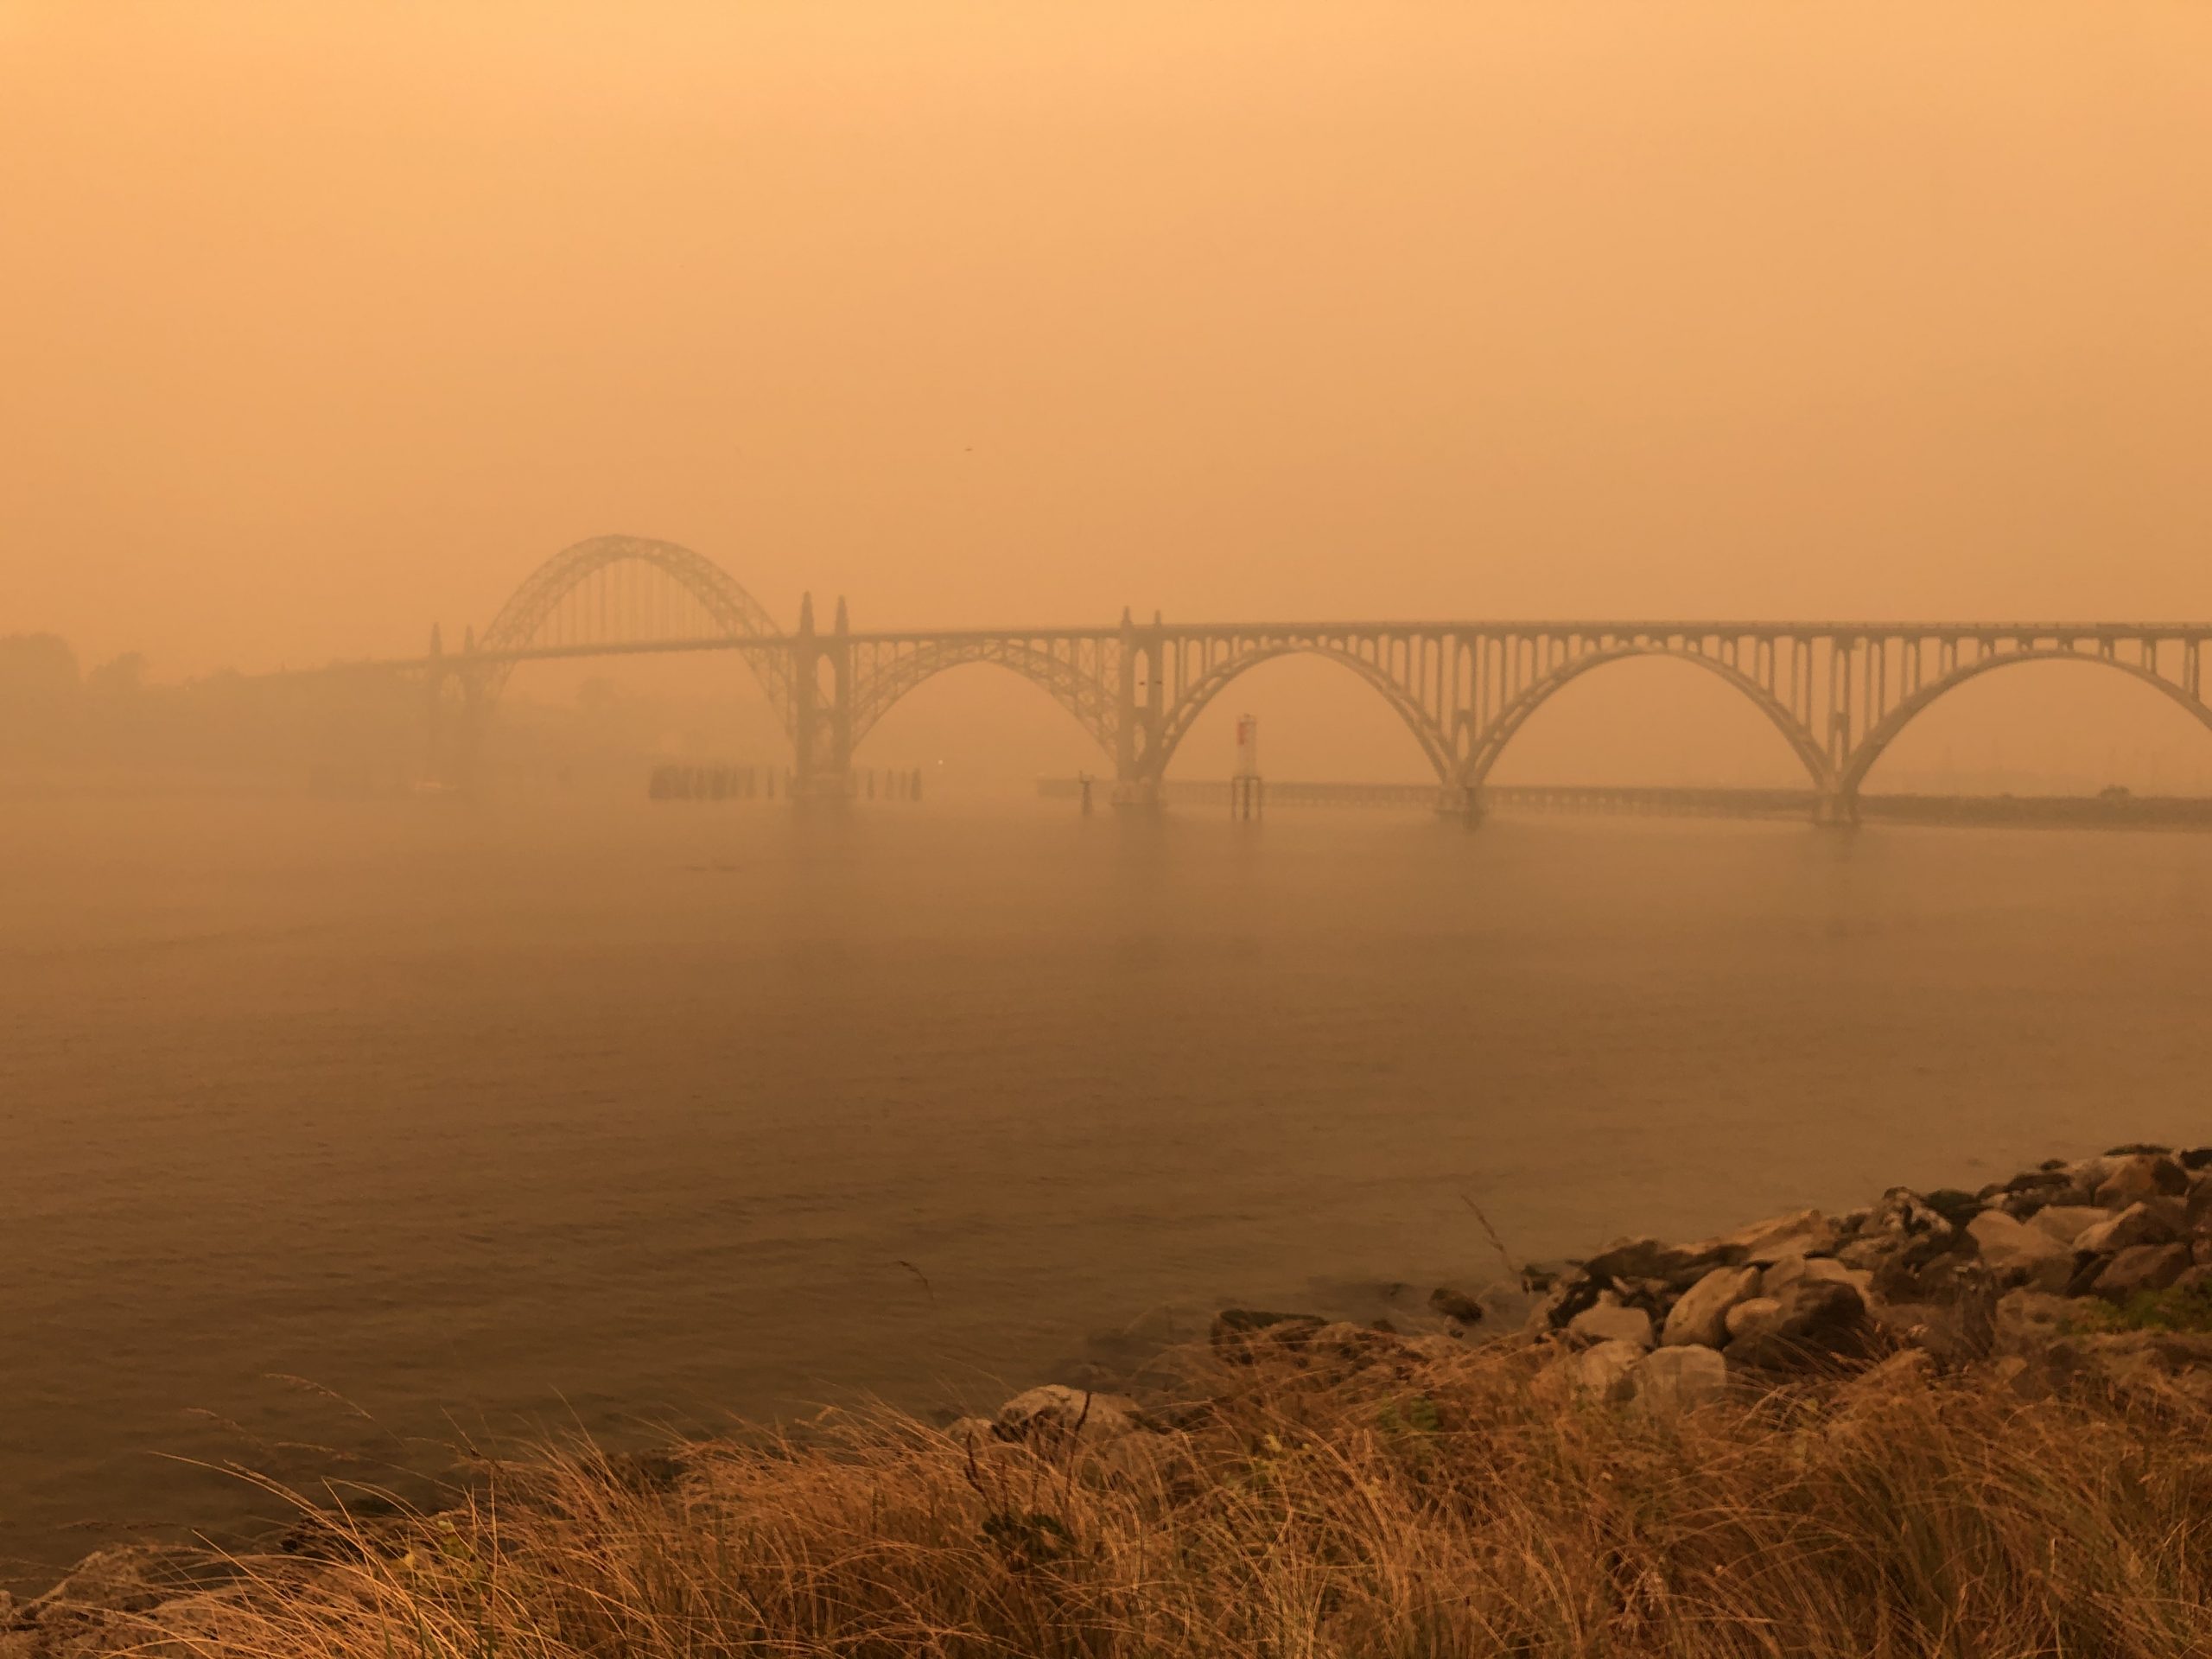 Figure 2. The Yaquina Bay Bridge was shrouded in smoke during an early October fire. Credit: Dr.Liz Perotti[/caption]
This article was written by Craig Risien and Jonathan Fram of the Coastal Endurance Array team.
Non-OOI data sources
NASA satellite images: https://earthobservatory.nasa.gov/images/147261/a-wall-of-smoke-on-the-us-west-coast
Florence air quality: https://oraqi.deq.state.or.us/home/map
Corvallis and Lincoln City air quality: https://www.purpleair.com/
Read More
Endurance Array Fall 2018 cruise data available through OOI Data Portal
Endurance Array Fall 2018 cruise data available through OOI Data Portal
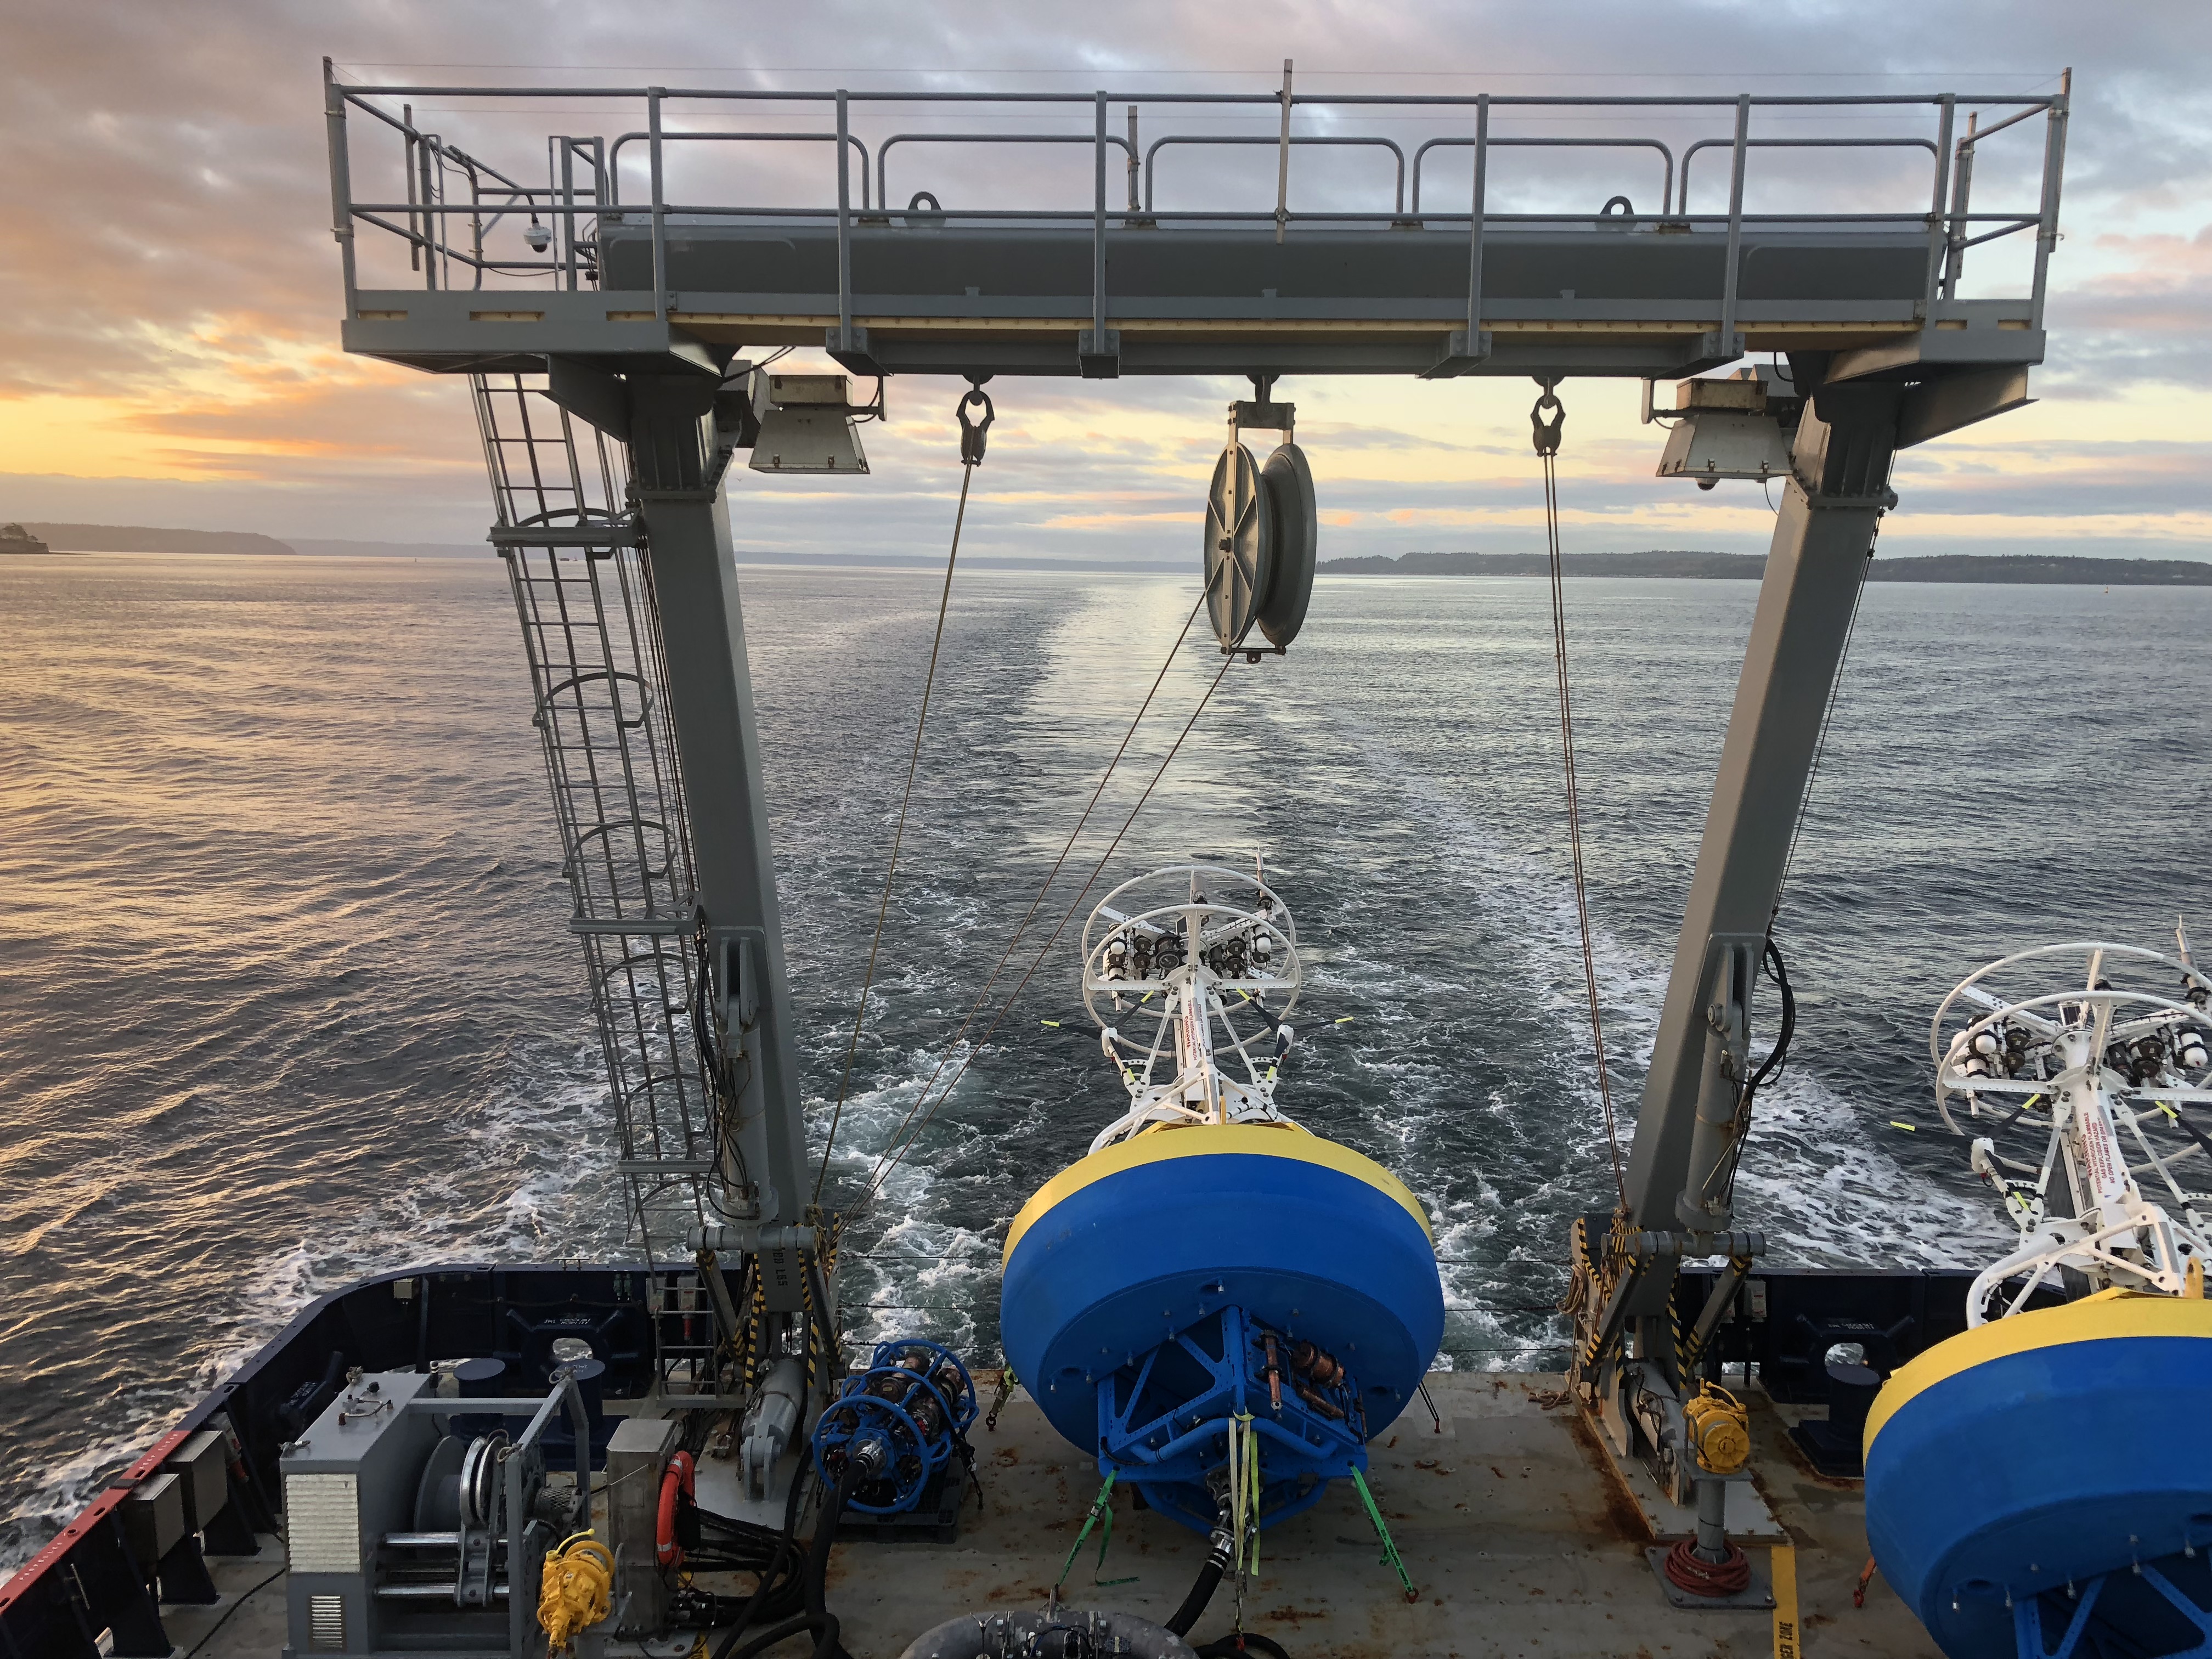
[media-caption type="image" path="https://oceanobservatories.org/wp-content/uploads/2019/01/IMG_1853.jpg" link="#"]The shelf and offshore Washington buoys on the back deck of the R/V Sally Ride. Photo Credit: Zoë Philby[/media-caption]The Fall 2018 Endurance Array cruise on the R/V Sally Ride departed Seattle, Washington on September 16 and completed in Newport, Oregon on September 30. All uncabled moorings were recovered and newly refurbished moorings deployed in their place. Telemetered science data from this deployment are being ingested and are available through OOI’s Data Portal. Data from instruments deployed in spring 2018 and recovered in Fall 2018 are also available through OOI’s Data Portal. As bottle data are analyzed, they are being posted to alfresco.oceanobservatories.org. The full cruise report is available at this URL.
Read More