
Posts by ooistaff
Building a Community of Practice for OOI Biogeochemical Sensor Datasets
The Ocean Observatories Initiative (OOI) includes sensors that measure key biogeochemical properties (pH, pCO2, bio-optics, nitrate, dissolved oxygen) on both moored and mobile autonomous platforms across arrays in the Atlantic, Pacific and Southern Oceans. These sensors provide enormous potential to support the oceanographic community in studying a wide range of important interdisciplinary questions. However, OOI biogeochemical sensor data have thus far been underutilized by the oceanographic community, as the application of these rich data streams to quantify biogeochemical fluxes and answer many questions of scientific interest (e.g., rates of air-sea CO2 flux, productivity, and export; comparison across sites; monitoring of long-term changes) require effective calibration and validation, including post-deployment human-in-the-loop processing. To broaden the use of OOI biogeochemical sensor data and increase community capacity to produce analysis-ready data products, we have acquired NSF support to bring together scientists with expertise in biogeochemical sensor calibration and analysis from both within and beyond the current OOI user community to develop guidelines and best practices for using OOI biogeochemical sensor data. These recommendations will be collated in a published white paper that will be shared with the broader oceanographic community to build data user capacity and enable new scientific applications of OOI biogeochemical sensor data.
This activity was initially planned as a small workshop in conjunction with the 2021 Ocean Carbon & Biogeochemistry (OCB) summer workshop (June 2021 in Woods Hole, MA). Given the uncertainties related to the pandemic, we would like to identify potentially interested participants early and query their preferred level(s) and mechanism(s) of engagement with this activity to help inform our planning efforts. We anticipate that the development of best practices for different biogeochemical variable sets will require several months of commitment, likely a combination of online engagement and participation in an in-person workshop that will either take place in 2021 or 2022. We envision that members of the oceanographic community may have varied levels of interest in such an activity (e.g., development of detailed OOI sensor data processing guidelines vs. broader scientific applications of OOI biogeochemical data streams). If you have any interest in potentially participating in this activity at any level, please fill out this Google form. Responses received by mid-October are greatly appreciated.
Additional information and questions about this activity can be directed to Hilary Palevsky (palevsky@bc.edu), Sophie Clayton (sclayton@odu.edu), and Heather Benway (hbenway@whoi.edu).
Read More
A Collaborative Month in the Irminger Sea
A team of 10 Woods Hole Oceanographic Institution scientists, who spent the month of August aboard the RV Neil Armstrong, arrived at home port in Woods Hole on 4 September, having successfully skirted Hurricane Laura as she headed in their direction. The bumpy ride home capped the successful deployment of all OOI Irminger Sea Array moorings in sometimes turbulent seas.
While onsite at the array, the team successfully met all of its mission objectives by recovering and deploying four moorings and deploying two gliders. One glider transits the individual moorings, which are spaced approximately 20 km apart, while the second glider samples the upper 200-meters of the ocean above the centrally located hybrid profiler mooring, which measures the remainder of the 2800-m water column. A third glider was recovered soon after deployment because it had a microleak. The team also conducted CTD casts at each of the moorings, which measure onsite temperature, salinity, and oxygen conditions and validate data being collected and sent to shore by the array.
“The Irminger Sea array presents both unique opportunities and challenges for reporting ocean data,“ explained Sebastien Bigorre, who served as chief scientist on the Irminger Seven expedition. “It is located in a remote area of the North Atlantic with high wind and large surface waves, which present operational challenges. The area is also of great interest for scientists and society because of the intense exchange of energy and gases between the atmosphere and the ocean. The ocean there captures heat and carbon dioxide from the atmosphere, thus it is an important component of the climate system. It is also a region of high biological productivity, making it an important fishery. Recent studies have shown that the data collected at the Irminger array are essential to correctly describe the ocean circulation of the North Atlantic.”
It is an eight-day transit from Woods Hole to the Irminger Sea Array and another eight-day transit to return to home port. To maximize the use of ship time, the Irminger Sea Array Team shared ship space and mission time with scientists from OSNAP (Overturning of the Subpolar North Atlantic Program). OSNAP is seeking to provide a continuous record of the horizontal transport of heat, mass, and freshwater in the subpolar North Atlantic, and is complemented by the much longer-term records of water-column properties and air-sea transfer of momentum, heat, and moisture that are provided by the OOI Irminger Sea Array. Once on site, the expedition started with deployment of OOI moorings and gliders, switched its focus to recovery and re-deployment of OSNAP moorings, before finishing with the recovery of the previous year OOI Irminger Sea moorings.
“Our partnership with OSNAP is an example of how we try to maximize our resources for scientific research, from cruise planning, to operations at sea. During transits, we test and triple check our equipment to ensure that comes deployment day, everything goes as smooth as possible. On site, we coordinate operations to accommodate for weather conditions or to optimize shared equipment or personnel. When there is a lull in scientific activities, we plan for the ship’s instrumentation to collect data that is relevant to our scientific objectives, so every hour of the cruise is used to its full potential,” added Bigorre.
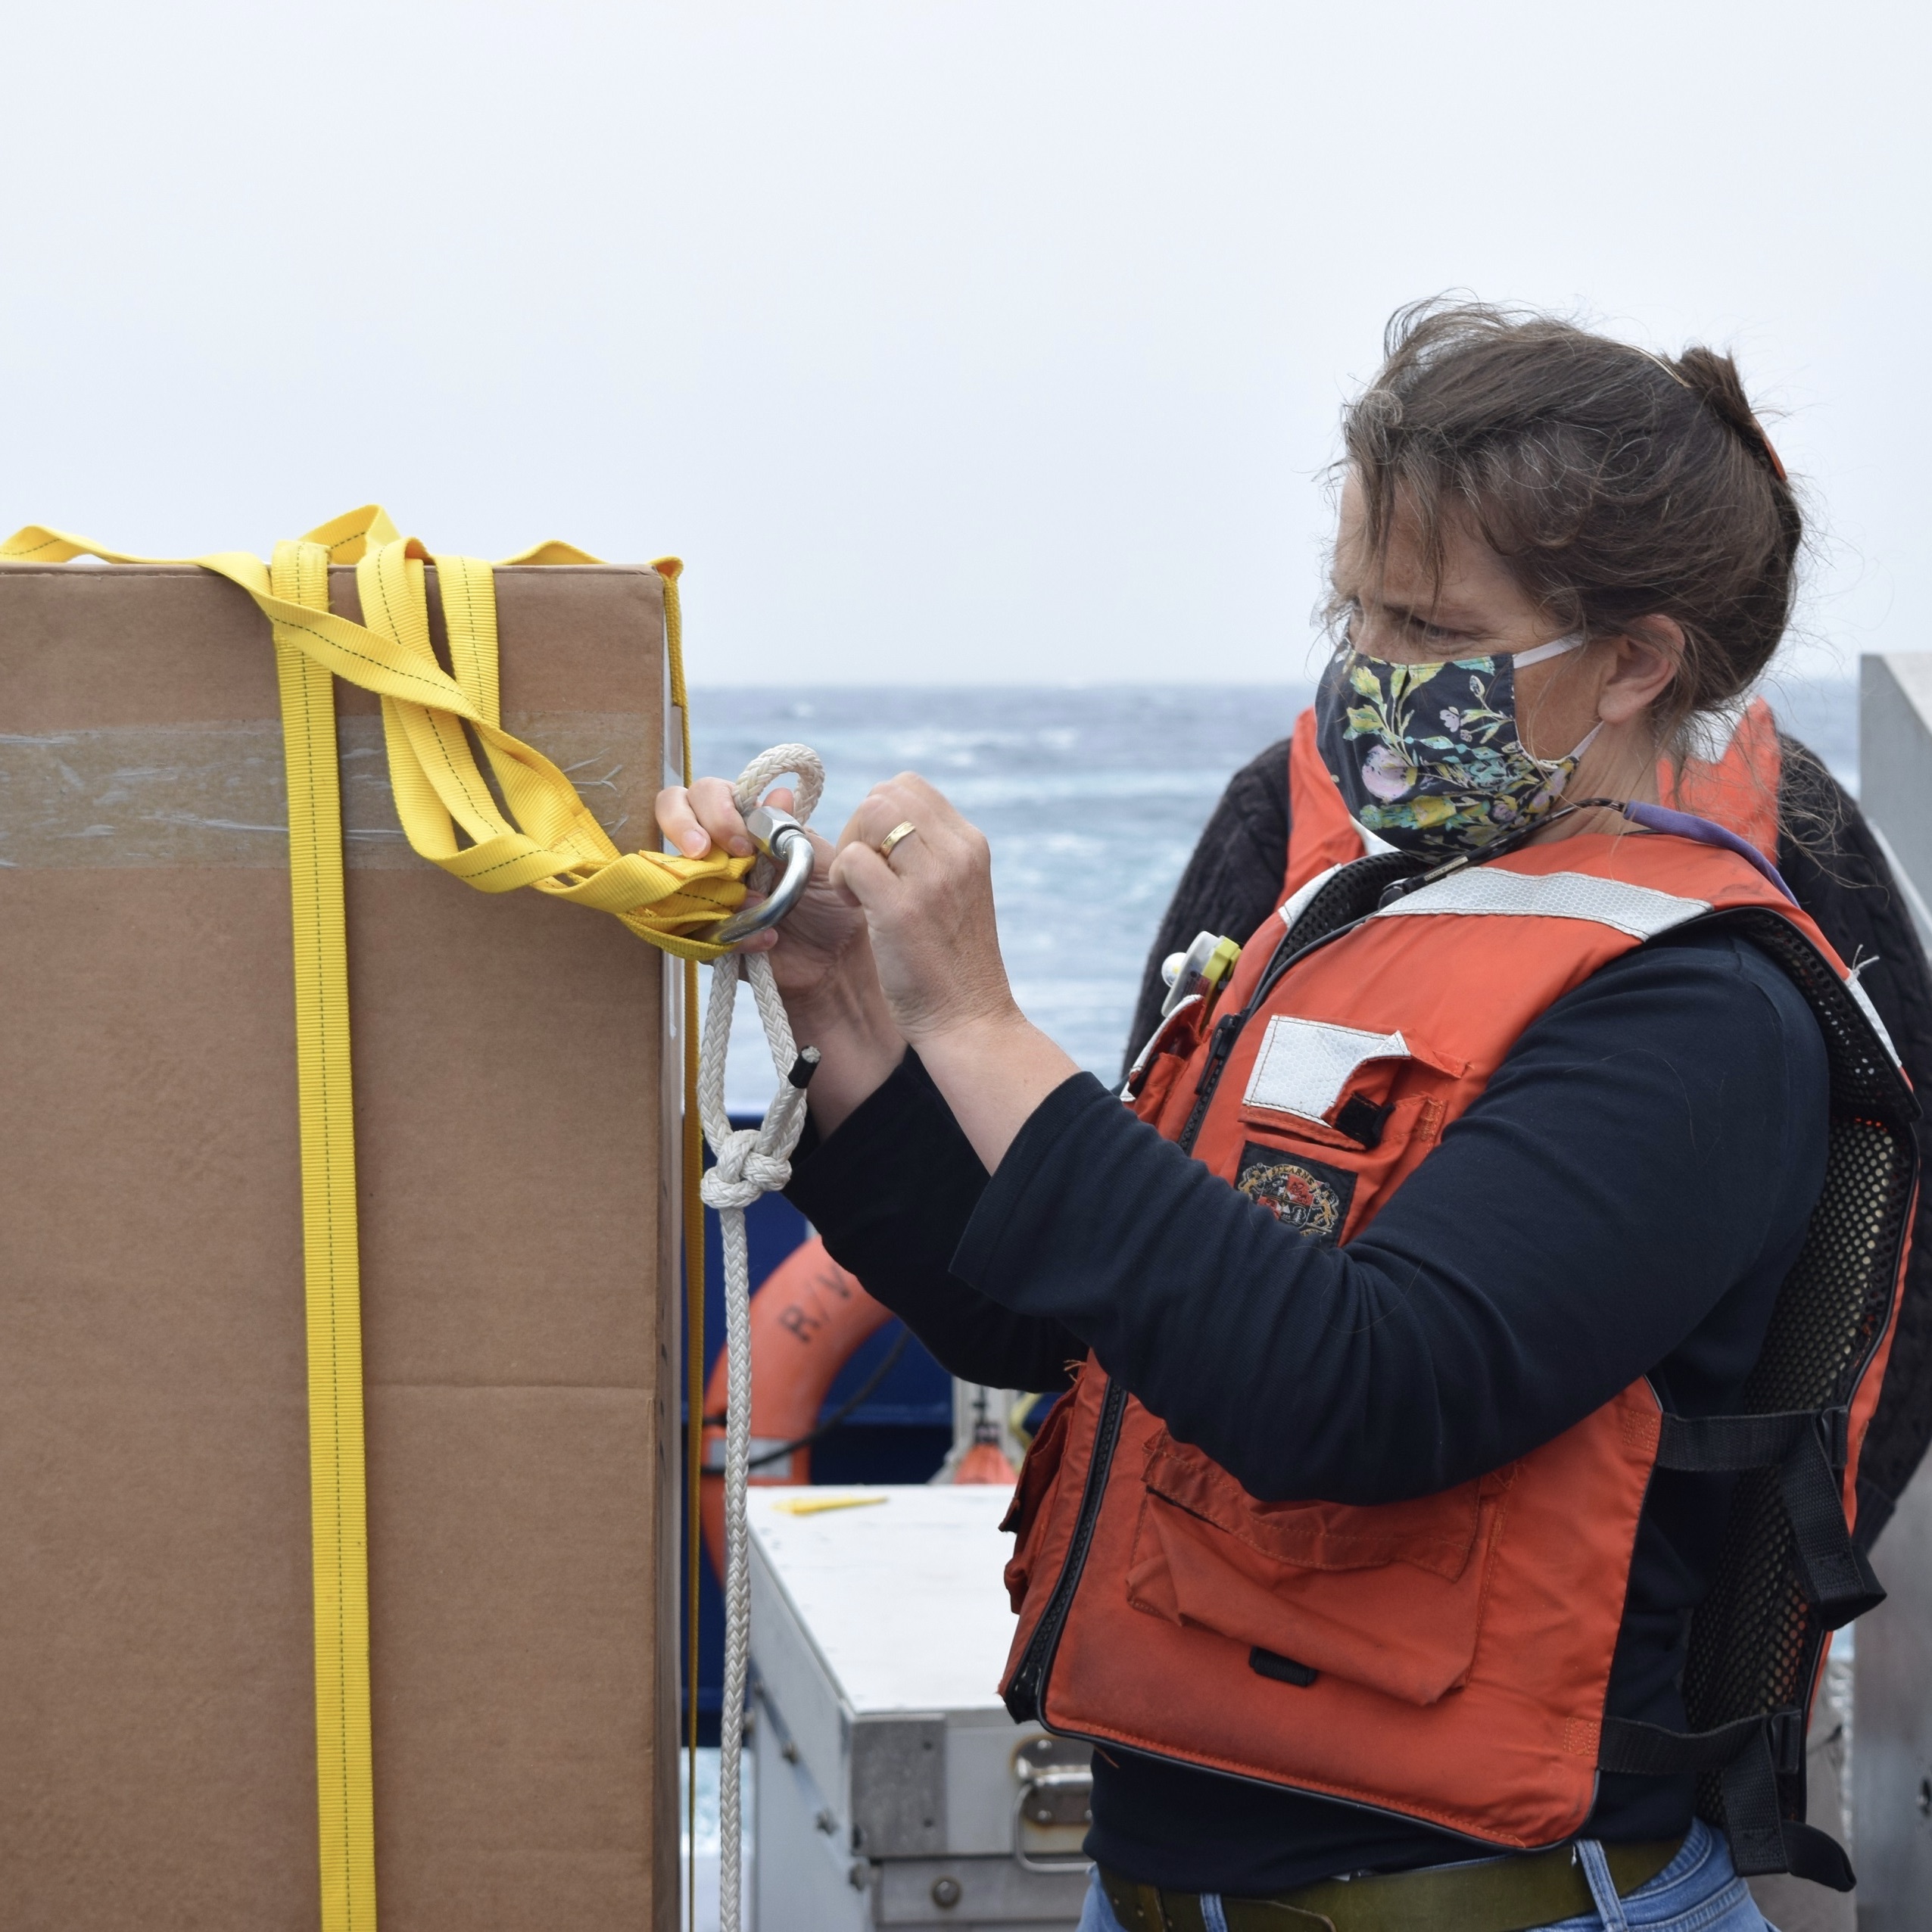
The following images show the many tasks undertaken during the month-long expedition:
[media-caption type="image" class="external" path="https://oceanobservatories.org/wp-content/uploads/2020/09/IMG_4208-scaled.jpg" alt="Irminger 7 masks" link="#"]OOI Irminger Sea cruise participants James Kuo (foreground), Jennifer Batryn, and Collin Dobson demonstrate proper social distancing and PPE use on the deck of the R/V Neil Armstrong during departure from the Woods Hole Oceanographic Institution (WHOI) dock Sunday 9 August. Photo credit: Rebecca Travis©Woods Hole Oceanographic Institution.[/media-caption] [media-caption type="image" class="external" path="https://oceanobservatories.org/wp-content/uploads/2020/09/IMG_4215-scaled.jpg" alt="Armstrong awaiting departure" link="#"]The R/V Neil Armstrong is loaded with crew and equipment and ready to depart for the month-long expedition to the Irminger Sea Array. Photo credit: Rebecca Travis©Woods Hole Oceanographic Institution.[/media-caption] [media-caption type="image" class="external" path="https://oceanobservatories.org/wp-content/uploads/2020/09/Screen-Shot-2020-09-14-at-4.56.05-PM.png" alt="Drone overhead" link="#"]A place for everything, everything in its place. Aerial view of the R/V Neil Armstrong deck with equipment loaded for the OOI Irminger Sea Array service cruise. Photo credit: James Kuo©Woods Hole Oceanographic Institution.[/media-caption] [media-caption type="image" class="external" path="https://oceanobservatories.org/wp-content/uploads/2020/09/Glider-with-mask-scaled.jpg" alt="Glider with mask" link="#"]Even the gliders took precautions for the Irminger Sea Expedition! (The tape was removed before deployment). Photo credit: Diana Wickman©Woods Hole Oceanographic Institution .[/media-caption] [media-caption type="image" class="external" path="https://oceanobservatories.org/wp-content/uploads/2020/09/IMG_2081-scaled.jpg" alt="Off stern" link="#"]Global Surface Mooring loaded on the R/V Neil Armstrong deck. It replaced a mooring recovered at the site. Photo credit: James Kuo©Woods Hole Oceanographic Institution.[/media-caption] [media-caption type="image" class="external" path="https://oceanobservatories.org/wp-content/uploads/2020/09/IR7_Dobson_lab-scaled.jpg" alt="Collin in lab" link="#"]Engineer Collin Dobson performs function checks on OOI gliders in the lab of the R/V Neil Armstrong during the transit out to the OOI Irminger Sea array. Photo credit: Jennifer Batryn©Woods Hole Oceanographic Institution.[/media-caption] [media-caption type="image" class="external" path="https://oceanobservatories.org/wp-content/uploads/2020/09/IR7_glider_prep-scaled.jpg" alt="Glider prep" link="#"]Two OOI gliders sit in the lab of the R/V Neil Armstrong during the transit out to the Irminger Sea array. The location of the glider oxygen sensors (blue housings forward of the tail fin) was modified so the sensor is exposed to the air when the glider surfaces. Photo credit:Jennifer Batryn©Woods Hole Oceanographic Institution.[/media-caption] [media-caption type="image" class="external" path="https://oceanobservatories.org/wp-content/uploads/2020/09/20200817_101902.cam3_.jpg" alt="Buoy camera" link="#"]Eyes at sea. This image was captured during the Irminger Global Surface Mooring deployment 17 August 2020 by a camera on the buoy shortly after the buoy was lowered into the water. The camera normally helps operators monitor ice buildup and storm conditions, but on that day it turned its lens on the action aboard the R/V Neil Armstrong. Photo credit: Buoy camera©Woods Hole Oceanographic Institution.[/media-caption] [media-caption type="image" class="external" path="https://oceanobservatories.org/wp-content/uploads/2020/09/SUMOsplice_NicoLlanos_20200811.jpg" alt="Nico splicing" link="#"]Nico Llanos splices lines together, in preparation for the OOI Global Surface Mooring deployment. The surface mooring will be deployed in almost 3,000 m (1.8 mile) of water off of Greenland. Together, the nylon and Colmega add up to almost one mile of rope line, and provide the bottom part of the mooring above its anchor. Photo credit: Heather Furey©Woods Hole Oceanographic Institution .[/media-caption] [media-caption type="image" class="external" path="https://oceanobservatories.org/wp-content/uploads/2020/09/whiteboard_AR46_20200811-1-scaled.jpg" alt="Whiteboard" link="#"]Just like on land, a whiteboard serves as a notice of ongoing and completed activities aboard the R/V Neil Armstrong during the Summer 2020 Irminger Sea month-long expedition. Photo credit: Heather Furey©Woods Hole Oceanographic Institution .[/media-caption] [media-caption type="image" class="external" path="https://oceanobservatories.org/wp-content/uploads/2020/09/IR7_Argo_float.jpeg" alt="Argo float" link="#"]Research Specialist Heather Furey prepares an Argo float for deployment off the stern of the R/V Neil Armstrong. The yellow straps are used to deploy the float while it is still in the box. The cardboard biodegrades in the water and releases the float. Photo credit: Jennifer Batryn©Woods Hole Oceanographic Institution.[/media-caption] [media-caption type="image" class="external" path="https://oceanobservatories.org/wp-content/uploads/2020/09/DSC_0403-scaled.jpg" alt="James Kuo" link="#"]OOI Engineer James Kuo checks the inductive communications on the Irminger Sea Flanking Mooring B during deployment. Most of the instruments on this subsurface mooring transmit data to the mooring controller inductively. The data is then sent acoustically to OOI Gliders which transmit the data to shore via satellite. Photo Credit: Jennifer Batryn©Woods Hole Oceanographic Institution.[/media-caption] [media-caption type="image" class="external" path="https://oceanobservatories.org/wp-content/uploads/2020/09/DSC_0908-1-scaled.jpg" alt="McClane Profiler" link="#"]The OOI team at the Irminger Sea Array deploying the Profiler Mooring. The yellow McLane Moored Profiler with a suite of science instruments is carefully lowered into the water. It will measure water properties including temperature, salinity, fluorescence, dissolved oxygen and water velocity. Photo credit: Jennifer Batryn©Woods Hole Oceanographic Institution.[/media-caption] [media-caption type="image" class="external" path="https://oceanobservatories.org/wp-content/uploads/2020/09/DSC_0012-scaled.jpg" alt="Profiler off stern" link="#"]The OOI Irminger Sea Hybrid Profiler Mooring is deployed top-first and trails behind the ship. Once the ship is at the desired location, the anchor is slid off the back deck, making quite a splash as it falls to the seafloor, pulling the mooring into place. Photo credit: Jennifer Batryn©Woods Hole Oceanographic Institution.[/media-caption] [media-caption type="image" class="external" path="https://oceanobservatories.org/wp-content/uploads/2020/09/Irminger-Sea-Posting--scaled.jpg" alt="Group shot" link="#"]The OOI and OSNAP science team poses on the back deck of the R/V Neil Armstrong on 27 August. 2020, after completing operations at the Irminger Sea Array. Using the last hours of good weather, equipment was secured before the eight-day voyage back to Woods Hole. Photo: Michael Sessa©Woods Hole Oceanographic Institution.[/media-caption] [media-caption type="image" class="external" path="https://oceanobservatories.org/wp-content/uploads/2020/09/northernlights_dobson-scaled.jpeg" alt="Northern lights" link="#"]One of the advantages of going to the OOI Irminger Sea Array is the opportunity to see the northern lights (Aurora borealis).This photo was taken as the team transited home through the Labrador Sea. What a great reward for all of the hard work put in to have a successful cruise! Photo credit: Collin Dobson©Woods Hole Oceanographic Institution.[/media-caption] Read MoreAxial Seamount: One of the Longest Records for Tsunami Research in the Ocean
Adapted and condensed by OOI from Fine et al., 2020, doi:/10.1029/2020GL087372.
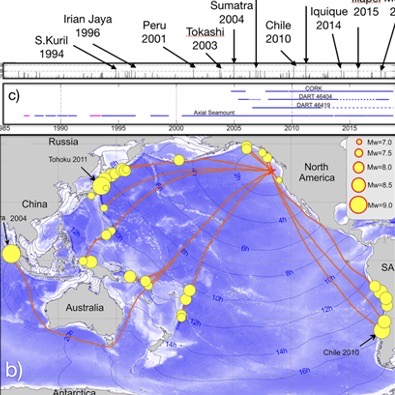
[caption id="attachment_18951" align="aligncenter" width="794"]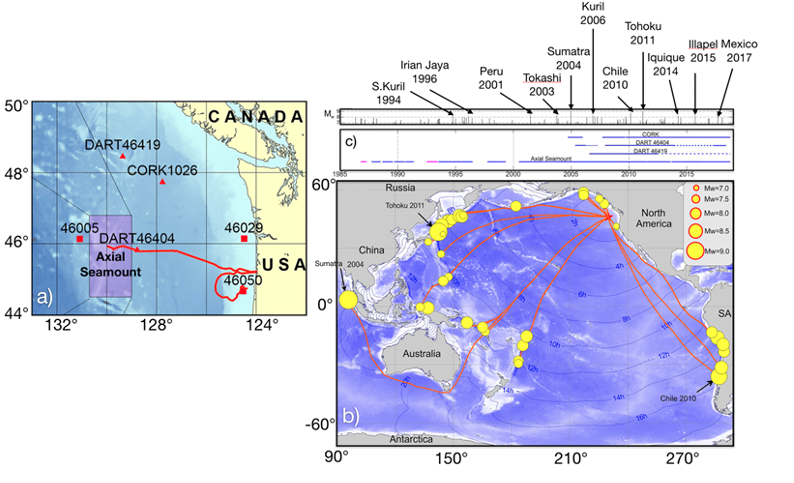 Figure 22. a) Location of bottom pressure recorders (BPRS) at Axial Seamount and vicinity (Cleft segment not shown in this illustration), including DART buoys and an IODP Corked site (after [1]). Most of the pressure data for this investigation were from Axial Seamount. b) Source regionals for the tsunamis recorded at Axial with yellow circles indicating earthquake locations and circle size proportional to magnitudes. The thin blue lines mark the leading edge of tsunamis at 2 hr intervals after an earthquake. c) Temporal coverage of the BPR records and recorded tsunamis at Axial and adjacent areas 1986-2018. Magenta lines are BPR recordings from the Cleft Segment, south of Axial on the Juan de Fuca Ridge.[/caption]This study by Fine et al., [1] examines a 32 year record of high resolution bottom pressure recorder (BPR) measurements made by cabled instruments installed on Axial Seamount in 2014, and uncabled instruments at Axial, the Cleft Segment of the Juan de Fuca Ridge, DART buoys, and an IODP cored observatory (Hole 1026): most of the measurements in this study are from Axial (Figure 22). A total of 41 tsunamis were documented from 1986-2018 with all events associated with tsunamigenic earthquakes with magnitudes of 7.0 or greater. In contrast to coastal tide gauge observations, open ocean measurements by BPRs are advantageous because of the high signal-to-noise ratio. Based on this study, it is possible to forecast the effect of a tsunami originating from a source near a historical source, not only for Axial, but also for locations along the British Columbia‐Washington‐Oregon coast. These results allow a size-frequency model world-wide. The RCA cabled bottom pressure-tilt instruments, with 20 Hz sampling rates and with resolutions of 2 mm of seawater depth, provide especially high-resolution measurements.
[1] Fine, I.V., Thomson, R.E., Chadwick, W.W., Jr., and Fox, C.G., (2020) Toward a universal frequency occurrence distribution for tsunamis: statistical analyses of a 32-year bottom pressure record at Axial Seamount. Geophysical Research Letter, https://doi.org/10.1029/2020GL087372.
Read More
Ocean Data Labs Webinar 16 September

On 16 September at 4 pm Eastern, Ocean Data Labs will kick off it fall webinar series: Ocean Data Labs Plus, a webinar series for Community College and University Professors teaching oceanography or geosciences courses. The series opener will be “New You Can Use,” hosted by the OOI Data Labs Project Team and special guests.
The webinar will explore how the Data Labs Project can support your efforts to introduce big data into your undergraduate courses. Join the Team to find out about newly-developed interactive online data-focused activities that are grounded in learning science – and consider how to effectively incorporate them into your courses. Check out the Ocean Data Lab’s online collection of data explorations and data nuggets in advance, and bring your questions and ideas. Each webinar will last about 60-75 minutes and is meant to be more of an interactive discussion.
Register: https://rutgers.zoom.us/meeting/register/tJApfuGoqjItGtbfEBMLQFf9MNkZTDCVGUdp
Read More
Irminger Sea Intermediate Water Formation and Transport
Adapted and condensed by OOI from Le Bras et al., 2020, doi:/10.1029/2019GL085989.
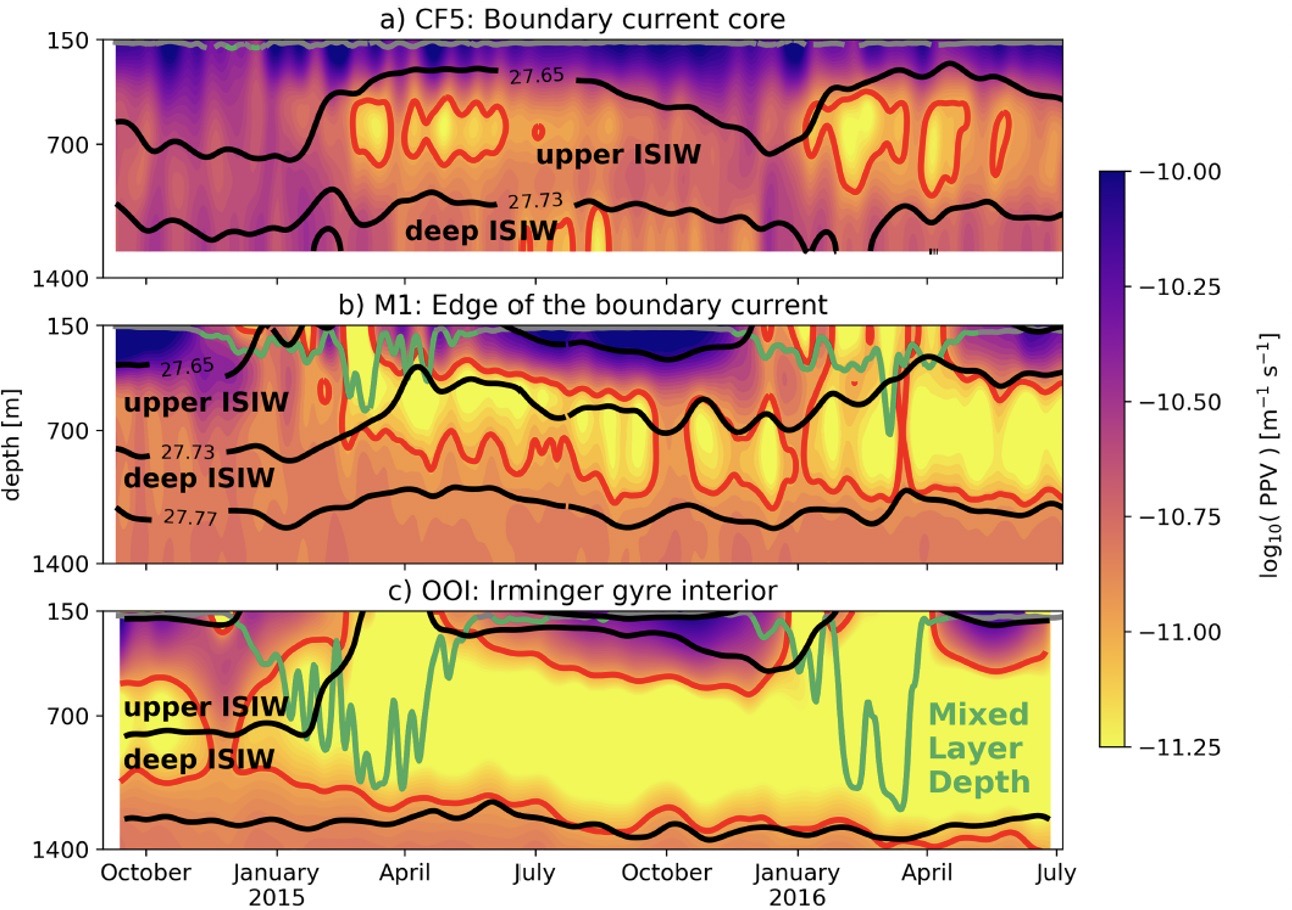
[caption id="attachment_18947" align="aligncenter" width="640"] Figure 19. Planetary potential vorticity (PPV) at (a) OSNAP mooring CF5, within the Irminger Sea boundary current core (b) OSNAP mooring M1, at the edge of the boundary current and (c) OOI flanking mooring (FLMA) and Surface Mooring within the Irminger Sea gyre. From Le Bras et al. (2020).[/caption]
A two-year record from moorings in the Irminger Sea allowed researchers (Le Bras et al., 2020) to investigate both deep convection and transport of water masses associated with the Atlantic overturning circulation. Using mooring data from the OOI Irminger Sea Array and the Overturning in the Subpolar North Atlantic (OSNAP) array, the authors were able to identify two types of Irminger Sea Intermediate Water (ISIW) formed by deep convection. Upper ISIW is found near the edge of the Irminger Sea western boundary current, whereas Deep ISIW is formed in the basin interior. Water masses were diagnosed using temperature-salinity properties and the planetary potential vorticity (PPV). Figure 19 shows PPV for three different locations, in the boundary current, at its edge, and in the Irminger Sea gyre. Black lines in the figure indicate the isopycnals that bound upper and deep ISIW as defined by the authors, the red contours enclose water with low PPV (indicative of convection) and the green lines indicate the mixed layer depth.
Seasonal pulses of low PPV water in the boundary current occurring below the mixed layer (Figure 19a) suggest subduction from a non-local source offshore. In contrast, low PPV water in the gyre interior is accompanied by a deep winter mixed layer and appears related to local convection. Further analysis by the authors indicates that waters formed by convection in the interior gyre are entrained into the boundary current within a few months of formation. Importantly, it appears that eddy dynamics are responsible for this transport of ventilated water from the interior to the boundary, and that the upper ISIW in the boundary current is a significant component of the Atlantic overturning circulation.
Read MoreShedding Light on Wave Energy Harvesting
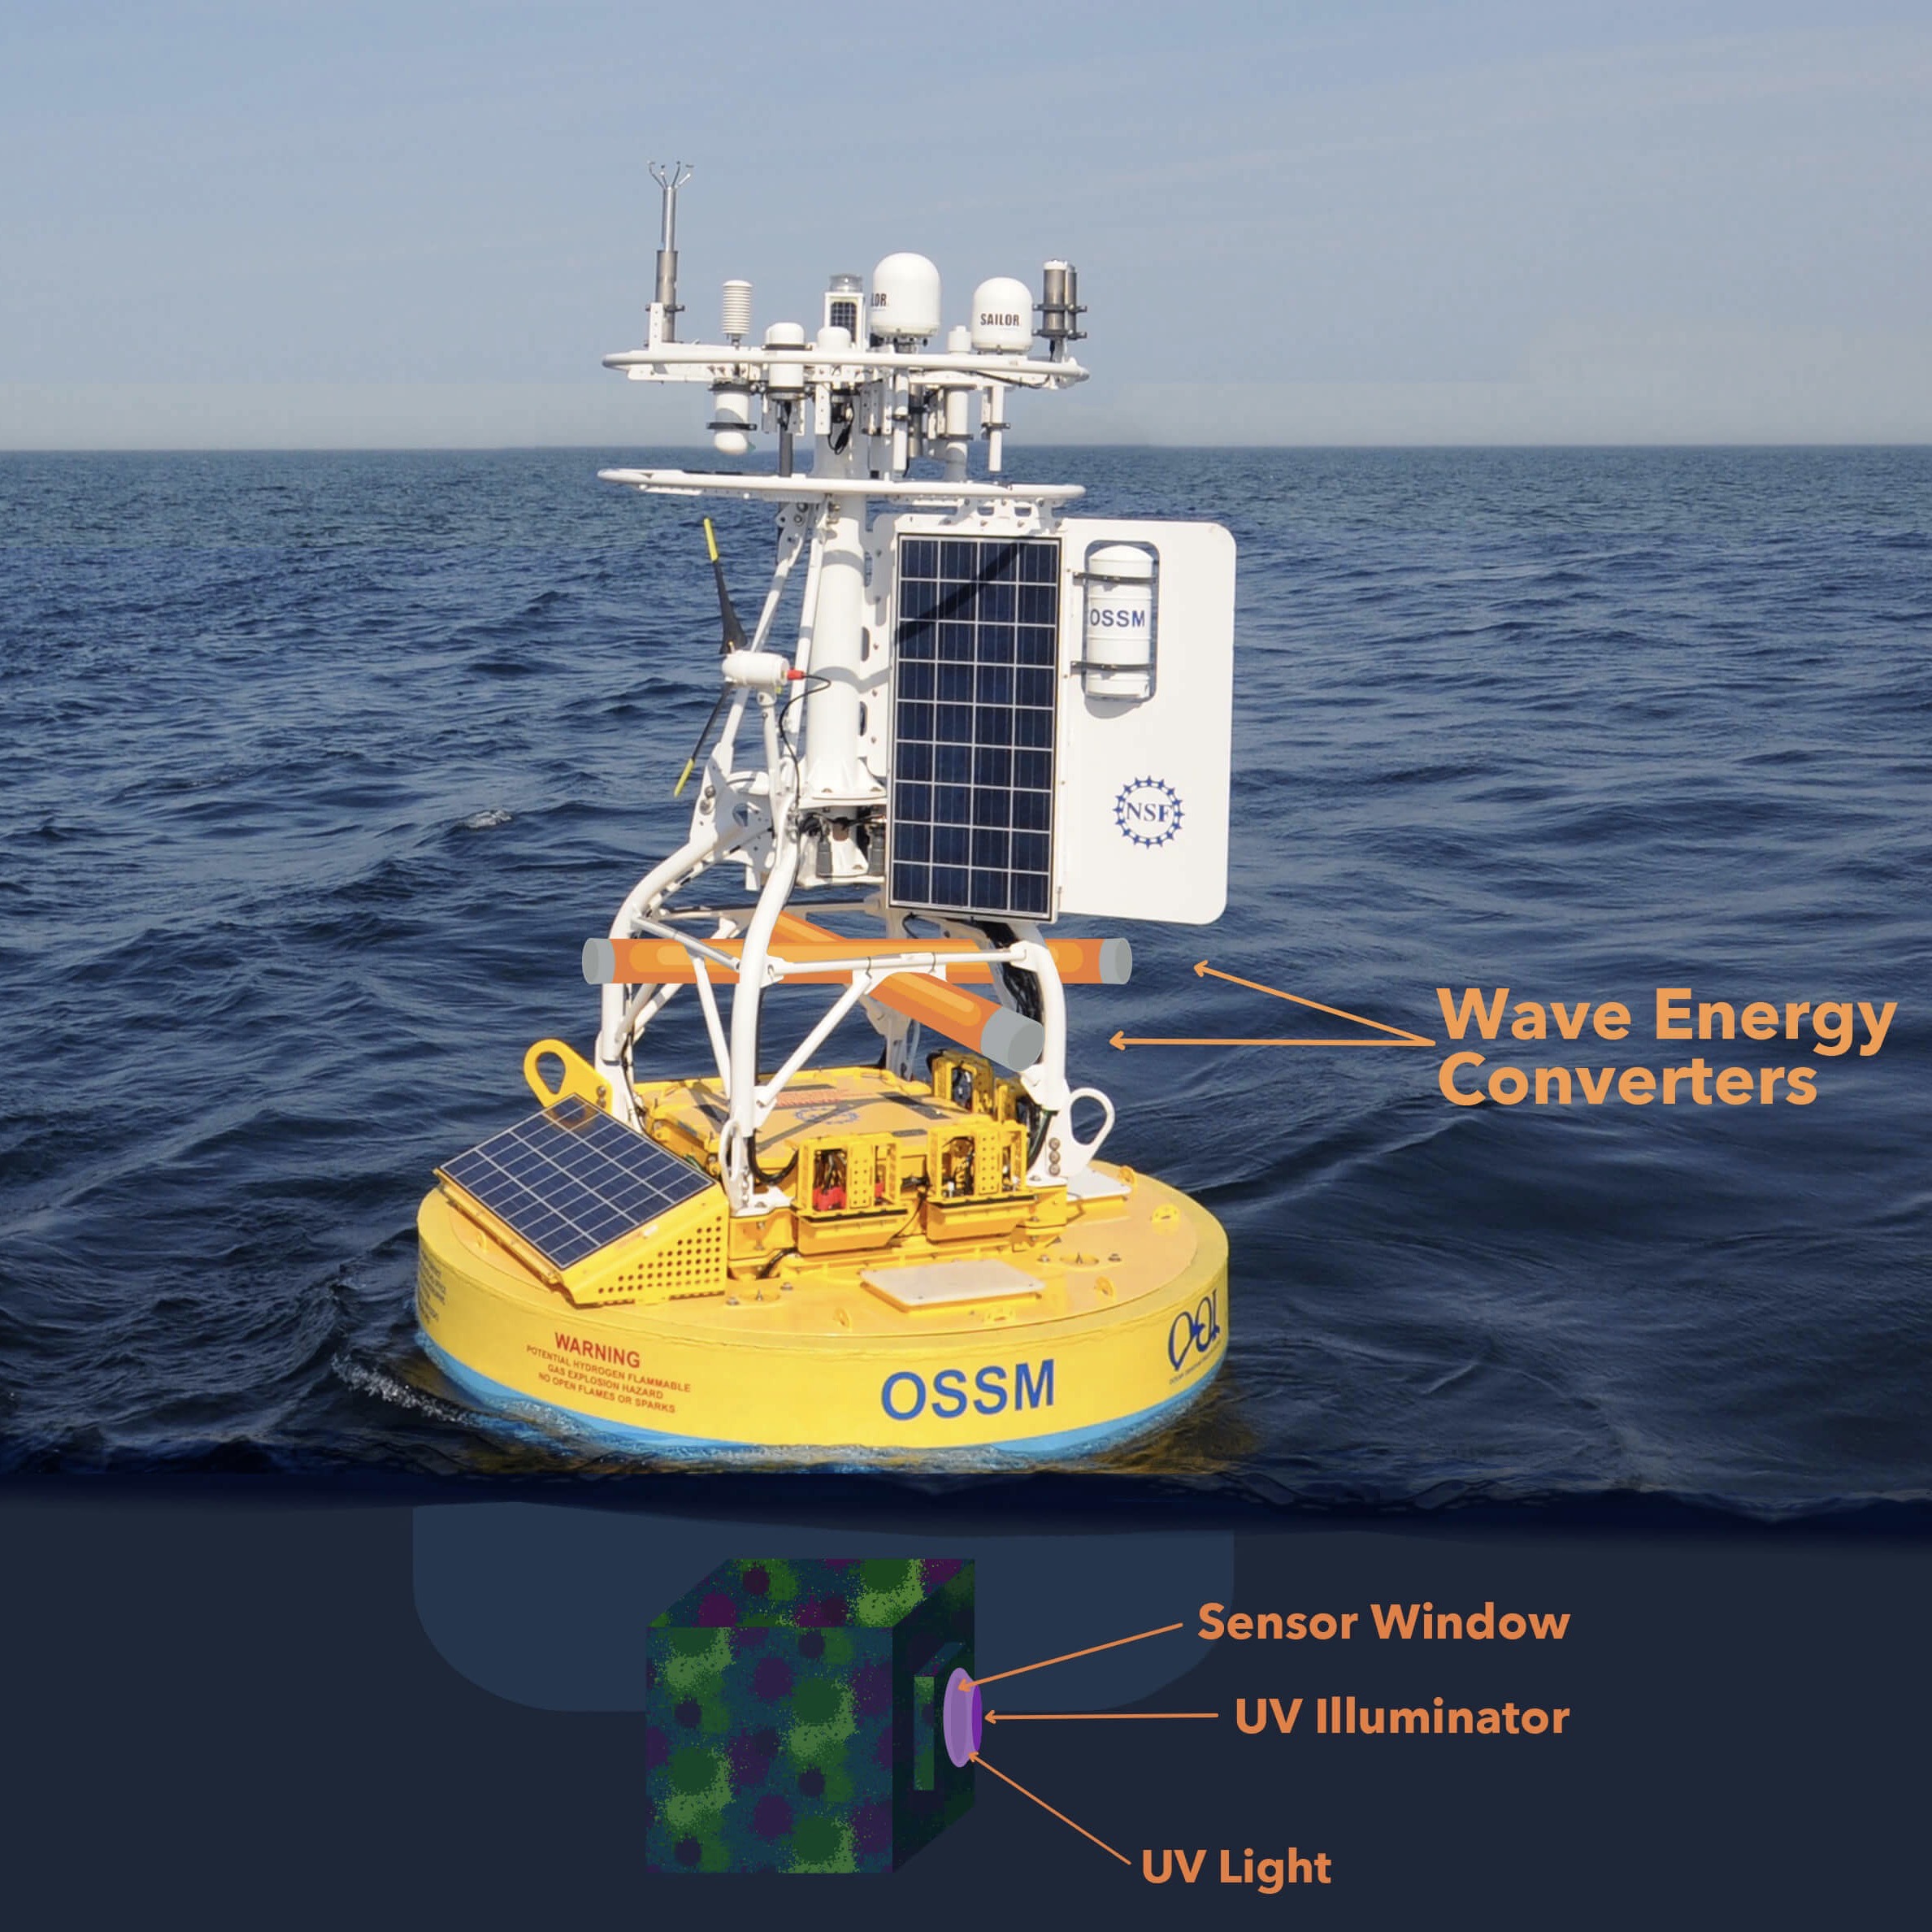
Two entrepreneurs and two engineers recently teamed up to develop a wave-based energy generator with the potential of powering the Pioneer Array, while also providing energy to a new, longer lasting, and potentially more effective way to keep the array’s sensors free and clear.
The Department of Energy thought the idea had such potential that it awarded the team a Small Business Technology Transfer (STTR) grant that will allow them to develop a proof of concept of this system by late March 2021.
The development team consists of grant Co-Investigator Matt Palanza, program engineer for the Ocean Observatories Initiative (OOI) at Woods Hole Oceanographic Institution (WHOI), Megan Carroll, a research engineer at WHOI and expert in the dynamics of moored systems, and Principle Investigator Julie Fouquet and Co-Investigator Milan Minsky, principals of 3newable, LLC, a firm dedicated to the development of small-scale wave energy converters. Fouquet started by developing and testing wave energy converter concepts on land, to choose an efficient, low-cost and flexible approach. Minsky brings to the team extensive experience in developing first-generation ultraviolet LEDs for medical and industrial applications that she will put to good use in designing a system to tackle serious biofouling conditions that plague all equipment put into the ocean for extended periods.
“The concept of harnessing wave energy at the Pioneer Array, then powering an ultraviolet LED anti-fouling light, which could possibly keep the array functioning much longer, would be a win-win. If this combination is proven here, it could have widespread application in oceanographic research and aquaculture applications, with tremendous potential for cost savings,” said Palanza.
Striving for Good Environmental Outcomes
Julie Fouquet founded 3newable LLC in 2015 with the goal of capturing electrical power from water waves as a source of renewable power. Previously, companies wanting to commercialize wave energy generation had failed while attempting to build utility scale systems, which were extremely costly. Years of experience in the semiconductor industry taught Fouquet that product development requires multiple design-build-test-redesign cycles. Companies developing utility-scale systems ran out of money before reaching a viable product. She chose to focus her efforts on developing an efficient and cost-effective small-scale wave energy converter that could fit into the back of an SUV and on a runabout boat.
Having worked together for decades, she and Minsky – now vice president of product at 3newable – teamed up to find out what sort of applications in the oceanographic community could use a small-scale wave energy converter.
After many meetings, they concluded that the Pioneer Array buoys would be a good testing ground. Palanza agreed and the team set out to write a proposal that would capitalize on their collective talents to provide a potential real-world application of wave energy and anti-biofouling technology.
The Pioneer Array buoys are already powered by wind and solar, but the wave energy converter offers a way to keep the sensors clear and recording for longer time periods using UV LED lights, possibly extending trip intervals needed to service the arrays.
Like most things in spring 2020, COVID caused delays in the launch of this project. DOE announced the award in May, but the actual award was delayed until early August, which potentially squeezes the March deadline for producing the feasibility study. From there, the team hopes to move forward to Phase 2, which would involve construction of both the wave energy conversion and UV anti-fouling prototypes and testing in the field.
“We are already working in a distributed way with processes in place so COVID hasn’t impacted our progress in analyzing data and developing lab tests,“ said Minsky. “But the interesting thing about the pandemic is that it has really propelled the UV LED field along as people explore its potential medical uses. Prices are dropping and quality is going up so we will be able to take advantage of these advances as we go about commercializing this module.”
During Phase 1, the team will be striving to answer the following questions:
· How much power is needed to run UV anti-biofouling equipment at the array?
· Can enough power be generated to meet the demand?
· How big of a wave energy converter unit will be needed?
· What are the unit size limitations if attached to the array?
“We all are excited to get this project launched. There’s a real need for improved anti-biofouling technology, and with the emergence of UV LEDs powered by waves onsite, it’s a sound solution with a potentially positive environmental impact, “added Palanza.
Read More
New Data Explorer Tool Coming Online in October
To help make OOI data more accessible, useable, and easily integrated into research and classrooms, the OOI data team has spent the last year developing a new tool that will allow users to discover the data required to meet their needs. The new “Data Explorer” has been undergoing user testing for the past three months and will be ready for broad distribution in early October.
Data Explorer will allow users to search and download cabled, uncabled, and recovered data, compare datasets across regions and disciplines, generate and share custom data views, and download full data sets using ERDDAP.
“We are really excited about the launch of Data Explorer version 1,” explained Jeffrey Glatstein, head of OOI’s cyberinfrastructure, who guided a team of data and visualization experts in developing the tool. “It is an excellent tool that offers a variety of ways for researchers, educators – and others interested in ocean observations—to use OOI data to answer their ocean observation data questions. What we’ve learned over the test period is that additional refinements will be needed, but we first want input from the community, to help identify and prioritize the most important ones. Subsequent versions will build upon this first release to make the Data Explorer the primary tool to explore OOI data.”
Data Explorer contains physical, chemical, geological, and biological ocean observation data collected in near real time. Glatstein and the OOI Data Team worked with Axiom Data Science to develop a system that is both powerful yet user friendly.
Stay tuned. The launch is set for the beginning of October 2020.
Read More
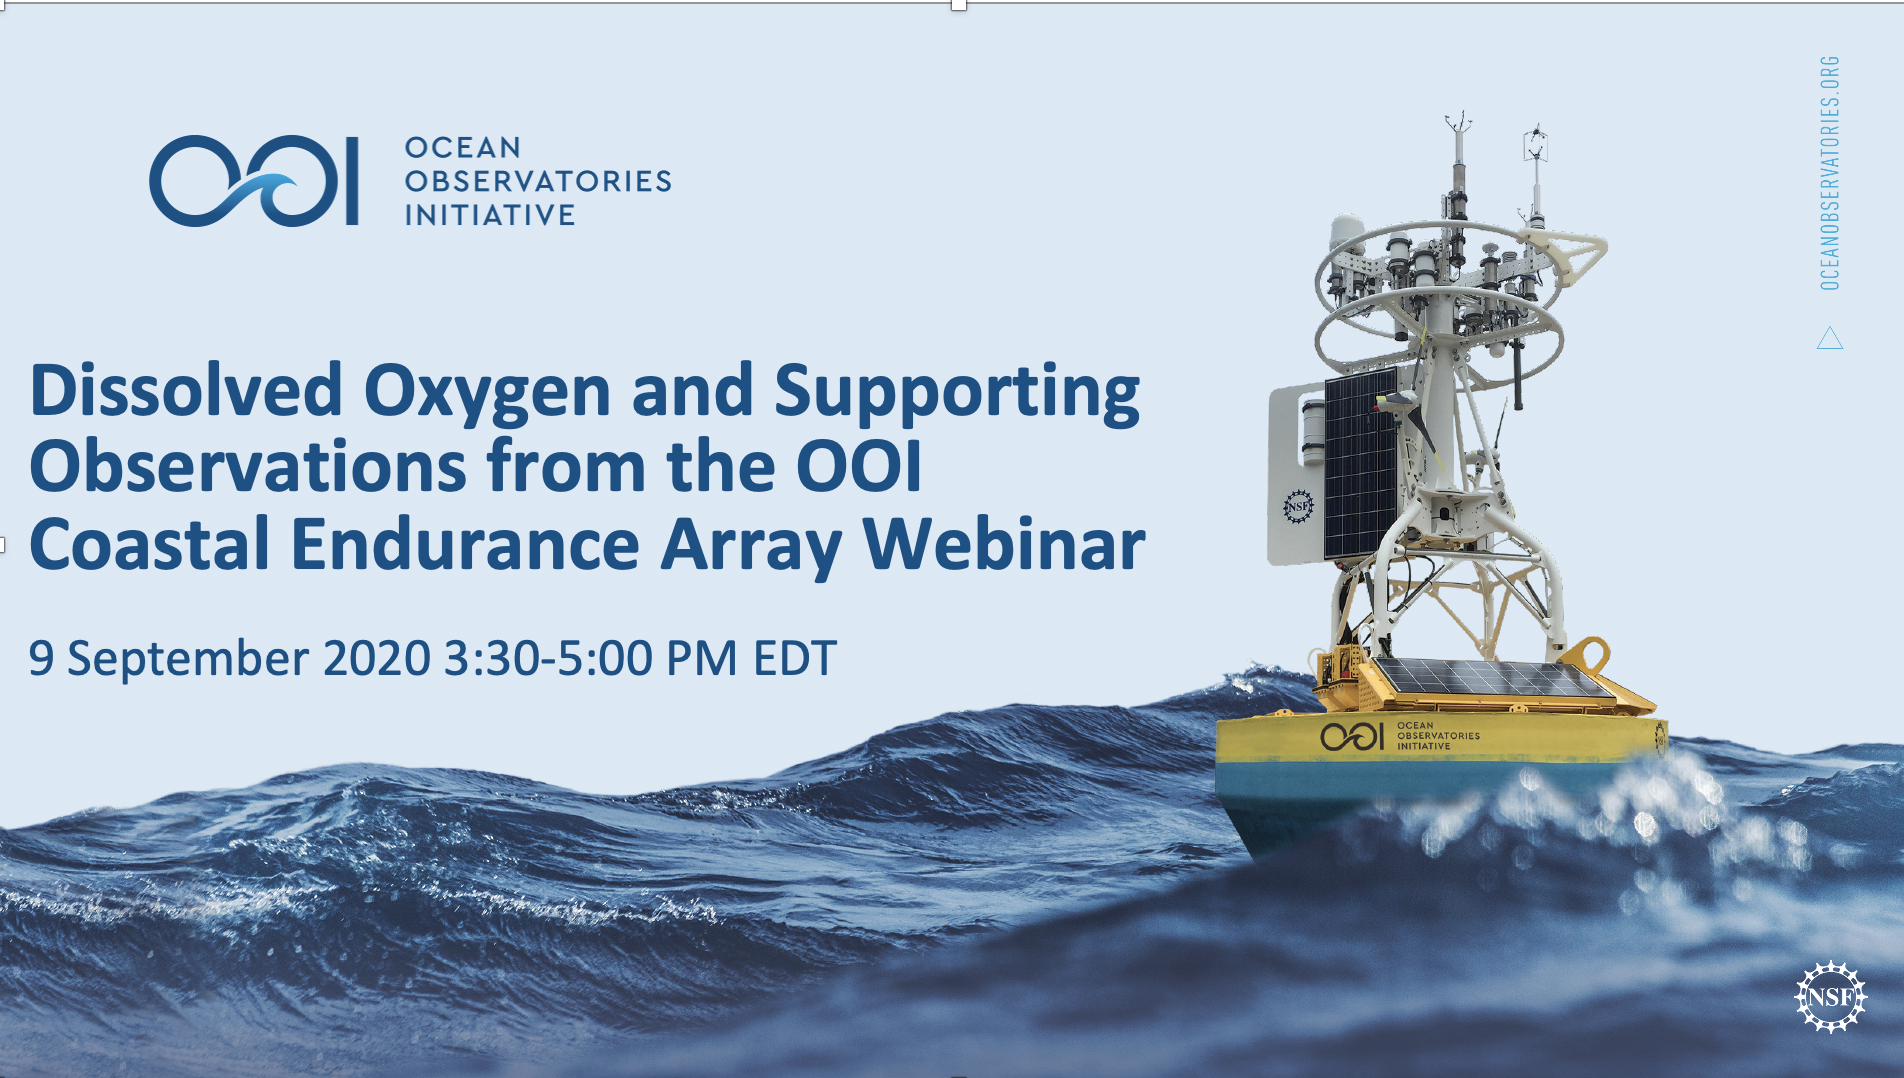
Mark Your Calendar: Dissolved Oxygen Webinar, 9 September 2020

 Coastal Endurance Array webinar presenters: Ed Dever, Chris Wingard, Stuart Pearce, Craig Risien, Jonathan Whitefield, and Jon Fram[/caption]
In this webinar, we present dissolved oxygen (DO) data from the Ocean Observatories Initiative’s (OOI) Coastal Endurance Array off Oregon and Washington. DO is recorded on platforms across OOI. These measurements contribute directly to the OOI science goal of understanding ecosystem changes. The Endurance Array measurements contribute specifically to understanding the seasonal development and synoptic variability of hypoxia. DO measurement platforms on EA include moorings, gliders, and profilers.
The webinar will be presented in four pre-recorded sections with a live Q and A following each section. In part one, we will provide an overview of OOI DO measurements across OOI. The remaining three parts will cover surface mooring time series, glider measurements, and profiler measurements respectively. For each of these platforms, we will describe the sampling, review quality control procedures and issues, and present example plots. We will focus on recent data, including telemetered data collected since the latest Endurance cruise in July 2020. We will present the DO time series, along with related observations of wind velocity and ocean temperature.
Please register in advance for this webinar here. After registering, you will receive a confirmation email containing information about how to join the webinar.
The webinar sections will be posted to oceanobservatories.org. Pre-registered webinar participants can sign up for follow-up discussions on accessing these OOI data on 10 September. Individuals can also contact the OOI HelpDesk and set up similar discussions at a later date.
Read More
Successful Orphaned Equipment Recovery
The Endurance Array team at Oregon State University (OSU) achieved a first in early August. They succeeded in recovering a Coastal Surface Piercing Profiler (CSPP) and its anchor from the Oregon Shelf site with an ROV customized for this endeavor.
The team boarded the 54-foot R/V Elakha, which is owned and operated by Oregon State University on Thursday 5 August, to implement a recovery scheme developed by OSU-OOI technicians Alex Wick and Ian Black.
Wick and Black also created and configured the line pack and other materials needed by the ROV, and led operations on deck. Jeremy Fox, captain of the R/V Oceanus, operated the ROV. The goal was to retrieve the orphaned CSPP from the site.
“This successful mission demonstrates the creativity and determination of the Endurance Array team to retrieve equipment from the seafloor,” said Jonathan Fram, project manager for the Endurance Team Array at OSU. “When we lose a piece of equipment, we do everything in our power to retrieve it not only because of the expense of the equipment and the scientific value of data it contains, but because we are required to recover what we deploy. OSU-OOI has recovered orphaned equipment with ROVs in the past, but the recovery scheme used here was much more effective and efficient.”
The mission is shown in the pictures below:
[media-caption type="image" class="external" path="https://oceanobservatories.org/wp-content/uploads/2020/08/Elakha.jpg" alt="Elakha" link="#"]OSU’s 54″ R/V Elakha, the Chinook trading language word for sea otter, is powered by a single, 600-horsepower diesel engine with a range of about 575 miles. OOI uses it for day trips from Newport to service Oregon Line moorings and gliders.Credit: OSU, College of Earth, Ocean, and Atmospheric Sciences[/media-caption] [media-caption type="image" class="external" path="https://oceanobservatories.org/wp-content/uploads/2020/09/ROVwithLinePack.jpeg" alt="ROV-with-recovery-line" link="#"]ROV with recovery line pack underneath. Credit: Alex Wick, OSU[/media-caption] [media-caption type="image" class="external" path="https://oceanobservatories.org/wp-content/uploads/2020/08/Picture-by-ROV-.jpg" alt="ROV underneath" link="#"] The ROV took this picture of the upside-down anchor. The team initially wasn’t able initially to recover the anchor because the white recovery floats were on bottom, so they didn’t float up when they were released. Here, the ROV arm is holding a hook with a blue line attached to it. Credit: Jeremy Fox, OSU[/media-caption] [media-caption type="image" class="external" path="https://oceanobservatories.org/wp-content/uploads/2020/08/Anchor-hooked.jpg" alt="Anchor attached" link="#"]This is a close-up of the anchor with the recovery line successfully attached. With the anchor secured, the team recovered the ROV, detached the blue line from the line pack bag, and then winched up the anchor and attached profiler. Credit: Jeremy Fox, OSU [/media-caption] [media-caption type="image" class="external" path="https://oceanobservatories.org/wp-content/uploads/2020/09/onTheWayHome-scaled.jpg" alt="Ian at stern" link="#"]Ian Black sits on the deck of the R/V Elakha after a successful mission to recover an orphaned CSPP and anchor. Credit: Jeremy Fox, OSU [/media-caption] Read MoreEvent and Seasonal Scale Variability of Surface Heat and Momentum Fluxes
Excerpted from the OOI Quarterly Report, 2020.
Endurance Array: Event and Seasonal Scale Variability of Surface Heat and Momentum Fluxes off Oregon and Washington
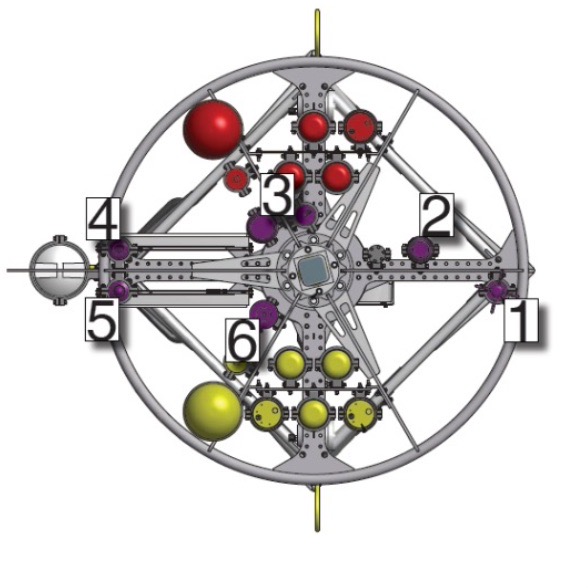
As part of the NSF-funded Ocean Observatories Initiative (OOI) Coastal and Global Scale Arrays, surface buoy meteorological measurements are made using the Air-Sea Interaction Meteorology (ASIMET) package (Figure 20). These measurements are reported on in Dever, E.P, J.P. Fram, C.M. Risien, R.A. Desiderio, C.E. Wingard (2020), Event and Seasonal Scale Variability of Surface Heat and Momentum Fluxes off Oregon and Washington, Abstract [A144A-2411] presented at Ocean Sciences Meeting 2020, San Diego, CA, 17-21 Feb. Radiative and bulk surface fluxes calculated from these measurements are provided as OOI data products. Both the measurements and the estimated fluxes are available through the OOI Data Portal as are all the metadata required to produce these fluxes (raw data, calibration coefficients, data product specifications, data product algorithms etc.).
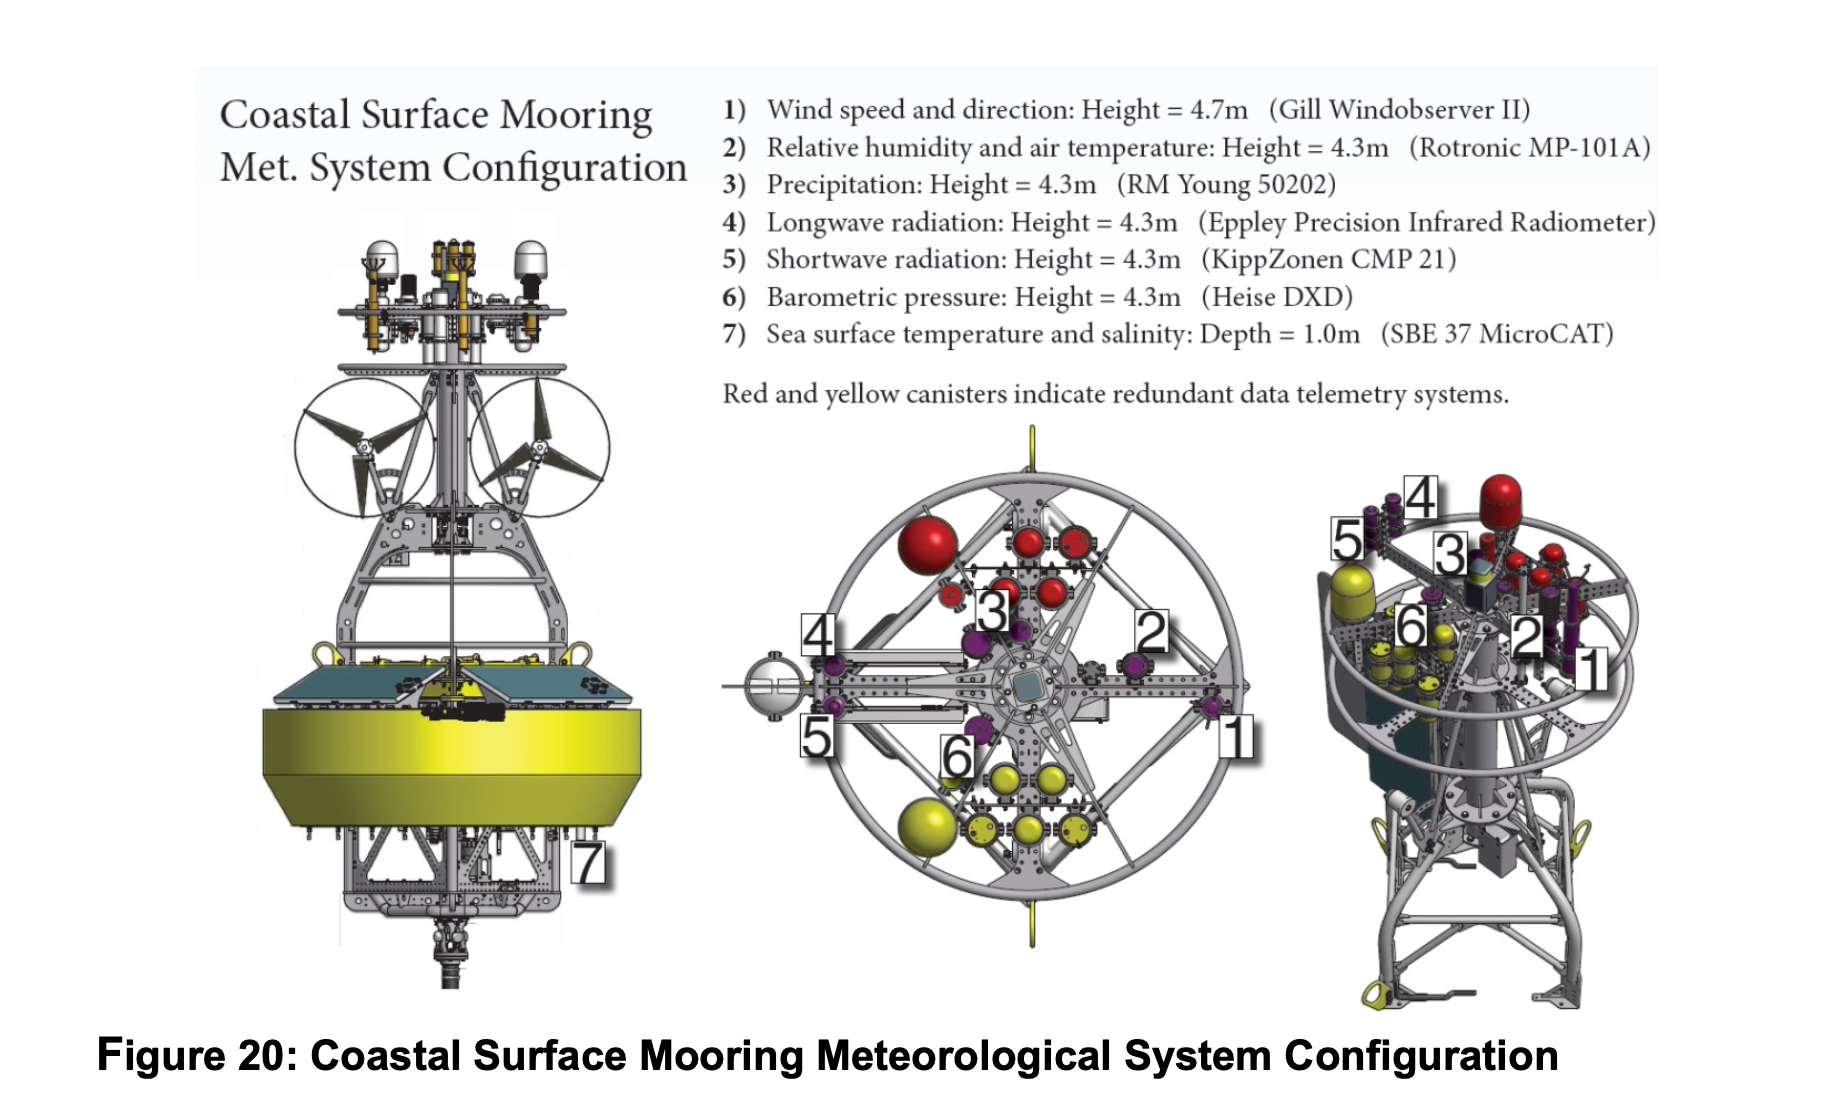
On the Endurance Array, ASIMET measurements are made at four locations over the Oregon and Washington shelf and slope. These locations lie within the northern California Current Marine Ecosystem. Here upwelling favorable wind forcing and atmospheric conditions occur in spring and summer months with forcing in other months driven by passing low pressure systems. The timing of both the spring transition to upwelling and the fall transition to storm forcing varies from year to year as does the strength of individual events within each season. Upwelling events are associated with strong net shortwave and latent heat fluxes. Storm events are associated with weak net shortwave fluxes and latent fluxes that vary in strength.
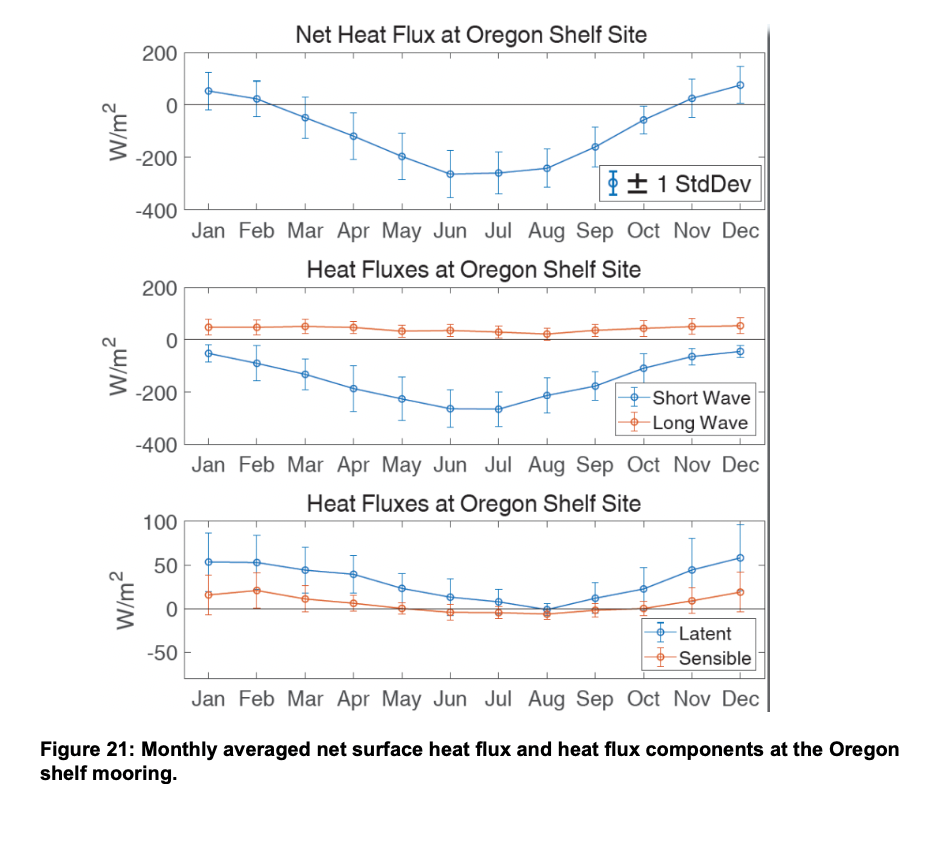
Machine to machine (M2M) calls were used to read in hourly bulk surface fluxes from OOI Endurance Array moorings from their initial deployments in April 2015 through February 2020. OOI data product fluxes are calculated with TOGA-COARE and other community standard algorithms. Monthly averages of OOI Endurance Array flux data compare well with one another. Both the Oregon and Washington shelves are subject to heating on an annually averaged basis. The Oregon Shelf mooring (Figure 21) is typical. Late fall and winter show net fluxes from the ocean to the atmosphere. All other months show heat flux into the ocean due to insolation.
Read More