
News
Live Video from Regional Cabled Array Expedition
For the month of August, you can be a scientist aboard the R/V Thomas G. Thompson Regional Cabled Array expedition and explore the ocean floor and biologically-rich waters of the northeastern Pacific Ocean in real-time. A livestream is being broadcast of onboard activities and from the ROV, as it recovers and deploys instrumentation to maintain the Regional Cabled Array. Bookmark this livestream link and during August you can experience life and science at sea.
Please note: The livestream video is transmitted from the ship to a satellite, then to shore. Occasionally, the land-based down-link system goes down and depending on the ship’s heading, there may be an intermittent pause in the satellite connection. If the screen is blank or you see an error code, please check back soon as the connection should refresh shortly.
Read More
Science Team Heads to Blustery Irminger Sea
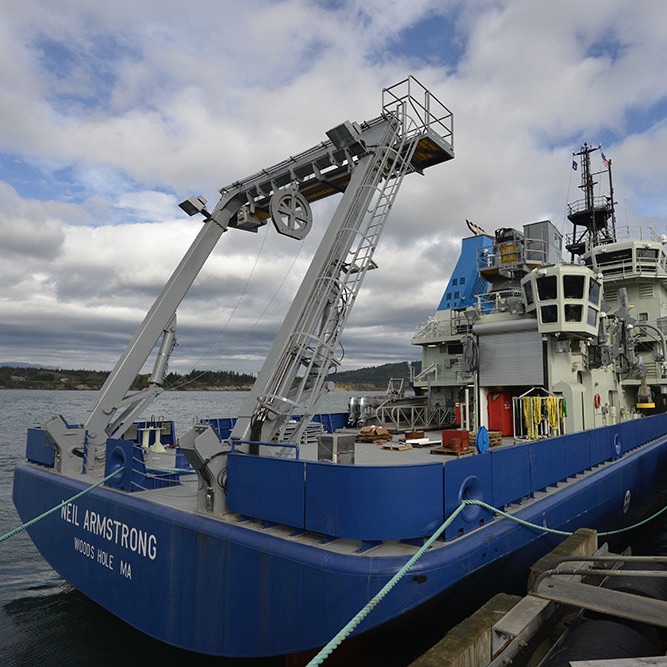
Ten scientists from Woods Hole Oceanographic Institution (WHOI) will board the R/V Neil Armstrong on 8 August 2020 for about a month-long expedition to OOI’s Irminger Sea Array. The journey includes an eight-day transit to reach the array, where they will recover and replace ocean observing equipment that has ridden out arduous conditions in a region known for intense winter wind events (peak speeds of 50-55 knots).
[media-caption path ="https://oceanobservatories.org/wp-content/uploads/2020/08/Irminger-Deck-Plan-small-scaled.jpg" link="#" title="Iminger Deck] Aerial view of the R/VNeil Armstrong deck with equipment loaded for an OOI Irminger Sea Array service cruise. Credit: Drone footage by James Kuo © Woods Hole Oceanographic Institution[/media-caption]Iceland is separated from the east coast of Greenland by the Denmark Strait, roughly a distance of some 250 miles. The Irminger Sea is south of the strait, stretching from Iceland down to the latitude of Cape Farewell at Greenland’s southern tip. This region is important to the Atlantic Ocean circulation and sensitive to global climate change.
Supported by wind power and solar cells, the Irminger Sea Array consists of moorings that serve as home for sensors that measure air-sea fluxes of heat, moisture and momentum, and physical, biological and chemical properties throughout the water column. The observations of the moorings are enhanced by open-ocean gliders that sample within and around the triangular array. The subsurface mooring data is also collected by the gliders via acoustic modem. The gliders then relay the collected data, glider sampling and mooring data, to shore via satellite telemetry each time they surface. Gliders also sample the upper water column near the Apex Profiler Mooring to complement the moored profiler data and extend coverage to the air-sea interface.
This month-long expedition is the seventh time the OOI team has traveled to the array, specifically to replace and repair equipment that is vital to maintaining a continuous flow of data from this important site.
“This is a difficult region to sustain surface observations, yet such observations are critical to improving our understanding of air-sea exchanges and deep convection that drives the Atlantic overturning circulation” said Al Plueddemann, project scientist for the OOI Coastal and Global Scale Nodes (CGSN).
WHOI Research Scientist Sebastien Bigorre will serve as the chief scientist for the expedition.
COVID Complications
The scientific party went into a 14-day quarantine on 21 July to ensure that everyone could safely board the ship. They were tested for COVID-19 prior to quarantine and will be tested again prior to departure. Masks and social distancing will be practiced onboard until another two-week period of health is achieved. At that point, mask wearing may be loosened as the scientific team and crew members will, in effect, be their own social bubble as they live, work, and share the space of the 238 foot-long vessel.
[media-caption path="https://oceanobservatories.org/wp-content/uploads/2020/08/DSC_0016_allison-scaled.jpeg" link="#" title="crew deploys a near surface instrument frame to the array"]During a past expedition to the Irminger Sea Array, the crew deploys a near surface instrument frame to the array. Credit: Alison Heater © Woods Hole Oceanographic Institution[/media-caption]Explained Derek Buffitt, program manager for the Coastal and Global Scale Nodes, operated from Woods Hole Oceanographic Institution, which includes oversight of the Irminger Sea Array, “COVID-19 created plenty of new logistical challenges for an expedition of this length and distance. We had to address contingencies such as what to do if someone presented COVID symptoms while at sea. WHOI’s marine operations office, working with agents and government representatives, confirmed health and safety protocols within the foreign ports along the planned vessel track. This was to ensure our personnel could receive the care needed in an emergency and in a timely manner.”
Such contingencies were necessary steps, in addition to many months of preparation, to ensure the equipment to be deployed is ready, tested, and packaged for transporting to the ship.
Watch this space, and social media, as we follow along on this important expedition.
Read MoreRCA Embarks on a Month of Discovery in August
The University of Washington (UW) Regional Cabled Array (RCA) team entered a two-week quarantine period on 16 July before heading out to sea August 1, aboard the UW global class research ship the R/V Thomas G. Thompson for a month-long expedition in the northeastern Pacific. The expedition is funded by the National Science Foundation as part of the Ocean Observatories Initiative. The team will need whatever rest they can muster during the quarantine, as the expedition promises to be replete with round-the-clock activity, including multiple dives a day by the remotely operated vehicle (ROV) Jason.
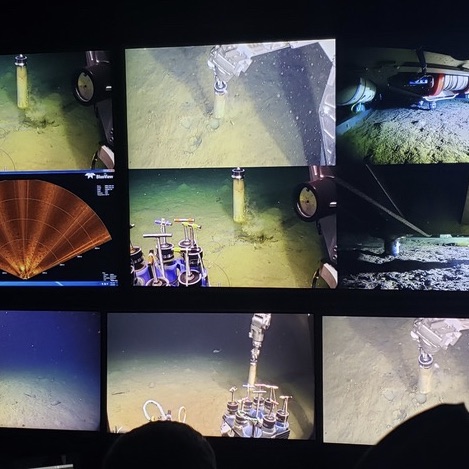
During this expedition, the team will recover and reinstall more than 200 instruments with the ROV, while broadcasting livestream video from the ROV Jason to the ship, to a satellite over 22,000 miles above the Earth. From space, the video will then be transmitted to the UW, where it will be publicly available on the UW InteractiveOceans website. A daily blog will provide updates on the expeditions progress. Throughout the month, viewers will witness life thriving at depths 2900 m (>9500 ft) beneath the ocean surface and at Axial Seamount, the most active submarine volcano off the coast of Oregon and Washington.
[media-caption type="image" path="https://oceanobservatories.org/wp-content/uploads/2020/07/Control-room-_Jason_Hell_-Vent-scaled.jpg" link="#"] An example of some of the stunning imagery that will be live-streamed during the RCA expedition. Credit: Ramya Ravichandran Asha, UW, V19.[/media-caption]The RCA consists of 900 kilometers of cable that provide high-power, bandwidth, and two-way communication to 150 scientific instruments on the seafloor and to state-of-the art instrumented moorings that relay a constant stream of real-time ocean data to shore, 24 hours 365 days a year. All data are freely available to the community.
Being in corrosive saltwater for a 12-month stint is a hostile environment for equipment, so every summer a team of UW scientists and engineers head out to the array to recover equipment and deploy replacement ocean observing instrumentation These recovery and redeployment missions ensure that data continuously flow to shore from this Internet-connected array. At the RCA, cabled instruments are located across the Cascadia Margin, the Southern Hydrate Ridge, and at Axial seamount, each making an important contribution to better understanding the subseafloor environment. Cascadia Margin is one of the most biologically productive areas in the global ocean. Explosions of methane-rich bubbles issuing from beneath the seafloor rise > 1000 feet into the overlying water column at Southern Hydrate Ridge. Axial seamount has erupted in 1998, 2011, and 2015 and hosts some of the most extreme environments on Earth—underwater hot springs venting fluids at >700°C.
Dr. Orest Kawka, an RCA Senior Research Scientist, and Brendan Philip from the UW will sail as Chief Scientists – directing the cruise during the four weeks at sea. As an undergraduate, Philip sailed on numerous RCA cruises as part of the UW educational VISIONS at sea experiential learning program, which has taken over 160 undergraduate students to sea, and later as a member of the RCA team. He is now pursuing a master’s degree in Technology, Science, and Policy at George Washington University in Washington, DC.
Because of the large amount of gear (over 80,000 pounds of equipment) to load onto the fantail of the Thompson for deployment, the cruise will consist of two legs.
[media-caption type="image" path="https://oceanobservatories.org/wp-content/uploads/2020/07/RCA-Jason-manipulator-with-sea-anemones.jpg" link="#"]The manipulator arm of the ROV Jason operates in front of an anemone-covered junction box in the highly productive waters at the Oregon Shelf site. Credit: UW/OOI-NSF/WHOI, V19.[/media-caption]During more than 30 Jason missions to the deep, viewers will witness parts of the ocean rarely seen by humans. The team hopes to revisit some of the scientific highlights of last year’s expedition. One such highlight was Jason being investigated by a swarm of large sable fish. At another site at 80 meters, a junction box became an island completely encrusted in beautiful sea anemones. At Southern Hydrate Ridge, the team saw rarely seen exposed methane hydrate and a moonscape topography dramatically changed from the year before, marked by new explosion pits and collapsed areas. And, on many past expeditions, team members have seen a novel prehistoric-looking fish, which was first filmed in the ocean on the 2014 RCA cruise at the Slope Base site at a depth of 9500 ft. The RCA team fondly refers to this creature as “the weird fish,” (Genioliparis ferox), which also has been documented off Antarctica.
“We’ve got a fantastic team sailing this year, who have been putting in an incredible amount of work for months to get us ready. But like all cruises sailing this year, we’re dealing with the necessary challenge of having a smaller science party and still making sure we can safely accomplish the science and recovery and deployments. We will be in constant communication with the rest of the team back on shore, who will contribute as much to getting our work done as will the science party on the ship. The RCA team is grateful for the opportunity to sail during what has turned out to be a challenging year for ocean science and we’re looking forward to helping other oceanographers continue their research, even if they’re unable to sail this year,” said Chief Scientist Brendan Philip.
[media-caption type="image" path="https://oceanobservatories.org/wp-content/uploads/2020/07/FACT_Cage-scaled.jpg" link="#"]Manipulators on the ROV Jason work on a small frame located ~ 200 m beneath the oceans’s surface, which is encrusted in beautiful feathery creatures called crinoids. Credit: UW/NSF-OOI/WHOI[/media-caption]The Daily Grind
The daily schedule aboard the R/V Thompson promises to be intense, exacerbated by a smaller than normal scientific party due to COVID-19 precautions. “Science teams, when using Jason, tend to keep the vehicle down for a long time, but because the tempo of this cruise is more like an industry cruise, the team will be diving and recovering the vehicle as rapidly as safely possible, sometimes with only a couple hours on deck between dives. It can be exhausting work, particularly for a team that will be onboard for a month,” explained Deb Kelley, RCA Director and principal investigator. “But, being out at sea, seeing the sites and miles of ocean reaching the horizon, and working on this state-of-the-art marine facility makes it all worthwhile.” This year, for the first time, Kelley will be intently observing operations from onshore through the live video stream.
COVID Prevention
A reality in the new COVID-19 world is that the team can only mobilize gear onboard the ship after completing a strict quarantine period. Two weeks prior to boarding, members of the scientific party have lived in their homes (with all family members in quarantine for the duration), hotels or Airbnbs. Team members were tested for COVID prior to entering quarantine and conducted twice day temperature checks during their quarantine. Testing occurred again before being allowed to board the Thompson.
This expedition is novel in another way as a result of COVID precautions. Only two students will be onboard. Prior cruises have had 8-10 VISIONS students on each leg to help out and experience firsthand what it’s like to go to sea. “We are hoping that many students and others tune in to experience this amazing environment that Jason will be revealing over the next month. It’s really an opportunity to visit some of the most extreme environments on Earth and see incredible life forms that has adapted to these harsh environments, which may be particularly uplifting to our spirits now that many folks are stuck at home,” said Kelley.
Livestreaming video will be available here and at InteractiveOceans.
Read MoreOpportunity to Test OOI Data Lab Notebooks

The OOI Ocean Data Labs team is looking for instructors of introductory oceanography courses to “test drive” a collection of new online laboratories that focus on important oceanographic themes and topics using OOI data.
They are seeking a pilot implementation team of 14-16 faculty to implement two labs with students this Fall. They are offering a $750 stipend, which includes a training webinar, detailed feedback and evaluation, and a wrap-up session. The implementation must be completed by December 2020.
Beginning in January 2020, a team of faculty contributors compiled a sequence of OOI Data Labs into an online laboratory manual. It includes topics in biological, chemical, physical and geological oceanography for use in typical Introductory Oceanography courses. The manual is a collection of eight lab exercises, with built-in assessments, and accompanying instructor guides.
Applications are due Sunday 9 August 2020. Apply here.
Read MoreEight Weeks of Intensive Virtual Learning
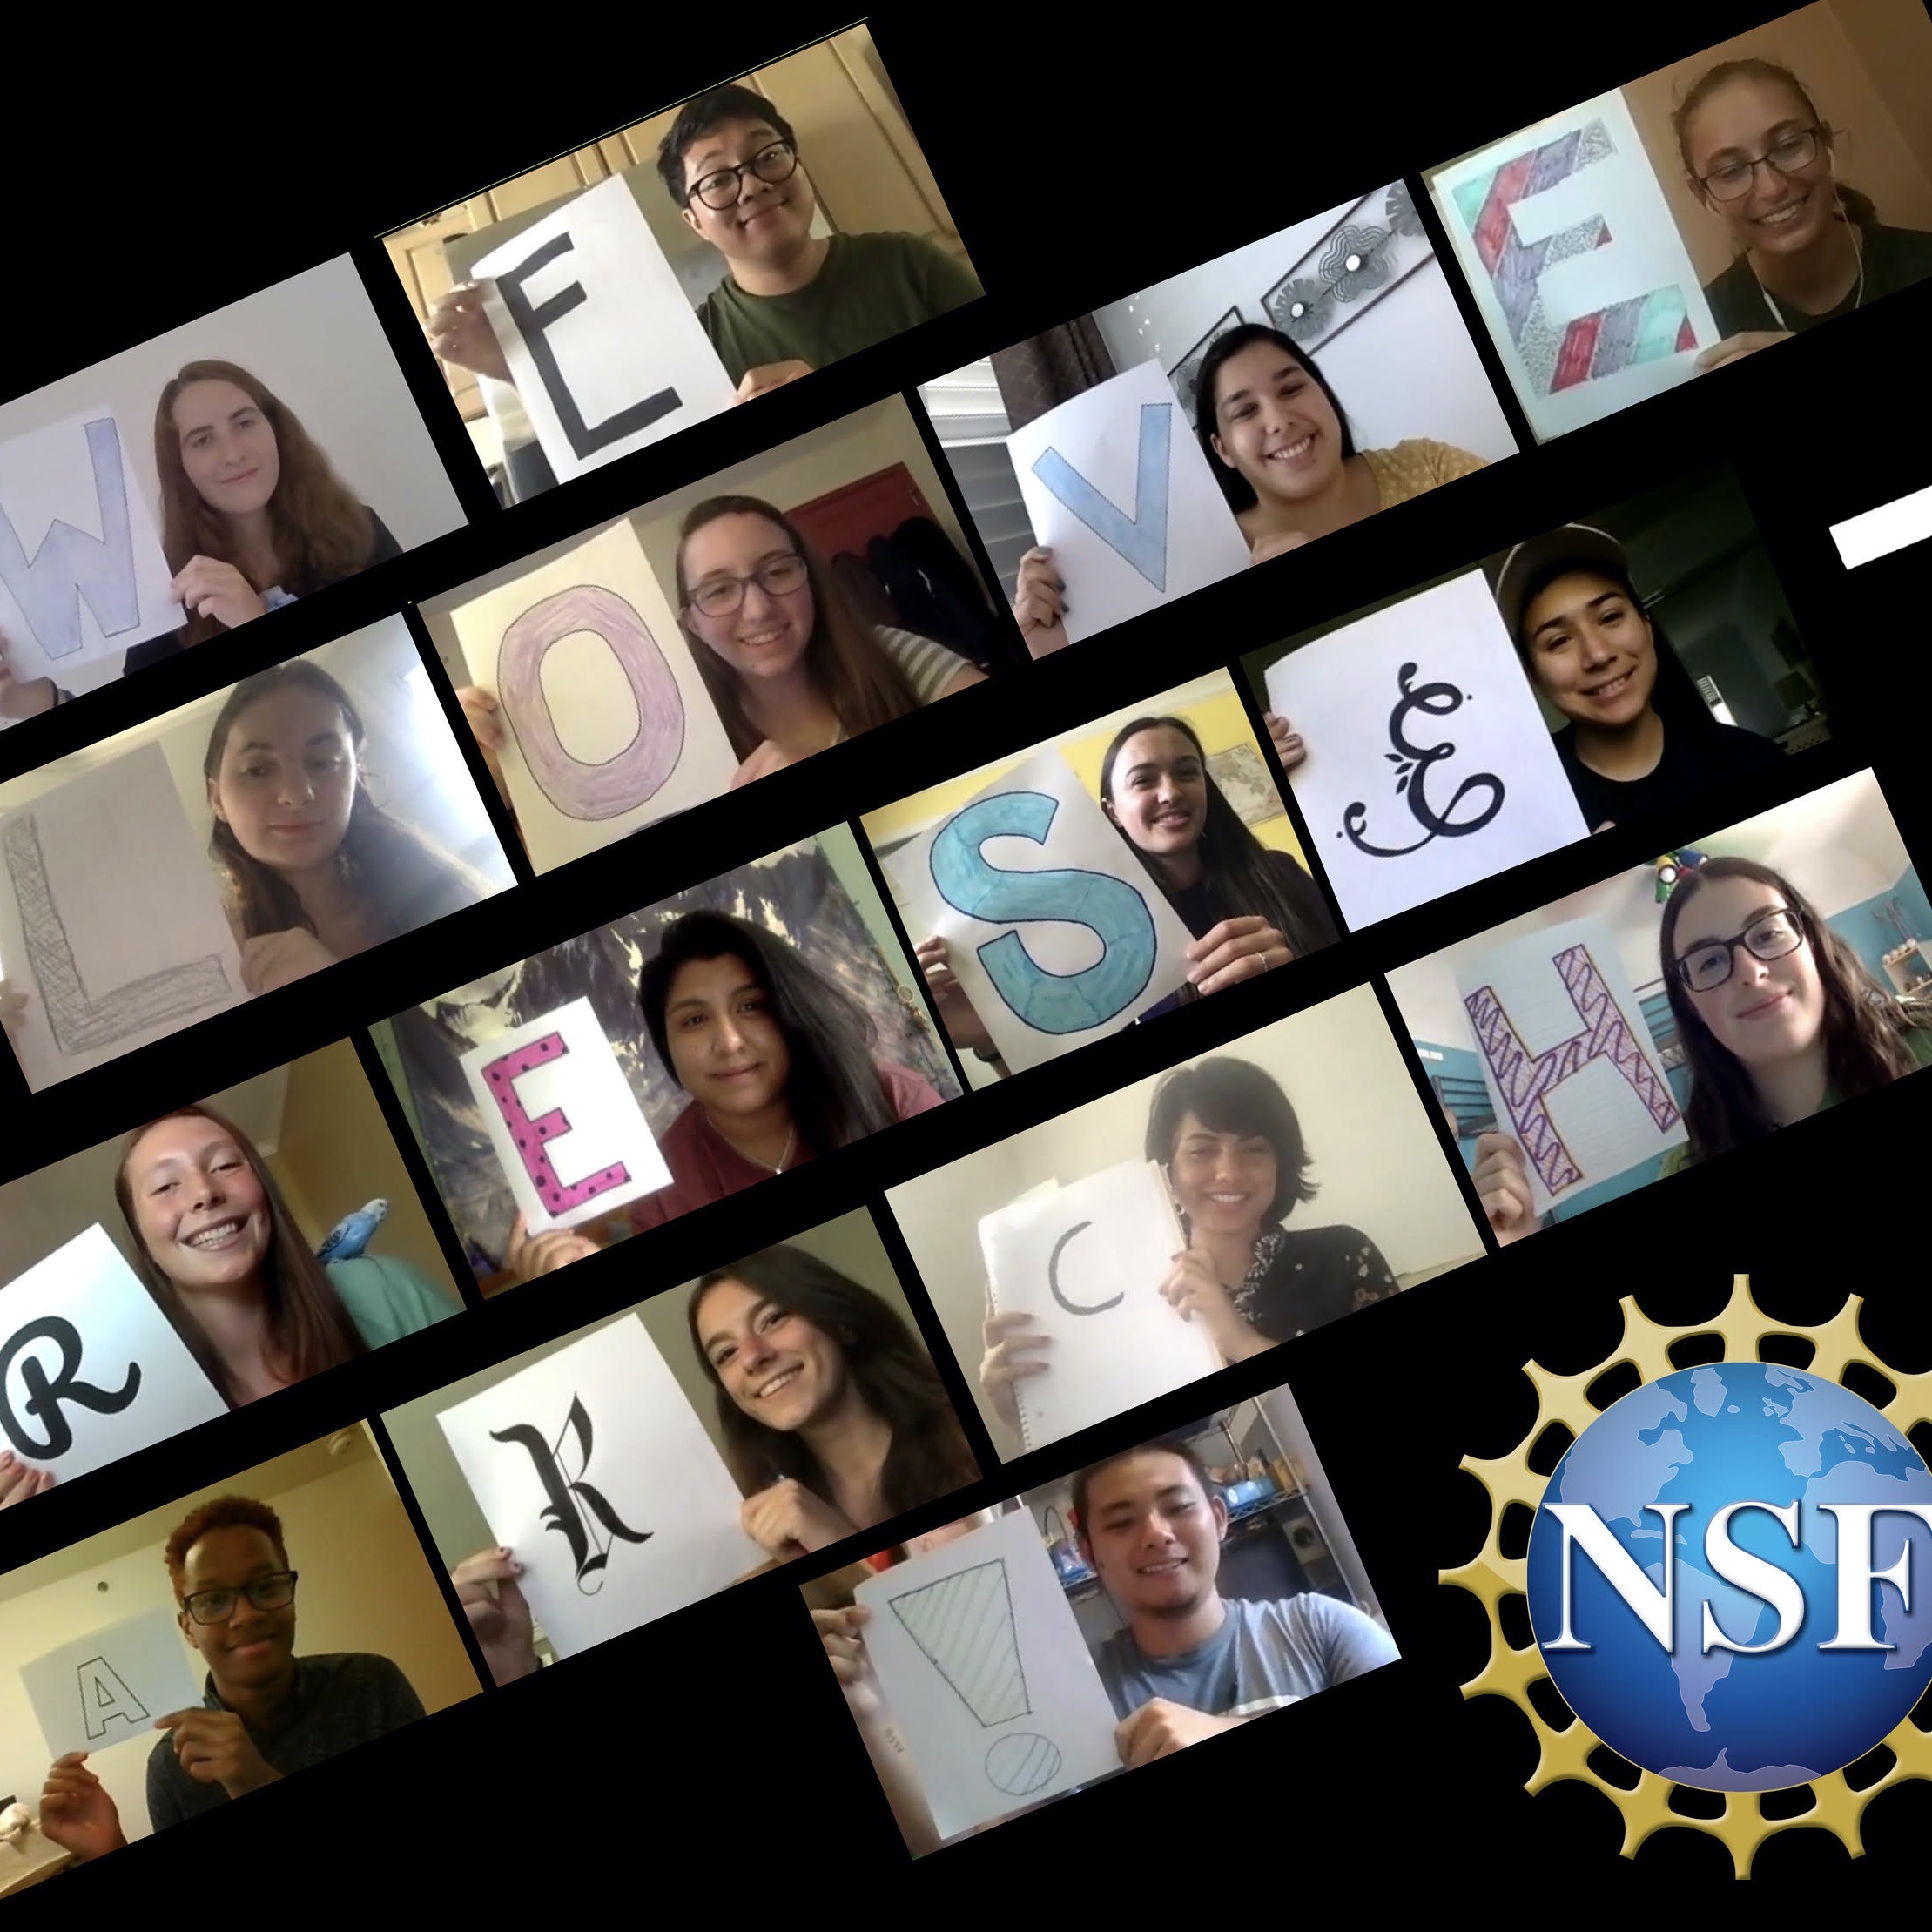
Two weeks. That is the amount of time Janice McDonnell and Sage Lichtenwalner, Co-PIs of the OOI Ocean Data Lab Project, had to create an eight-week intensive, hands-on virtual program for Research Experience for Undergraduates (REU) students, who couldn’t attend their original programs due to COVID-19 restrictions. McDonnell and Lichtenwalner jumped in with both feet and successfully pulled together a program for 16 undergrads from 16 institutions that will wrap up on July 31st. Not only did they have to develop a curriculum in short order, they recruited 17 mentors, who provided one-on-one mentoring for each of the REU students.
In 14 days, McDonnell and Lichtenwalner, working with colleagues at the Rutgers RIOS REU, developed a curriculum, which included two two-hour workshop sessions on Zoom every day for the first two weeks. The workshop was followed by six weeks where students focused on a research project using oceanographic data to answer a scientific question. They were helped by REU leaders and mentors along the way.
The initial workshop focused on students using a “baby data set” before working on something as complex as an OOI dataset or other similarly large dataset. “Initially, we gave them mini research projects that could be done in two weeks. This allowed the students to be collaborative and interactive, while learning Python as a tool using data to answer questions about the ocean,” explained McDonnell.
The key to the program’s success was keeping it engaging. The curriculum mixed up content, approach, and activities to ensure students stay involved on and off the screen. The team used a tactical approach – starting where students are and building upon their level of understanding. They incorporated a lot of different approaches, including think-pair-shares and an activity from the Right Question Institute, another NSF-funded project, which guides people to ask better research questions.
“We were constantly looking for opportunities to be interactive, reflective, and to give students the opportunity to apply their knowledge,” added McDonnell.
Another technique used were Zoom breakout groups to supplement group interaction. These breakout sessions provided students with opportunities to work together, with mentors, and to get to know each other.
Breakout sessions were also used to meet members of a career panel in virtual personalized sessions.“The career panel for this REU cohort was much more diverse than it is typically. The virtual nature of the interaction made it possible for people from all over the country to join in and participate,” said Lichtenwalner. “We facilitated it in a nice round robin sort of way using Zoom’s breakout function. Students chose their top choices, then met with them either individually or with another student. This gave them an incredible opportunity to meet people in careers that they might not otherwise have access to.”
“I’m really proud of our REU,” said McDonnell. “It’s not easy to teach online but good learning can, and does, happen online and we were able to do that. And the collaboration that took place was really the secret sauce for making this all work. NSF program officer Lisa Rom and Science Assistant Rennie Meyers were committed to and worked really hard to find a solution to make the REU program happen in the middle of a pandemic. The students were great and so excited about the opportunity that we put together for them. And, the mentors went above and beyond the call of duty to help make this program work for the students.”
Each week, for example, one mentor, Dr. Jessica Carriere-Garwood, of Rutgers University introduced her students to people in her professional circle at lunch time each week, with the opportunity to talk about what the students are doing and their interests. “That doesn’t always happen in a regular REU. There are a lot of pluses and minuses of being virtual and this was certainly one of the pluses,” added McDonnell.
Ed Dever, one of the mentors from Oregon State University, had this to say about his mentoring experience: “Janice and Sage did a remarkable job spinning this REU up on short notice. They mentored not just the students, but the mentors (well, at least this mentor!). Janice, Sage, and Christine Bean did an amazing job of building a virtual community of students and mentors on the fly. This virtual community provided a unique experience to the students in that the community was much broader than an in-person REU at a single institution. It took all of us out of our comfort zones and helped us grow. Throughout the whole process, Sage patiently guided REU students in technical aspects of using Python to access and analyze data.”
The REU cohort will finish their research projects and present on 30-31 July. Of the 16 students, eight are using data from the OOI.
Citing the success of this first virtual REU, the team’s National Science Foundation (NSF) program officer Rom pondered “Why don’t we do this all the time, even if there isn’t a pandemic?“
Based on the successful experience this summer, NSF’s Division of Ocean Sciences is encouraging REU proposals for virtual REU’s, and especially those that use OOI data. The deadline is August 26th this year. Apply here.
Read MoreEndurance Array 13 Expedition: Clear Skies, Smooth Operations
The Endurance Array 13 Team had remarkably fair weather, blue skies, and pleasant sailing conditions during their 13-day expedition to recover and deploy equipment at the Array in the northeast Pacific Ocean. The weather was remarkable in that the team is usually in the northern Pacific during the spring and the fall, when the seas are not so forgiving and even in summer strong northerly winds can restrict operations. Because of COVID-19 restrictions this year, the Endurance Array spring and fall cruises were combined into this July cruise.
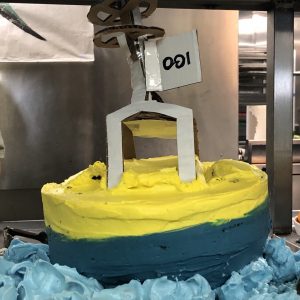
[caption id="attachment_16435" align="alignright" width="300"]
Cake made in honor of the Endurance Array 13 expedition. Credit: R/V Thomas G. Thompson[/caption]
According to Ed Dever, who leads the Coastal Endurance Array team, the only thing better than the weather was the excellent support from both the University of Washington’s R/V Thomas G. Thompson crew and the National Oceanic and Atmospheric Administration (NOAA) Marine Operations Center – Pacific (MOC-P) staff. “Their support started in April after the cancellation of the planned spring Endurance cruise. Over the course of the next two months, Project Manager and Chief Scientist Jon Fram worked with UW and NOAA to schedule and implement this cruise with very little advance notice and a constantly evolving COVID-19 situation. COVID-19 mitigation measures included testing and a 14-day quarantine for the crew and science party and socially distanced procedures for access to the NOAA MOC-P pier and for loading and unloading the ship. Thanks to the cooperative, can-do spirit of all involved, everything went well at the pier and at sea.”
The team left Newport, Oregon aboard the R/V Thomas G. Thompson on 3 July, returning to port twice to offload recovered equipment and to pick up equipment to be deployed. Thirty-four people were onboard the Thompson—11 from OOI, two marine technicians, and 21 members of the ship’s crew.
Like the good weather and smooth seas, the expedition went smoothly, with the exception of one profiler not being recovered and one glider that had to be recovered shortly after deployment. Over the course of the 13 days at sea, the team replaced eight moorings and deployed two additional nearshore profilers. These range in size from 400-pound profilers attached to 700-pound anchors to 8,000-pound buoys with 11,000-pound multi-function nodes, which are at the base of surface moorings, serving as anchors as well as platforms to affix instruments.
The team also successfully deployed three gliders that are collecting data throughout the water column as they transect across the continental shelf. The scientific party also conducted 14 CTD casts, which provide a number of useful measurements. The CTDs measure conductivity, temperature, and depth that can be used to calculate salinity and density. These CTD casts also included instruments that measure dissolved oxygen, chlorophyll, and suspended particle concentration. The CTD frame also had a rosette of collections bottles, which are used to sample water at the depths of the deployed instruments. The casts and bottle samples are then used to check the calibration of the deployed instruments.
With the longer-than-normal time in the water, the recovered equipment was more bio-fouled than during previous expeditions. But, there was some good news here in that the team found that the ultraviolet anti-fouling lights on the spectral irradiance (SPKIR) and dissolved oxygen (DOSTA) sensors kept the sensors clear and functional after nine months in the water.
The northern Pacific was alive with life as the team labored aboard the Thompson. The team and crew sighted orcas, mola molas, humpback whales, sharks, Pacific white-sided dolphins and a large red plankton bloom. During the journey, the team also conducted a virtual tour of the ship for Oregon State University for students participating in this year’s virtual Research Experience for Undergraduate program and Chief Scientist Jonathan Fram was interviewed by AltaSea in front of a live audience.
The 13 days at sea turned out to be a lucky 13, as evidenced in the pictures below:
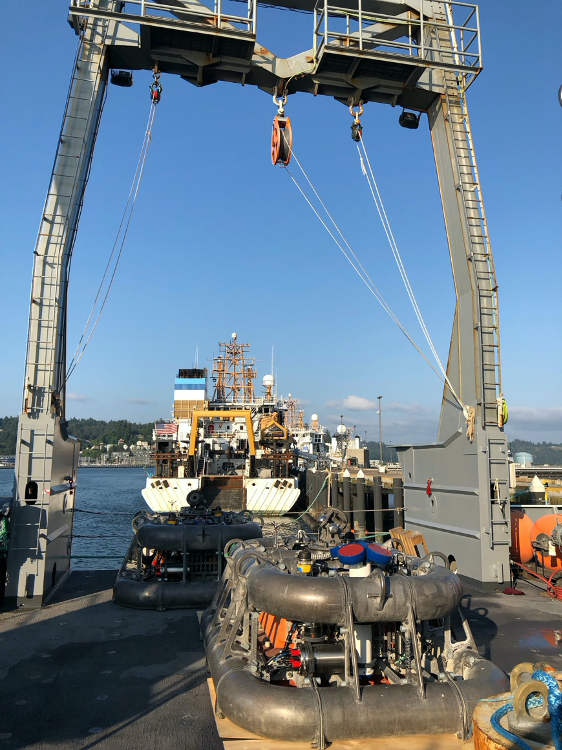
[caption id="attachment_16427" align="alignleft" width="400"] After a three-month delay to respond to COVID-19, the OOI Endurance cruise prepares to leave Newport, OR, aboard the University of Washington’s R/V Thomas G. Thompson at the NOAA Marine Operations Center-Pacific. Two instrumented bottom landers (multifunction nodes in OOI speak) are visible under the Thompson‘s A-frame. To the stern of the Thompson is NOAA’s ship Oscar Dyson. Credit: Ed Dever, University of Oregon[/caption]
[caption id="attachment_16428" align="alignleft" width="284"]
After a three-month delay to respond to COVID-19, the OOI Endurance cruise prepares to leave Newport, OR, aboard the University of Washington’s R/V Thomas G. Thompson at the NOAA Marine Operations Center-Pacific. Two instrumented bottom landers (multifunction nodes in OOI speak) are visible under the Thompson‘s A-frame. To the stern of the Thompson is NOAA’s ship Oscar Dyson. Credit: Ed Dever, University of Oregon[/caption]
[caption id="attachment_16428" align="alignleft" width="284"] Endurance 13 cruise Chief Scientist Jon Fram applies copper tape to instruments to protect them from biofouling. The two instruments shown measures carbon dioxide in air and at the surface just below the buoy (top) and salinity and temperature (bottom). Credit: Ed Dever, Oregon State University[/caption]
[caption id="attachment_16429" align="alignleft" width="300"]
Endurance 13 cruise Chief Scientist Jon Fram applies copper tape to instruments to protect them from biofouling. The two instruments shown measures carbon dioxide in air and at the surface just below the buoy (top) and salinity and temperature (bottom). Credit: Ed Dever, Oregon State University[/caption]
[caption id="attachment_16429" align="alignleft" width="300"] It’s always something. OOI technician’s Kristin Politano and Marnie Jo Zirbel prep buoy well instruments for deployment during the Endurance 13 Operations and Management Cruise. Credit: Ed Dever, Oregon State University[/caption]
[caption id="attachment_16439" align="aligncenter" width="500"]
It’s always something. OOI technician’s Kristin Politano and Marnie Jo Zirbel prep buoy well instruments for deployment during the Endurance 13 Operations and Management Cruise. Credit: Ed Dever, Oregon State University[/caption]
[caption id="attachment_16439" align="aligncenter" width="500"] Endurance 13 Chief Scientist Jon Fram was interviewed before a live audience by AltaSea when he was aboard the R/V Thomas G. Thompson. Credit: AtlaSea and Aimee Wlliams[/caption]
[caption id="attachment_16437" align="aligncenter" width="478"]
Endurance 13 Chief Scientist Jon Fram was interviewed before a live audience by AltaSea when he was aboard the R/V Thomas G. Thompson. Credit: AtlaSea and Aimee Wlliams[/caption]
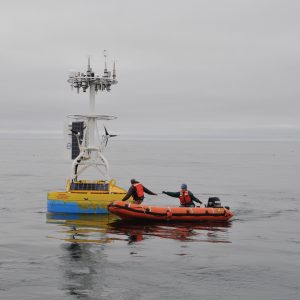
[caption id="attachment_16437" align="aligncenter" width="478"] The Endurance 13 Array team recovered this surface mooring during its expedition. The wind turbine on the left went missing in a January storm. The turbine on the right was missing two blades. The left solar panel was battered by sea lion. Yet, amazingly the buoy kept relaying data in spite of being battered by the elements! Credit: Jon Fram, Oregon State University[/caption]
[caption id="attachment_16438" align="aligncenter" width="640"]
The Endurance 13 Array team recovered this surface mooring during its expedition. The wind turbine on the left went missing in a January storm. The turbine on the right was missing two blades. The left solar panel was battered by sea lion. Yet, amazingly the buoy kept relaying data in spite of being battered by the elements! Credit: Jon Fram, Oregon State University[/caption]
[caption id="attachment_16438" align="aligncenter" width="640"] After 13 days at sea, the R/V Thomas G. Thompson returned to Newport, Oregon on 16 July. Only after the final equipment of the third leg was offloaded could the crew and scientific party disembark to be reunited with family and friends after nearly a month apart. Credit: Sue Zemliak, Otter Rock, Oregon[/caption]
Read More
After 13 days at sea, the R/V Thomas G. Thompson returned to Newport, Oregon on 16 July. Only after the final equipment of the third leg was offloaded could the crew and scientific party disembark to be reunited with family and friends after nearly a month apart. Credit: Sue Zemliak, Otter Rock, Oregon[/caption]
Read More Fram Interviewed Live During Endurance 13

UV Anti-fouling Light Keeps Oxygen Sensors Clean
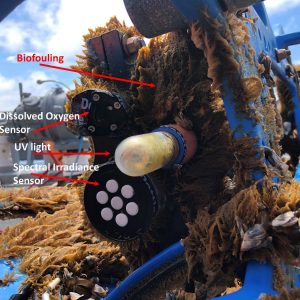
 Biofouling is a real challenge to keeping equipment deployed in the ocean free functioning properly to deliver data to shore. The addition of UV light is helping to keep the oxygen optode sensors clear and recording data. Photo: Jon Fram, Oregon State University.[/caption]
Biofouling is a hazard of keeping equipment in the ocean for long periods of time, particularly when it is near the surface where photosynthesis occurs. For OOI’s arrays that remain in the water for six months or longer, this is a pressing issue because of the need to ensure sensors can continue to collect and transmit data back to shore. The OOI scientists and engineers are always investigating ways to keep biofouling at bay. They recently worked with Aanderaa, which provides OOI’s oxygen optode sensors, to implement a solution to keep oxygen sensors free of biofouling by installing ultra-violet (UV) lights that periodically shine on the instruments’ sensing foil.
As early as 2016, a team of OOI engineers and technicians from Oregon State University, the University of Washington, and Woods Hole Oceanographic Institution began to tackle some of problems with the instruments selected by OOI and to improve the quality of instrument measurements. In October of 2016 AML Oceanographic showed OOI’s instrument group data from Ocean Networks Canada of a UV light used to mitigate biofouling on Aanderaa’s oxygen optodes. The following October, OOI deployed a side-by-side test of two oxygen optodes (one with a UV light pointed at it) at seven meters depth on the Oregon Shelf Surface Mooring. Data from the two sensors tracked each other for six weeks, and then the unprotected sensor fouled. Within weeks, there were daily afternoon spikes of up to twice the oxygen level of the protected sensor, with slightly lower measurements than the unprotected sensor at night due to respiration of the biofilm. The team found that the biofouling signal wasn’t always as dramatic, nor did it always develop in the same period of time after deployment. Physics has a hand in this, too. Sometimes the fouling signal disappeared after a storm cleaned off the sensor.
In summer 2018, OOI started deploying UV-protected oxygen optodes mounted shallower than 70 meters on Surface Moorings. By mid-209, once some initial hardware and deployment issues were resolved, OOI expanded deployment of UV-antifouling from moored dissolved oxygen sensors, to the dissolved oxygen sensors on the Coastal Surface Piercing Profilers, and then to uncabled digital still cameras moored at less than 70 meters depth.
Following the success of the UV-light test on dissolved oxygen sensors, UV antifouling was tested on a moored Pioneer Array spectral irradiance (SPKIR) sensor in 2018. Here too, the testing conducted with Sea Bird Scientific, the SPKIR vendor, confirmed that the UV light did not damage the instrument’s optics. As a result, in 2019, all subsurface OOI spectral irradiance sensors on Surface Moorings were outfitted with UV-antifouling mitigation, as well as the Coastal Surface Piercing Profilers and uncabled digital still cameras moored at less than 70 meters. The team has adjusted the cycle of the UV lights so that they prevent biofouling without damaging the sensors, interfering with measurements, or utilizing too much power.
“While the solution appears simple, it was a long journey to find the right mix of equipment and duration of use to resolve the issue of biofouling for each sensor at each location, “explained Jonathan Fram, project manager for the Coastal Endurance Array at Oregon State University. “An ongoing challenge is the intermittency of biofouling and the many forms it can take, which can make it difficult to properly diagnose the problem. Usually biofouling is a slimy film, but sometimes it can be a barnacle or another large creature.”
“The use of UV-lights for biofouling mitigation, although well-known, cannot often be used due to the power required,“ added Sheri White, senior engineer at Woods Hole Oceanographic Institution, who was instrumental in moving this solution forward on the Pioneer Array. “We have the advantage of generating our own power, so that we are able to implement it on a number of optical instruments on our Surface Moorings.”
OOI continues to measure the impact of the UV light on biofouling. While the results are clear that the UV lights increase measurement reliability and accuracy, the team is still trying to gauge the extent of the improvements. Data are annotated to indicate when UV-antifouling was used for each instrument deployment.
Read MoreReturn to Sea in the COVID-19 era

The R/V Neil Armstrong returned to its home port in Woods Hole, MA, on 16 June 2020, having completed a successful 10-day mission to service the Pioneer Array, 75 nautical miles south of Martha’s Vineyard. Its crew and nine-member science party from Woods Hole Oceanographic Institution proved that it is possible to work onboard while adhering to strict precautionary measures to prevent the spread of the coronavirus.
The expedition was the first science mission to have departed Woods Hole, MA following a “pause” in research expeditions imposed in March by UNOLS (University-National Oceanographic Laboratory System). UNOLS coordinates the U.S. academic research fleet ship schedules and has established guidelines for COVID prevention and mitigation aboard these ships.
“The preparation was arduous and comprehensive” said Al Plueddemann, Chief Scientist for the Pioneer Array expedition. “That preparation paid off with a cruise that completed everything we set out to do.” Plueddemann led the scientific team in a partial “turn” of the moored array, which means that equipment that had been deployed was recovered for refurbishment, and replaced with equipment that could undergo the rigors of being at sea, collecting, and recording data for the next six months. Over the 10 days, the team deployed five Coastal Profiler Moorings (CPMs) and recovered seven CPMs. In addition to the mooring turns, the expedition included many CTD casts (measuring Conductivity, Temperature and Depth) in the vicinity of the Pioneer Array, and the collection of shipboard meteorological and oceanographic data, both while on station next to the moorings, and while underway along specific track lines.
On top of what would be accomplished under normal operating conditions, the team was able to provide data in real-time to scientists who would normally be onboard, but whose participation was limited due to COVID-19 restrictions. Through an innovative use of data telemetry from the ship, WHOI’s Shipboard Scientific Services Group made it possible for members of the Northeast U.S. Shelf Long-Term Ecological Research (NES-LTER) team to receive data and images of phytoplankton and microzooplankton in near-real-time along the cruise track. The data were collected by Imaging FlowCytobots (IFCBs), which provide long term, high-resolution measurements of phytoplankton abundance and their cell properties.
“Our ability to conduct a near-normal cruise in the midst of the COVID-19 pandemic is a testament to the commitment to preparation from UNOLS and WHOI, and a reflection of the strong team within OOI and on the Armstrong” said Plueddemann. “We were all excited to get back to sea”.
The following is a collection of images from this successful mission.
After 14 days of quarantine, a nine-person science team from Woods Hole Oceanographic Institution boarded the R/V Neil Armstrong on 5 June 2020 to prepare for a 10-day expedition to service the Pioneer Array, 75 nautical miles south of Martha’s Vineyard in the Atlantic Ocean.The expedition was the first science mission to depart Woods Hole, MA, with new COVID-19 precautions in place. Photo: © Woods Hole Oceanographic Institution, Rebecca Travis
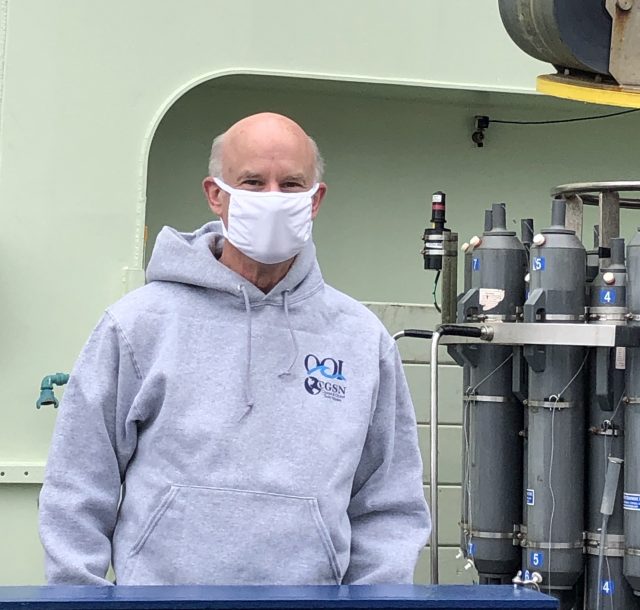
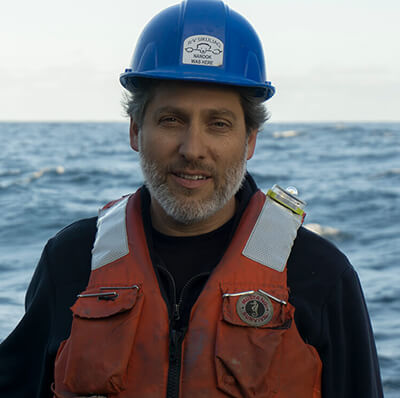
Chief Scientist of the Pioneer 14 Expedition, Al Pluedemann, models the uniform de rigueur —mandatory mask-wearing for the duration of the 10-day cruise. It was one of many stringent precautions taken to address the coronavirus pandemic. Photo: © Woods Hole Oceanographic Institution, Darlene Trew Crist
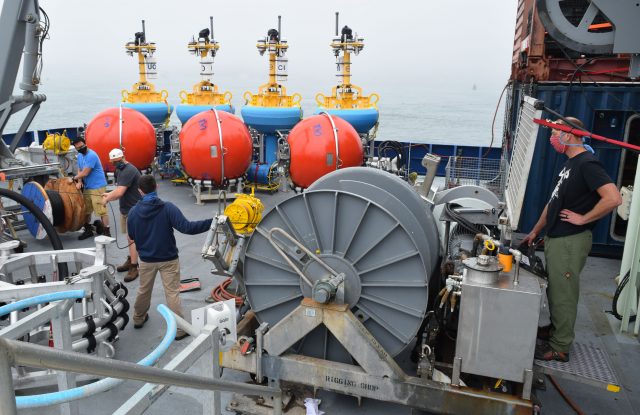
WHOI technicians (from left) Dan Bogorff, Nico Llanos, Chris Basque and Eric Hutt work to ensure that all equipment is in place as they prepare to head to the Pioneer Array. Photo: © Woods Hole Oceanographic Institution, Rebecca Travis
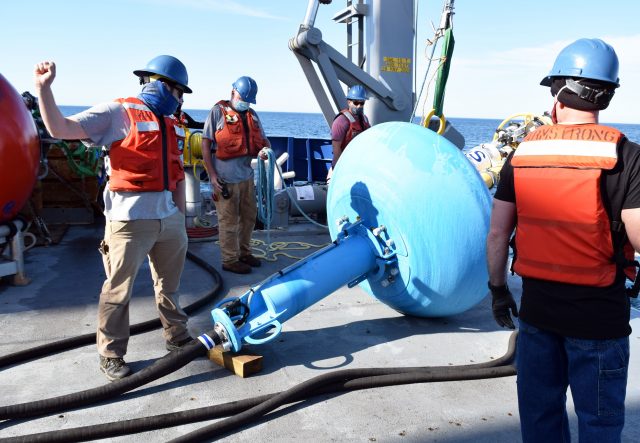
WHOI technician Chris Basque (far left) runs the deck while Bos’n Pete Liarikos and WHOI technician Nico Llanos (behind the buoy) assist in deploying the OSPM profiling mooring at Pioneer Array. Photo: © Woods Hole Oceanographic Institution, Rebecca Travis
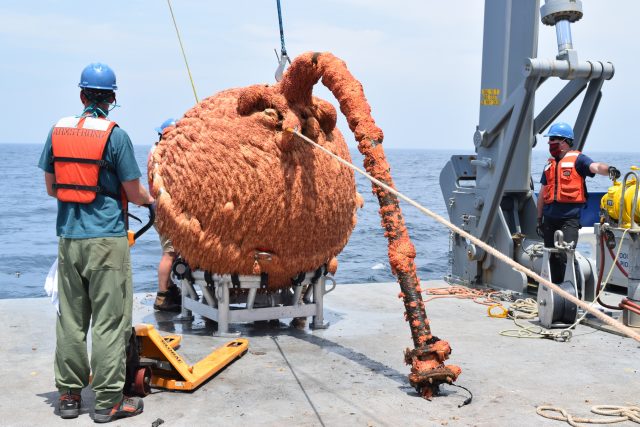
While this may look like Snuffleupagus on the back deck of the R/V Neil Armstrong, it is actually a profiler buoyancy sphere recovered on the Pioneer 14 cruise. The sphere is covered with marine growth after spending eight months in the water. Photo: © Woods Hole Oceanographic Institution, Rebecca Travis
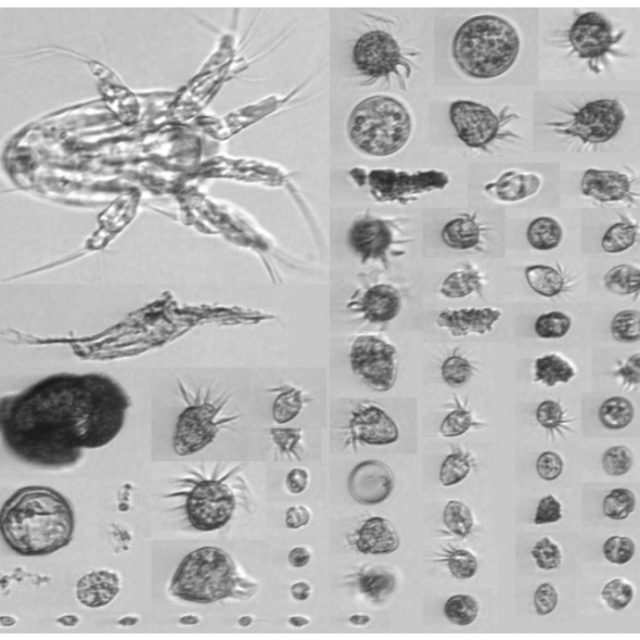
The Northeast U.S. Shelf Long-Term Ecological Research (NES-LTER) team, whose members would have been onboard under normal circumstances, remained onshore due to COVID-19 restrictions. But through an innovative use of data telemetry, Wood Hole Oceanographic Institution’s Shipboard Scientific Services Group made it possible for the NES-LTER team to receive data and images of phytoplankton and microzooplankton in near-real-time along the cruise track. Photo: NES-LTER
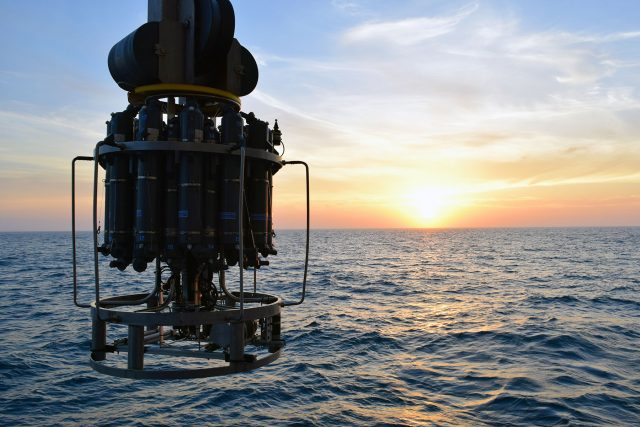
One of the rewards of working at sea is the peacefulness and beauty at the end of a long day aboard the R/V Neil Armstrong. Here the Pioneer 14 team got its just rewards as they lowered a CTD rosette frame into the Atlantic at sunset. Photo: © Woods Hole Oceanographic Institution, Rebecca Travis
Read MoreReady-to-use Educational Datasets Available
A new website of curated OOI datasets, called Data Nuggets, has launched. It contains valuable resources ready for integration into educational activities. The nuggets explore various concepts common in upper-level high school and introductory college courses and are designed and packaged to be readily accessible to educators to integrate into their existing curricula. Datasets were selected based on their quality and alignment with a broader OOI Science Theme.
 The nuggets were created as part of the National Science Foundation-funded OOI Synthesis & Education project, Ocean Data Lab, conducted by Rutgers University and led by the Consortium for Ocean Leadership.
For now, four data nuggets are available:
- 2015 Axial Seamount Eruption
- Seasonal Phytoplankton Blooms at High Latitudes
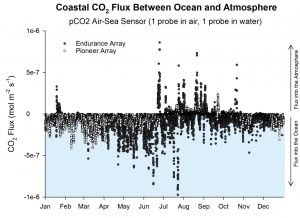
- Flux of CO2 Between Ocean and Atmosphere
- Seasonal Mixing of the Irminger Sea Water Column
The material provided in each nugget ranges from a description of scientific relevance to high resolution graphs to how use Python to pull and use OOI data in the classroom. The nuggets are designed to support educators as they design their own activities using OOI data.
More nuggets will be continually added so check the website often.
Read More