
Technical Innovations
Data Stream Parameters Simplified to Ease Access

We are in the process of changing the values of data stream parameters to be more Climate and Forecast (CF) compliant and to make the data you are looking for easier to find. For example, the parameter “pressure_depth” has been renamed to simply “pressure.”
The value change process started with pressure_depth and will be ongoing in our attempt to improve access to OOI data for all users. This next round of changes is larger in scope, and changes are documented in file format (excel, .csv) and accessible on the Changes Affecting Data page. Note that the changed values will take effect immediately in the M2M interface while pre-processed staged files will take up to a week to refresh. These updates were released on August 25th at 1:00pm ET.
Should you have any questions about this process or others, please don’t hesitate to reach out to our HelpDesk.
Read MoreTwo Decades of Mooring and Ship-Based Observations from the Newport Hydrographic Line
C.M. Risien, M.R. Fewings, J.L. Fisher, B.T. Cervantes, C.A. Morgan, J.A. Barth, P.M. Kosro, J.O. Peterson, W.T. Peterson, and M.D. Levine
In the Northern California Current System (NCCS), during spring and summer months, equatorward winds drive the upwelling of cold, nutrient-rich, and oxygen-poor waters from depth onto the shelf, fueling a highly productive marine ecosystem that supports valuable commercial fisheries. Oceanographic conditions in the NCCS vary on temporal scales from hours to decades. In contrast, grant-funded research typically consists of shorter-term studies (3-5 years). While such studies resolve intra-annual and perhaps inter-annual variability, they do not capture decadal scale variability that is critical for climate studies.
Risien et al. (2022), present two new decadal-scale data products. The first is ~550 gridded, cross-shelf hydrographic sections of temperature, salinity, potential density, spiciness, and dissolved oxygen from data collected biweekly to monthly from March 1997 to present along the Newport Hydrographic Line (NHL; 44.6°N, 124.1–124.65°W) off Newport, Oregon, USA, mostly by NOAA programs. They also present monthly climatologies derived from these observations.
The second data product is 23 years (1999–2021) of mooring temperature, salinity and velocity data — collected by five programs (OSU-NOPP, GLOBEC, OrCOOS, NANOOS/CMOP, OOI) at NH-10 (44.6°N, 124.3°W), 10 nautical miles west of Newport, Oregon along the NHL — that they stitched together into one coherent, quality-controlled data set (see figure above).
Making available such multi-decadal data sets, which they plan to release via public repositories, is essential to enable scientists to characterize natural and anthropogenically-forced variability; resolve cause-and-effect relationships in Earth’s climate and marine ecosystems at intra-seasonal, seasonal, inter-annual and decadal time scales; and verify climate models. These new gridded and concatenated data products show that long-term ocean observing efforts require multi-generational teams with a wide range of skills and a shared vision that is motivated by science and ocean monitoring needs.
Read MoreUsing Aircraft Expertise for Underwater Operations
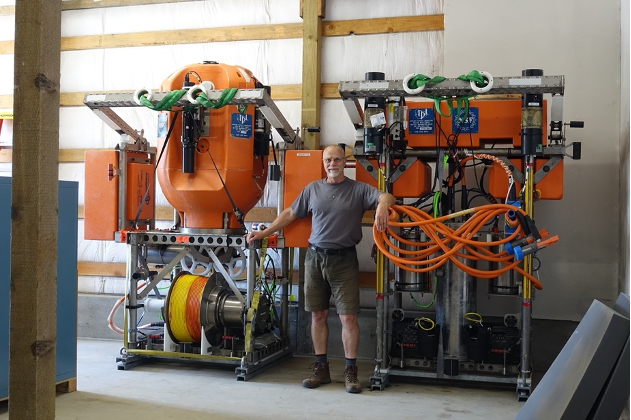
Regional Cabled Array (RCA) Engineer Eric McRae came to the RCA Team with a 20+ year background keeping aircraft in the air, cars on the road, and medical devices safe. McRae worked on a Head-Up display and skid control and braking systems on some large commercial aircraft that are flying now. He also worked on a popular pacemaker/defibrillator for a medical instrument company. As a result of this experience, and long-term work in automotive engine control, McRae brought with him a mindset about correct behavior of control software to the RCA. He simply will not accept anything that is misbehaving. In the past, people’s lives were at stake, now it’s possible interruption of data collection or loss of scientific equipment.
McRae adopted his approach to help design and keep operational the Shallow Profilers on the RCA moorings which must work correctly for a year at a time in the cold, dynamic, and sometimes hostile, waters of the Pacific Ocean. The Shallow Profiler houses 10 scientific instruments and includes a winch that pays out power and communication cable allowing the science pod to rise through the water column to a depth below the surface determined by currents and wave conditions.
“I think that the Cabled Array Team is successful because many of us came from industries where it was not acceptable to produce something that could fail,” McRae explained. “We use this same mindset to figure out ways to make things work and keep them working even under the most difficult of circumstances.”
[media-caption path="/wp-content/uploads/2022/07/eric-selfie.png" link="#"]RCA Engineer Eric McRae stands with the components of one of the RCA Shallow Profilers that he programmed to successfully move up and down the water column in the Pacific since 2014. Photo: McRae.[/media-caption]From his first days at the RCA, Gary Harkins, his boss at the time, told McRae that his job was to make sure the Shallow Profiler was safe. “Safety was the top priority — not science, or anything else. Once we were sure the profiler could be operated safely, we could accomplish whatever the science mission wanted.” Initially, McRae worked with Dr. Doug Luther and Dr. Kendra Daly to understand how the science team wanted the profiler to run. Once he understood the science requirements, he worked with RCA’s mechanical designers to understand how they wanted to design the mechanical aspects of the system.
McRae then used his experience to influence the design and created a viable electronic control system that supports communications that keep the winch running and its science pod node traveling up towards the surface and back down nine times a day. A winched cable provides continuous power and communications to the science pod, allowing science and engineering data to flow to shore in real time. The mechanical design and control system have kept the Shallow Profiler operational since its launch in 2014.
[embed]https://vimeo.com/733359478[/embed]The control system continually “talks” to the winch and science pod to assess movement through the water. Near the bottom, the science pod doesn’t move very much, except for an occasional tilt caused by currents. As it gets close to the surface, however, surface waves can have a huge impact on how the profiler moves and how much tension is on the cable. The science pod weighs ~900 pounds in air so when it gets moving back and forth underneath waves, it could significantly stress the cable. To prevent this from happening, the science pod “reports” three times a second to the control system about the conditions it is experiencing. These reports include acceleration, rotation, proximity to the surface, wave length, and a slew of other variables so that needed adjustments can be made automatically to keep the winch and ultimately its valuable science pod “safe.” If conditions warrant, the control system has the capability of aborting a running profile and/or parking the science pod near the mooring to wait things out.
The Shallow Profiler is often on the move. Each of the nine daily profiles take between one and a half to two and a half hours, depending on the profile type and ocean conditions. There’s a gap of about 30 to 45 minutes between profiles, where the science pod is parked down near the mooring platform. During that time, the controller is constantly monitoring the waves on the surface. McRae developed an algorithm to look at the worst-case peak to trough wave pressure so that when the profiler starts up for a run towards the surface, it has already calculated what it thinks the worst wave height combination will be. The original requirements of the system were that the science pod can go no closer to the surface than five meters or three wave heights, whichever is greater, so when it starts up, it already knows the ceiling for the coming profile.
“As designed, the profiler is smarter than we are. It makes seven decisions three times a second to ensure that it is on the right path and has accounted for all predictable conditions” McRae said.
Of course, there are other hazards besides ocean conditions. In September of 2017, a trawler’s net hit the mooring line at the Oregon Offshore site and eventually the mooring platform itself, pulling the 14,000-pound mooring and its two huge anchors from the seafloor. The profiler was running at the time and recorded the action until the boat pulled hard enough that the seafloor cable came unplugged. There has also been a smattering of mechanical issues, but the system has matured nicely. Should something unexpected go wrong in the future, McRae has programmed the profiler to take “evasive” action, then notify him and his team on land. This performance record demonstrates that not only did McRae’s work help keep the profiler safe, it helped make it a reliable component of the RCA that scans through the water with ease. The three profilers have made >40,000 profiles since 2015, making unprecedented measurements of ocean parameters.
Read More
Measurements Below the Surface
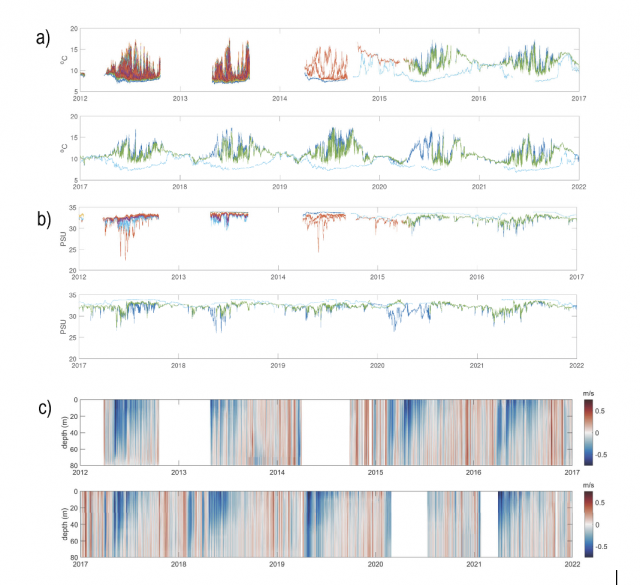
Strong winds and large waves in remote ocean locations don’t deter the Ocean Observatories Initiative (OOI) from collecting measurements in spite of such extreme conditions. By moving the moorings below the surface, the OOI is able to secure critically important observations at sites such as the Global Station Papa Array in the Gulf of Alaska, and the Global Irminger Sea Array, south of Greenland. These subsurface moorings avoid the wind and survive the waves, making it possible to collect data from remote ocean regions year-round, providing insights into these important hard-to-reach regions.
Instrumentation on the surface mooring in the Irminger Sea, however, has nowhere to hide and the measurements they provide are also often crucial for investigations, such as net heat flux estimates. Providing continuous information about wind and waves remains one of the most challenging aspects of OOI’s buoy deployments in the Irminger Sea. Fortunately, with each deployment, OOI is improving the survivability of the surface mooring so they continue to add to the valuable data collected in the region by their subsurface counterparts.
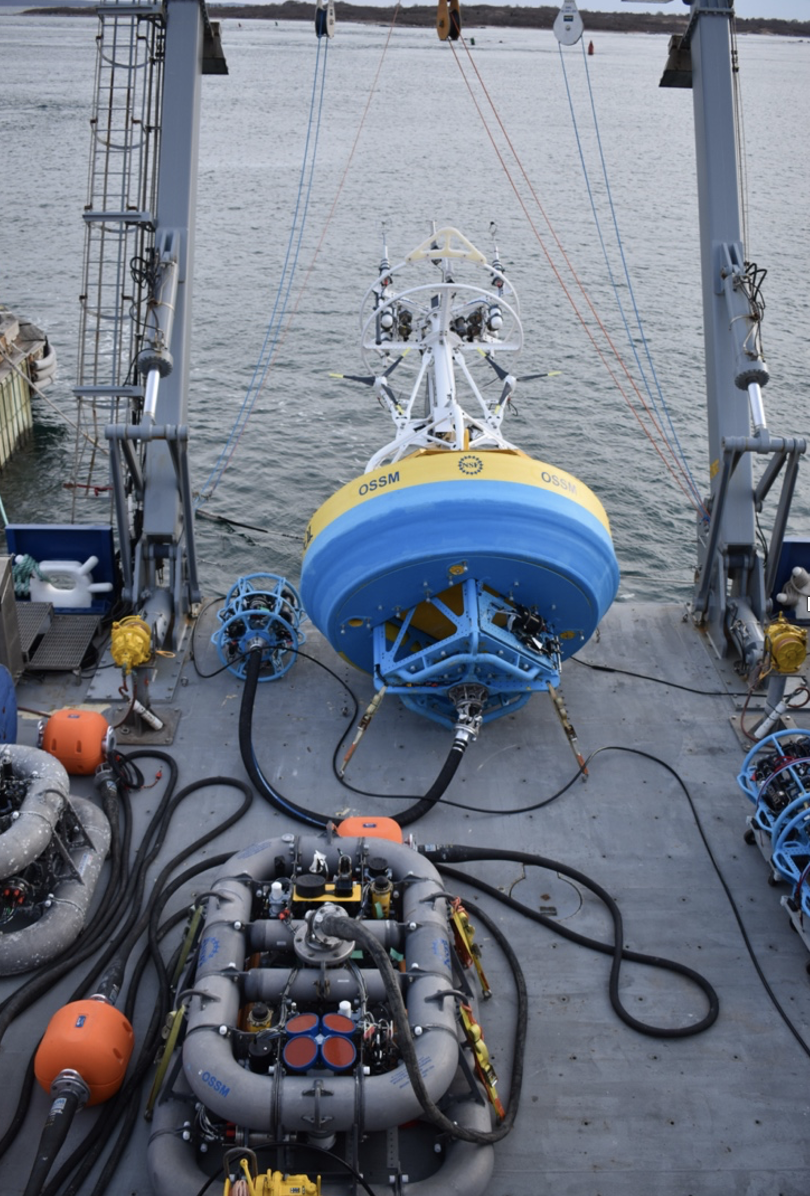
[media-caption path="/wp-content/uploads/2022/07/FLMB-9_DSC_0934.jpg" link="#"]The top sphere of a Flanking Mooring being deployed through the R/V Neil Armstrong’s A-Frame. Credit: Sawyer Newman©WHOI.[/media-caption]Below the surface in the Irminger Sea
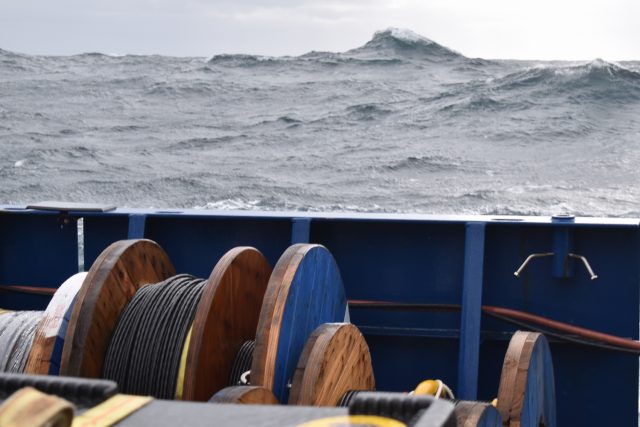
A team of 15 OOI scientists and engineers spent the month of July in the Irminger Sea aboard the R/V Neil Armstrong, recovering and deploying three subsurface moorings there, along with other array components. The Irminger Sea is one of the windiest places in the global ocean and one of few places on Earth with deep-water formation that feeds the large-scale thermohaline circulation. Taking measurements in this area is critical to better understanding changes occurring in the ocean.
OOI’s Irminger Sea Array also provides data to an international sampling effort called OSNAP (Overturning in the Subpolar North Atlantic) that runs across the Labrador Sea (south of Greenland), to the Irminger and Iceland Basins, to the Rockall Trough, west of Wales. The OOI subsurface Flanking Moorings form a part of the OSNAP cross-basin mooring line with additional instruments in the lower water column. During this current expedition, the Irminger Team will be recovering and deploying OSNAP instruments that are included as part of the OOI Flanking moorings, in addition to turning several OSNAP moorings as well.
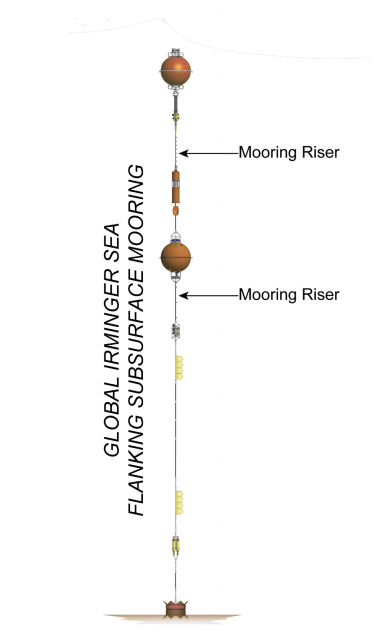
[media-caption path="/wp-content/uploads/2022/07/FLMB-9_DSC_0941.jpg" link="#"]The Flanking Mooring top float in the water during deployment. The sensors mounted in the sphere will measure conductivity, temperature, fluorescence, dissolved oxygen and pH at 30 m depth. Credit: Sawyer Newman©WHOI.[/media-caption]The triangular array of moorings in the Irminger Sea provide data that resolve horizontal variability, how much the physical aspects of the water (temperature, density, currents) and its chemical properties (salinity, pH, oxygen content) change over the distance between moorings. The individual moorings resolve vertical variability – the change in properties with depth. Three of these moorings are entirely underwater, with no buoy on the surface. They do have, however, multiple components that are buoyant to keep the moorings upright in the water column.
[media-caption path="/wp-content/uploads/2022/07/FLMB-9_DSC_0984.jpg" link="#"]The mid-water sphere holds an ADCP instrument which will measure a profile of water currents from 500 m depth to the sea surface. Photo Credit: Sawyer Newman©WHOI.[/media-caption]Each subsurface mooring has a top sphere at 30 m depth, a mid-water sphere at 500 m depth, and back-up buoyancy at the bottom to ensure that the mooring can be recovered if any of the other buoyant components fail. Instruments are mounted to the mooring wire to make measurements throughout the water column.
[media-caption path="/wp-content/uploads/2022/07/FLMB-9_IMG_5328.jpg" link="#"]Glass balls in protective “hard hats” provide extra flotation at the bottom of the mooring. Their tennis ball yellow color looks almost fluorescent in the brief (and much enjoyed) sunshine. Photo Credit: Sheri N. White©WHOI.[/media-caption] Read MoreRemotely Fixing and Preventing Mooring Issues
Alex Franks’s job is a big one. He is charged with fixing various issues that occur on OOI moorings, while they are hundreds and sometimes even thousands of miles away in the ocean. As an Engineer II at Woods Hole Oceanographic Institution (WHOI), Franks is intimately familiar with the mooring system controller software, which allows him to troubleshoot and fix instrumentation problems on OOI moorings, regardless of their location.
Franks has been working with electronics for over a decade and solving OOI mooring-related challenges since 2015. Many examples exist of his innovative solutions. In 2020, for example, the satellite Internet service that was being used to send data from OOI moorings to WHOI servers was no longer a viable solution. The WHOI team faced the task of either finding a replacement system, or working with the then-current system. One easily implementable solution was to move to transmitting data through OOI’s Iridium radio antennas full time. There were downsides to this solution, however. It would allow no margin of error, would consume more power, and still not be able to send data from all the instruments.
Franks figured out a better solution that would both keep costs manageable and continue to meet timely data transmission goals by modifying the Iridium file transfer portion of the mooring software to accommodate a new data transfer scheme. The new scheme used a feature of the computer program rsync, a fast and versatile file copying tool, called “diff”. Instead of using rsync to communicate with shore servers and determine the “delta” or change between the new instrument data on the mooring and the instrument data files on the WHOI server, he used one of the mooring’s onboard computers as an intermediary server to generate “diff” files against (delineating old from new data). These files were then generated and stored, and sent over the Iridium connection. Using this new configuration, Franks succeeded in sending the entire dataset of all instruments on the mooring, except one that was sent at a reduced sample rate. While transmission times can vary with weather conditions, this newly configured system sends data to the server every 20 minutes every other hour, reducing transmission times from 1440 minutes per/day to about 240 minutes per day.
[media-caption path="/wp-content/uploads/2022/04/DSC_0639-copy.jpg" link="#"]Waves in the North Atlantic can get pretty large, which makes it hard to conduct research at sea, especially in winter. The waves and wind in the Irminger Sea also create challenges for ocean observing equipment in the water there year-round. Credit: ©WHOI.[/media-caption]
Franks also found ways to remotely manage mooring issues caused by weather and sea state by modifying software that controls wind turbines. Wind turbines play a critical role on OOI moorings, providing power to recharge the main system batteries. At the Irminger Sea Array, where the sun is absent for months at a time (the moorings also utilize solar panels), these wind turbines are critical. Prior to Franks’ software fix, human input was required to disable the turbines to prevent them from spinning while wave heights were too great. Franks modified the software used to control the spinning of the turbines to read environmental data from the buoy itself and make automated decisions in real-time that previously had to be done manually. The system now changes its configuration based on a variety of sensor inputs, which make for more immediate decisions to ensure the continued safe operations of the turbines. The software modifications not only help mitigate heavy sea damage to the turbines but saves power, as well. The software detects when the air temperature is above freezing and turns off the precipitation sensor heaters, conserving energy when possible. The software also has fail-safes in place for high or low voltage and to determine hydrogen concentration levels inside the electronics. An illustration of this software configuration is provided below.
[media-caption path="/wp-content/uploads/2022/04/Mooring-system-software-upgrade.png" link="#"] This new software configuration detects when the air temperature is above freezing and turns off the precipitation sensor heaters, and has fail-safes in place for high or low voltage and for hydrogen concentration levels inside the electronics .Credit: ©WHOI.[/media-caption]
Franks has also developed software improvements to the power system controller inside the OOI surface moorings. His work ran the gamut from disabling operational bugs in the system to reducing power consumption to fixing software errors to increase reliability. During a year-long deployment in the Irminger Sea, part of the power system controller board failed. Franks installed a software patch remotely that was able to limit the level of charge coming from wind turbines and wrote a fail-safe feature for the system to disconnect all charging sources if the voltage approached dangerous levels.
The challenges are what keeps Franks enthusiastic about his job, “I just love trying to figure out a solution and it’s particularly rewarding to be able to remotely resolve issues with equipment deployed in the open ocean.”
Read More
Efforts to Standardize Data Continue
The OOI Data Teams have recently made great strides in ongoing efforts to standardize data, making it easier for users to understand what OOI data and metadata are available. Efforts have focused on improving labeling, descriptions, and correcting units to ensure consistency. A major improvement underway is matching variable naming conventions with those governed by Climate and Forecast (CF) metadata standards.
The first round of changes is expected to be completed by the end of June 2022. Once these changes are implemented, existing scripts used to download and process OOI data files could be impacted depending on how the code was written. The Data Teams will publish a list of affected streams and recommended code updates prior to the release of these changes, to highlight the improvements and to allow for processing script modifications.
Read MoreUncovering Changing Life in the Water Column
Oregon State University Assistant Professor Jennifer Fehrenbacher needed a ship to carry out her National Science Foundation-funded research investigating the lives of foraminifera (single-celled organisms about the size of a grain of sand and smaller) in the northern Pacific. Her work, in collaboration with Dr. Claudia Benitez-Nelson at the University of South Carolina (UofSC), involves deploying bottom-moored sediment traps and collecting plankton tows while at sea, giving researchers the opportunity to explore foraminifera that live in lighted surface waters, and how these communities have changed over time in response to the surrounding ecosystem.
Fehrenbacher found her ship. She will be joining forces with the Endurance Array Team aboard the R/V Sikuliaq during its bi-yearly expedition to recover and deploy ocean observing equipment at its array in the northeast pacific off the coast of Oregon. Fehrenbacher and her team of four researchers will join the Endurance Array 16 team in early April for the second of its two-leg expedition. This will be a continuation of her research project that began in September 2021.
Last September, Fehrenbacher’s team put in place two tandem sediment traps that are located close to the OOI Slope base node. One was deployed at about 600 meters water depth, the other slightly above the sea floor. The last sediment trap study in this region was conducted around 30 years ago, and the foraminiferal species have likely changed since then, as have ocean conditions.
[media-caption path="/wp-content/uploads/2022/03/IMG_5185-copy.jpg" link="#"]Fehrenbacher’s team will be retrieving two tandem sediment traps that are located close to the OOI Regional Cabled Array slope base node. Credit: Jennifer Fehrenbacher, OSU.[/media-caption]
The sediment traps have been collecting material in place for the past six months and will be recovered along with the Endurance 16 team’s recovery and deployment work. Once the traps are back onboard, the collecting cups will be taken off, emptied, replaced, and the traps redeployed for another six-month period. The researchers will package the collected materials for analysis at OSU and UofSC.
The team also will be examining live specimens from night-time plankton tows, taking advantage of quiet night-time hours to conduct the plankton tows when the Endurance team is unable to work safely moving large, bulky, and unwieldy equipment in and out of the ocean. “This arrangement is a win-win for everyone,” said Endurance Array Chief Scientist Ed Dever. “It maximizes the use of ship time, while helping to provide data to answer some questions about how ocean conditions are changing.”
Fehrenbacher’s team will be conducting a series of discrete new tows from the surface to about 500 meters. “While I don’t anticipate a ton of critters in the really deep water, net tows haven’t been done extensively in these waters at these depths. The last one was 30 years ago by oceanographer Alan Mix and his graduate student Joseph Ortiz, so this new work will give us insight into how life in the water column may have changed over time, “ said Fehrenbacher.
Fehrenbacher’s team will be conducting experiments with live foraminifera in a portable travel lab they will bring onboard. A number of different experiments are planned:
PhD candidate Kelsey Lane will be collecting foraminifera (shortened version “forams”) to study their genetics and their microbial communities, other species living with forams.
Graduate student Grace Meyer will be striving to measure carbon and oxygen isotopes in individual forams. She will be collecting empty shells from both the water column and sediment trap material and compare what is found in both, providing information about water column processes that could alter shells’ composition.
Postdoctoral researcher Brittany Hupp will be collecting both live forams and empty shells to study the chemistry of different types of forams, looking at their isotopes and trace metals content.
Researcher Eric Tappa, a sediment trap expert from the UofSC, will be deploying and recovering the sediment trap equipment. Tappa has been working with sediment trap moorings for decades and have proven critical in providing longer time-series records of processes occurring in overlying waters.
As lead scientist Fehrenbacher will be participating in these onboard experiments. She also will be growing forams under controlled conditions and watching them to learn how temperature modulates their shells or their behaviors during the day-night cycle, and will continue her work with recovered forams once she returns to her home lab. There she will be measuring the trace element concentrations in foram shells so results can help inform the Paleo record. . She explained, “Foram shells are used basically as proxies for environmental conditions. So when we measure trace elements in their shells, this gives us information about the pH, temperature, nutrient content, and even the salinity of the ocean in the past.” The onboard experiments help scientists under how forams incorporate these elements into their shells when they are alive, which they can use in assessing past records.
[media-caption path="/wp-content/uploads/2022/03/IMG_5196-copy.jpg" link="#"]An anchor weighing ~2500 pounds is deployed to keep a sediment trap in place for six months until it is recovered with a treasure trove of marine life and particulates for investigation. Credit: Jennifer Fehrenbacher, OSU.[/media-caption]
Challenges of studying small living things
Studying single-celled organisms is difficult on dry land, but is compounded by a moving ship in rolling seas. Fehrenbacher’s team will be taking onboard multiple microscopes, including an inverted microscope to see their subjects, water circulators to keep them at constant conditions while they are alive, and a pH meter. High-powered microscopes are critical for the work because forams range in size from smaller than a grain of sand—about 100 microns— to up to about a millimeter.
“We look at forams in a petri dish under the microscope,” explained Fehrenbacher. “This is challenging as the ship moves back and forth so does the water in the petri dish so you’re looking back and forth as the ship moves.” The researchers have come up with the solution of holding the petri dish at an angle so the water and foram stay in one place and helps prevent researchers’ sea sickness.
Fehrenbacher predicts that the amount of material collected on the Endurance Array 16 cruise will keep she and her graduate students busy for at least the next two years and beyond. She added, “There’s really just nothing quite like the type of information you can get from sediment trap studies. While going out to sea for two weeks a year and doing plankton tows are helpful, we only get information about what’s in the water column at the exact moment of collection. But sediment traps provide months’ worth of data at really high resolution that we can compare with other OOI data and get a detailed picture of ocean conditions and how those conditions affect marine life.
Read More
Distributed Acoustic Sensing Lays Groundwork for Earthquake, Tsunami Warnings, and More
Researchers using the OOI Regional Cabled Array are at the forefront of testing Distributed Acoustic Sensing (DAS) along the seafloor through funding from the National Science Foundation. Ocean-bottom DAS using submarine fiber optic cables promises to advance what we know about marine geology, offshore earthquakes, ocean currents, ocean waves, sediment transport, marine mammals, and a host of other activities that now can be measured by this revolutionary technique.
Taking advantage of a rare temporary shutdown of RCA’s submarine fiber optic cables during a shore station maintenance period, University of Washington Researcher William Wilcock and California Institute of Technology (Caltech) Graduate Student in Geophysics Ethan Williams were part of a team of scientists who installed DAS interrogators on RCA’s “dark cables” to test and collect data for a community experiment. The experiment was designed to determine the potential of submarine DAS to observe seismic, oceanographic, acoustic and geodetic processes. Each interrogator transmitted laser pulses down the fiber optic cable from RCA’s shore station and across the offshore Cascadia Margin and recorded the echoes that came back. This backscatter remains constant until some movement on the bottom or in the water column perturbs the fibers in the cable, changing the pattern of backscattered light. By rapidly probing the cable hundreds of times per second, DAS allows researchers to monitor what’s happening in the cable environment.
“Using DAS, the fiber optic cable acts, in effect, like a line of seismometers that can measure the stretching and contracting of the ground, “explained Wilcock. “It’s an amazing technology, similar to going out in the field and putting a seismic instrument every 10 meters for a stretch of 100 kilometers. So it’s just astounding in terms of what it can potentially measure,” said Wilcock.
The DAS system also has the capability of measuring other oceanographic signals. “It turns out that ocean bottom acoustic sensing on these fiber optic cables is as sensitive to the water layer above as it is to the solid Earth below. This sensitivity provides all sorts of really interesting signals that you would normally observe using an ocean bottom pressure sensor. DAS is opening up the door for lots of interesting research opportunities,” said Williams, who has been working with DAS systems for years under the supervision of Zhongwen Zhan at Caltech, one of the world’s foremost experts in the field.
Among the many potential ways DAS data might be used include advancing earthquake and tsunami early warning systems, and understanding wave and current action, sediment transport, and ocean-generated seismic noise, as well as providing biological information. In Wilcock’s case, he’s excited about using DAS to gain access to fin whale calls that were picked up by this DAS experiment.
The National Science Foundation funded this experiment in the hopes of developing protocols that can support the use of DAS for science and hazards mitigation in the Northeast Pacific while meeting national security requirements. The U.S. Navy conducted a preliminary review of the data and subsequently released the data for public use. The data are being stored on RCA servers at the University of Washington. Researchers will have ftp access to the data at this link. But because the full data set is 26 terabytes, researchers can also email ooicable@uw.edu to arrange to provide disks that will be returned with data they are interested in.
Four days of continuous measurements in this dynamic offshore environment also offer a potential treasure trove of data. Graduate student Williams is turning his attention to exploring these datasets and calibrating them against conventional measurements to better understand what some of the potential applications may be. “I’m very excited about the potential DAS brings to understanding what’s happening on the seafloor. Having, in essence, so many seismometers on the ocean floor means that we can apply all sorts of array-based processing so we’re not only averaging in time, we’re combining information in space. And this allows a lot of really innovative things that we weren’t able to do before.”
“But the real value of these datasets comes from being an open dataset. It will be a great facilitator for learning with the potential to expand general knowledge about how to use DAS in the marine geology and marine geophysics world, which is great,” Williams added.
Both Wilcock and Williams were excited about the potential for DAS to open up understanding of the processes involved in this deep-sea world. They both mentioned a dream of having DAS sensors integrated into future SMART cable technology to expand DAS use on land and in the sea.
Read More
Improving Remote System Response in Increasingly Hostile Oceans
Wind and Waves and Hydrogen, Oh My!
Improving remote system response in increasingly hostile oceans
This article is a continuation of a series about OOI Surface Moorings. In this article, OOI Integration Engineer Alexander Franks discusses the mooring software and details some of the challenges the buoy system controller code has been written to overcome.
Components of the OOI buoys working in concert make up a system that is designed for deployment in some of the most challenging areas of our world’s oceans. These systems collect valuable scientific data and send it back to Wood Hole Oceanographic Institution (WHOI) servers in near real time. Mechanical riser pieces (wire rope, and/or stretch hoses) moor the buoy to the bottom of the ocean. Foam flotation keeps the buoy above water in even the worst 100-year storm, while its masthead supports instrumentation and satellite radios that make possible the continuous relaying of data. The software controlling the system is just as important as the physical aspects that keep the system operating.
The system software has a variety of responsibilities, including setting instrument configurations and logging data, executing power schedules for instruments and parts of the mooring electronics, controlling the telemetry system, interfacing with lower-level systems including the power system controller, and distributing GPS and timing. The telemetry system is a two-way communication path, so the software controls data delivery from the buoy, but also provides operators with the ability to perform remote command and control.
[caption id="attachment_22938" align="alignnone" width="745"]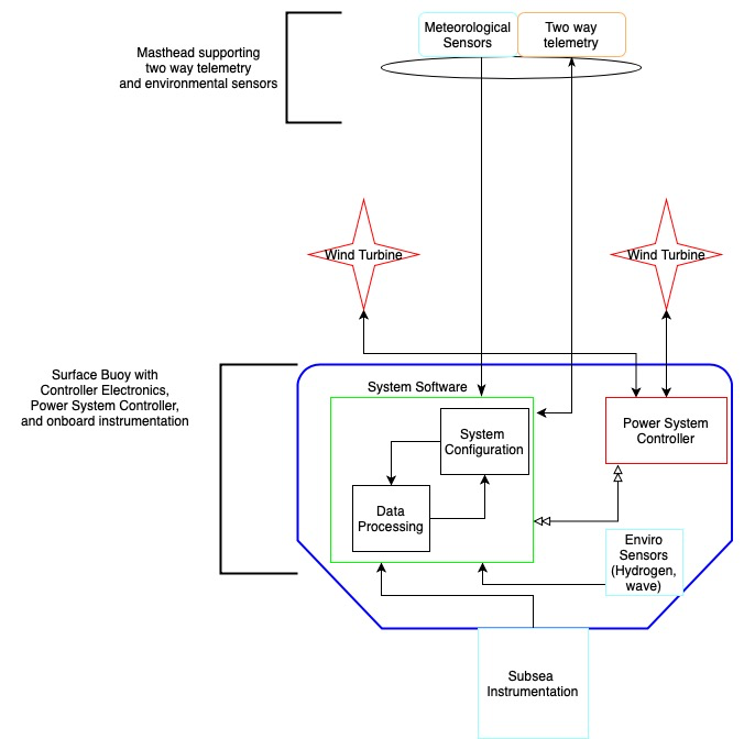 Software flow diagram created by OOI Integration Engineer Alex Franks[/caption]
The unforgiving environment and long duration deployments of OOI moorings lead to occasional system issues that require intervention. Huge storms, for example, can build waves so high that they threaten wind turbines on the moorings. At the Irminger Sea Array, ice can accumulate so much as to drastically increase the weight of the masthead, and with subsequent buoy motion, risk dunking the masthead and instruments. Other mooring functions require constant attention. The charging system must be monitored to ensure system voltages stay at safe levels and hydrogen generation within the buoy itself is kept within safe limits. Two-way satellite communication allows operators to handle decision making from shore using the most up-to-date information from the buoy.
“Since starting in 2015 and following multiple mooring builds and deployments, I’ve realized that issues can rapidly arise at any time of the day or night. I started thinking about what the buoys can do for themselves, using the data being collected onboard,” Franks said.
One of the game-changing upgrades implemented by Franks was to read environmental data and make automated buoy safety decisions in real-time that were previously performed by the team manually. For example, previously, the team would need to monitor weather forecasts and decide preemptively whether changes to buoy operations were advisable. With recent software changes, the system can now change its configuration based on a variety of sensor inputs. These variables include system voltage, ambient temperature, hydrogen levels inside the buoy well, wind speed, and buoy motion (for sea state approximation). In addition to the software updates, the engineering team redesigned the power system controller. They added charge control circuits and the ability to stop the wind turbines from spinning. The software and electrical upgrades now provide redundant automated safeguards against overcharging situations, hydrogen generation, and turbine damage, maximizing buoy operability in harsh environments.
[caption id="attachment_22946" align="alignleft" width="650"]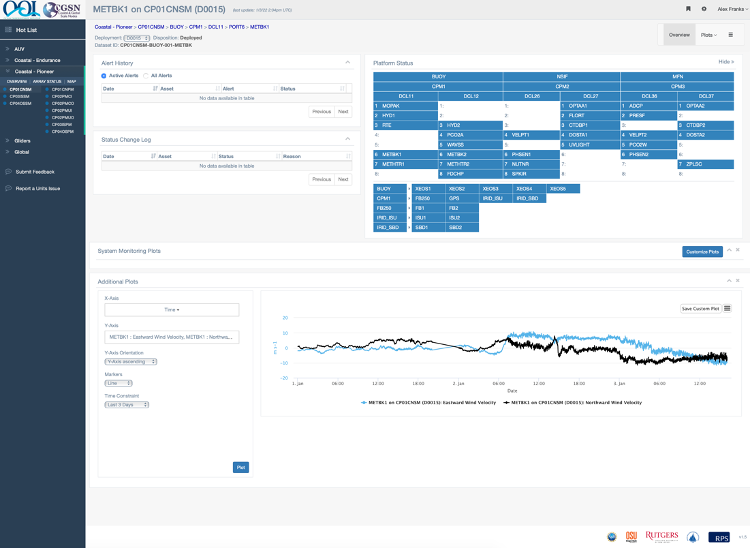 Onshore engineers are able to keep track of Irminger Sea buoys and instrumentation on this new new dashboard.[/caption]
With a largely independent system, operators also needed a way to easily monitor status of the buoys and instrumentation. The software team created a new shoreside dashboard that allows operators to set up custom alerts and alarms based on variables being collected and telemetered by the buoy. While the buoy systems can now operate autonomously, alerts and alarms maintain a human-in-the-loop component to ensure quality control.
As operations and management of the moorings have progressed, the operations team has found opportunities to fine tune how operators and the system handle edge cases of how the system responds to hardware failures and extreme weather. In the past, sometimes conditions changed faster than the data being transmitted back to shore. This new sophisticated software automates some of the buoy’s responses to changing conditions in real time, which helps to ensure their continued operation even under challenging conditions. The decreased response time to environmental and system events using an automated system, coupled with the ability to monitor and interact remotely, has increased the reliability and survivability of OOI moorings.
Read MoreTracking Fish with Acoustics
New RAFOS Ocean Acoustic Monitoring (ROAM) tags have recently been designed to allow geolocation of underwater assets, including pelagic fishes, over large areas in the ocean and even deep into the ocean’s twilight zone.
[caption id="attachment_22879" align="alignleft" width="350"] The ROAM tag is small (30 mm x 10 mm) and light enough (8 gm in water) to be attached to an ocean glider with no adverse impacts on performance. Here are two ROAM tags attached to OOI test glider 363 before deployment from the R/V Armstrong during the Pioneer 17 cruise. Credit: ©WHOI, Diana Wickman.[/caption]
An opportunity to test the new ROAM tags arose in conjunction with the October 2021 Pioneer Array mooring service cruise. “We had recently deployed moored sound sources in deep water between Cape Cod and Bermuda,” said Simon Thorrold who, with University of Rhode Island colleagues Melissa Omand and Godi Fischer, is leading the ROAM fish tag development. “One of our goals was to determine whether tagged fish near the continental slope south of New England could be detected using these distant sources.” Thorrold reached out to the OOI team to see if there was potential for a short-term test at the Pioneer Array site, located 75 nautical miles south of Martha’s Vineyard at the shelf-slope interface.
OOI Project Scientist Al Plueddemann and the OOI glider team determined that a glider test planned during the mooring service cruise in late October would be happening at the right place and the right time to be useful for testing the acoustic tags. “This technology is something we would like to consider for OOI, and in particular for the Pioneer Array in its new southern Mid- Atlantic Bight location,” said Plueddemann, “so the potential for a test was of interest to us.”
The glider team determined that the small (30×10 mm), light (8 gm in water) tags would have no measurable impact on glider performance and could be safely accommodated on the test glider. The tags were mounted to the glider by fitting the tags into plastic loop clamps and then securing the loop clamps to existing threaded holes in the glider hull. During the three-day test deployment, the glider made one dive to 50m, one dive to 200m, three dives to 500m, and approximately 76 dives to 200m.
The glider data and acoustic tag data are being evaluated, and will provide information about fish tag performance and the potential for future use within the OOI arrays.
This article was written by Woods Hole Oceanographic Institution colleagues: Senior Scientist Simon Thorrold and Senior Engineering Assistant II Diana Wickman.
Read More