Bottom Boundary Layer O2 Fluxes During Winter on the Oregon Shelf
Adapted and condensed by OOI from Reimers et al., 2022, doi:/10.1029/2020JC016828.
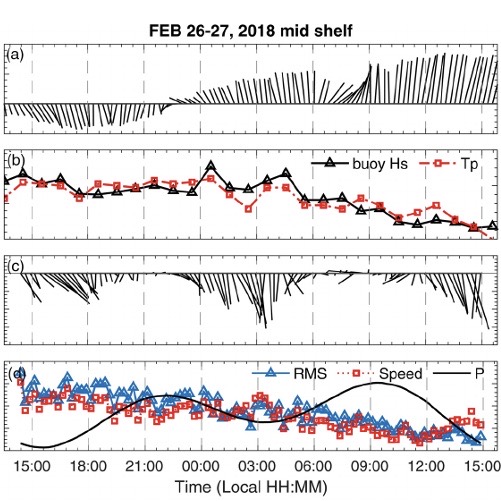
[caption id="attachment_21037" align="aligncenter" width="640"]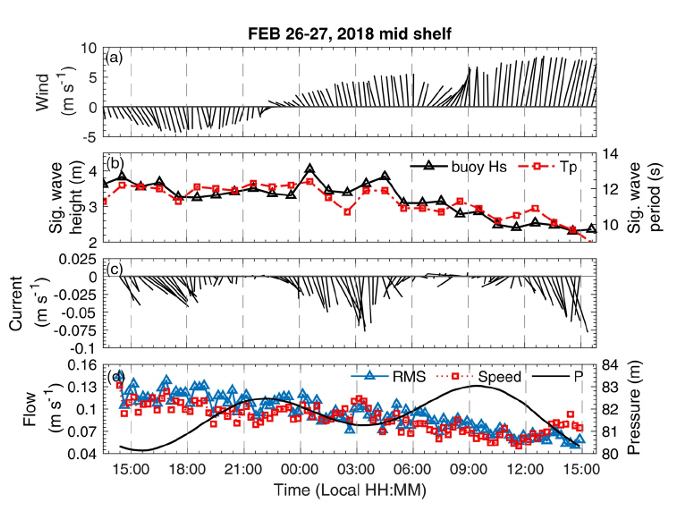 Fig. 1 Time series of physical conditions during the February 26–27, 2018 deployment (EC D1) at the mid-shelf site. (a) Wind vectors (15-min averages) measured at the OOI Shelf Surface Mooring (CE02SHSM), (b) wave properties (hourly averages) measured at the OOI Shelf Surface Mooring, (c and d) other near-bottom ADV parameters (15-min averages). Both the winds and ADV velocities are portrayed in earth coordinates (eastward is to the right along the horizontal axis and northward is positive along the vertical axis). ADV, Acoustic Doppler Velocimeter; EC D, eddy covariance deployment[/caption]
The oceanic bottom boundary layer (BBL) is the portion of the water column close to the seafloor where water motions and properties are influenced significantly by the seabed. This study (Reimers & Fogaren, 2021) reported in the Journal of Geophysical Research examines conditions in the BBL in winter on the Oregon shelf. Dynamic rates of sediment oxygen consumption (explicitly oxygen fluxes) are derived from high-frequency, near-seafloor measurements made at water depths of 30 and 80 meters. The strong back-and-forth motions of waves, which in winter form sand ripples, pump oxygen into surface sediments, and contribute to the generation of turbulence in the BBL, were found to have primed the seabed for higher oxygen uptake rates than observed previously in summer.
Since oxygen is used primarily in biological reactions that also consume organic matter, the winter rates of oxygen utilization indicate that sources of organic matter are retained in, or introduced to, the BBL throughout the year. These findings counter former descriptions of this ecosystem as one where organic matter is largely transported off the shelf during winter. This new understanding highlights the importance of adding variable rates of local seafloor oxygen consumption and organic carbon retention, with circulation and stratification conditions, into model predictions of the seasonal cycle of oxygen.
Supporting observations, which give environmental context for the benthic eddy covariance (EC) oxygen flux measurements, include data from instruments contained in OOI’s Endurance Array Benthic Experiment Package and Shelf Surface Moorings. Specifically, velocity profile time-series are drawn from records of a 300-kHz Velocity Profiler (Teledyne RDI-Workhorse Monitor), near-seabed water properties from CTD (SBE 16plusV2) and oxygen (Aanderaa-Optode 4831) sensors, winds from the surface buoy’s bulk meteorological package, and surface-wave data products from a directional wave sensor (AXYS Technologies) (see e.g., Fig 1 above).
Reimers, C. E., & Fogaren, K. E. (2021). Bottom boundary layer oxygen fluxes during winter on the Oregon shelf. Journal of Geophysical Research: Oceans, 126, e2020JC016828. https://doi.org/10.1029/2020JC016828
Read More
Pioneer Data Show the Continental Shelf Acts as a Carbon Sink
Excerpted from the OOI Quarterly Report, 2022.
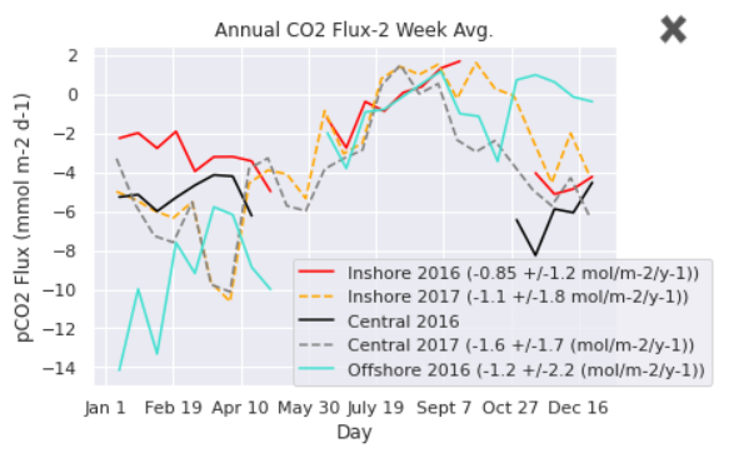
[media-caption path="https://oceanobservatories.org/wp-content/uploads/2021/02/Pioneer-for-Science-Highlights.png" link="#"]Figure 23. Weekly average air-sea CO2 flux estimated for the Pioneer Array Inshore, Central and Offshore moorings during 2016 and 2017. A negative flux is from the atmosphere to the ocean. From Thorson and Eveleth (2020).[/media-caption]In the summer of 2020 the Rutgers University Ocean Data Labs project worked with the Rutgers Research Internships in Ocean Science to support ten undergraduate students in a virtual Research Experiences for Undergraduates program. Two weeks of research methods training and Python coding instruction was followed by six weeks of independent study with a research mentor.
Dr. Rachel Eveleth (Oberlin College) was one of those mentors. Already using some of the Data Labs materials in her undergraduate oceanography course, she saw an opportunity to leverage the extensive OOI data holdings to engage students in cutting edge research on a limited budget during a time when her own field work was curtailed due to the COVID-19 pandemic. Dr. Eveleth advised Alison Thorson from Sarah Lawrence College (NY) and Brianna Velasco form Humboldt State University (CA) on the study of air-sea fluxes of CO2 on the US east and west coast, respectively.
Preliminary results were presented at the 2020 Fall AGU meeting. A poster authored by Thorson and Eveleth (ED037-0035) evaluated pCO2 data from the three Pioneer Array Surface Moorings during 2016 and 2017. They showed that the annual mean CO2 flux across all three sites for the two years was negative, meaning that the continental shelf acts as a sink of atmospheric carbon. The annual average flux was -0.85 to -1.6 mol C/(m2 yr), but the flux varied significantly between mooring sites and between years (Figure 23). Investigation of short-term variability in pCO2 concentration concurrent with satellite imagery of SST and Chlorophyll was consistent with temperature-driven, but biologically damped, changes.
[media-caption path="https://oceanobservatories.org/wp-content/uploads/2021/02/Pioneer-for-Science-Highlights.png" link="#"]Figure 24. Hourly (dots) and monthly (lines) average air and water CO2 concentration observed at the Endurance Array Washington Offshore mooring during 2016 and 2017. From Velasco et al. (2020).[/media-caption]A poster by Velasco, Eveleth and Thorson (ED004-0045) analyzed pCO2 data from the Endurance Array offshore mooring. Three years of nearly continuous data were available during 2016-2018. The seasonal cycle showed that the pCO2 concentration in water was relatively stable and near equilibrium with the air in winter, decreasing in late spring and summer (Figure 24). Short-term minima in summer were as low as 150 uatm. Like the east coast, the mean air-sea CO2 flux was consistently negative, meaning the coastal ocean acts as a carbon sink. The annual means at the Washington Offshore mooring for 2016, 2017 were -1.9 and -2.1 mol C/(m2 yr), respectively. The seasonal cycle appears to be strongly driven by non-thermal factors (on short time scales), presumably upwelling events and algal blooms.
These studies, although preliminary, are among the first to use multi-year records of in-situ CO2 flux from the OOI coastal arrays, and to our knowledge the first to compare such records between the east and west coast. Dr. Eveleth’s team intends to use the rich, complementary data set available from the OOI coastal arrays to investigate the mechanisms controlling variability and role of biological vs physical drivers.
Read More
Delineating Biochemical Processes in the Northern California Upwelling System
Excerpted from the OOI Quarterly Report, 2022.
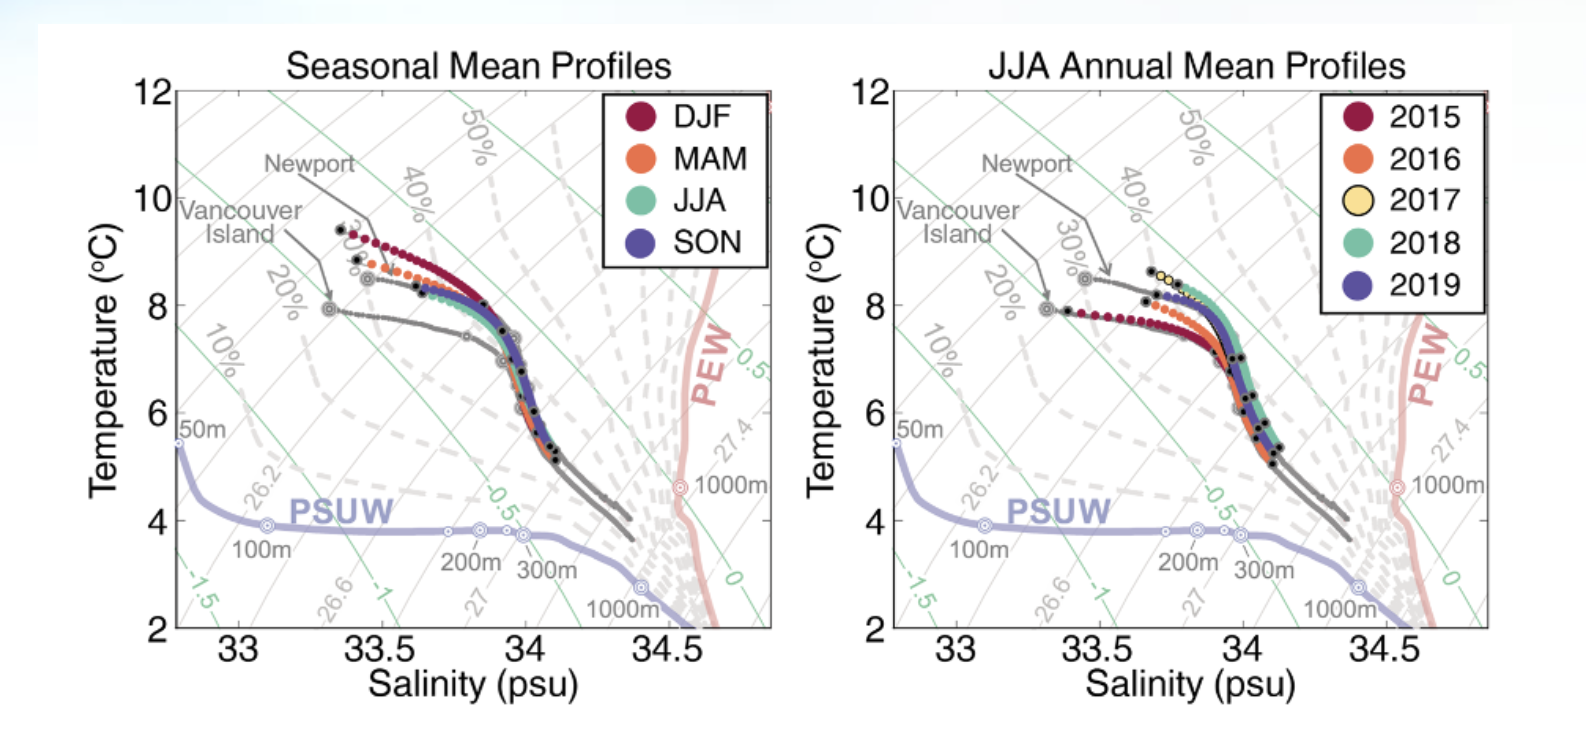
[media-caption path="/wp-content/uploads/2020/10/Endurance-Array-Science-Highlight.png" link="#"]Figure 19: Regional T/S variability at the Washington offshore profiling mooring. The end member Pacific Subarctic Upper Water (PSUW) and Pacific Equatorial Water (PEW) masses are indicated on each plot at the left and right respectively. T/S at the mooring is a mixture of PSUW and PEW. The left plot shows the seasonal variability. The right plot shows interannual variability in summer. Interannual variability from 100-250m exceeds seasonal variability. In 2015, T/S at the mooring is closer in character to climatological averages at Vancouver Island, BC while in 2018, T/S at the mooring is similar to that south of Newport, OR. Figure from Risien et al. adapted from Thomson and Krassovski (2010).[/media-caption]
Risien et al. (2020) presented over five years of observations from the OOI Washington offshore profiling mooring. First deployed in 2014, the Washington offshore profiler mooring is on the continental slope about 65 km west of Westport, WA. Its wire Following Profiler samples the water column from 30 m depth down to 500 m, ascending and descending three to four times per day. Traveling at approximately 25 cm/s, the profiler carries physical (temperature, salinity, pressure, and velocity) and biochemical (photosynthetically active radiation, chlorophyll, colored dissolved organic matter fluorescence, optical backscatter, and dissolved oxygen) sensors. The data presented included more than 12,000 profiles. These data were processed using a newly developed Matlab toolbox.
The observations resolve biochemical processes such as carbon export and dissolved oxygen variability in the deep source waters of the Northern California Upwelling System. Within the Northern California Current System, over the slope there is a large-scale north-south variation in temperature and salinity (T/S). Regional T/S variability can be understood as a mixing between warmer, more saline Pacific Equatorial Water (PEW) to the south, and fresher, colder Pacific Subarctic Upper Water (PSUW) to the north. Preliminary results show significant interannual variability of T/S water properties between 100-250 meters. In summer, interannual T/S variability is larger than the mean seasonal cycle (see Fig 19). While summer T/S variability is greatest on the interannual scale, T/S does covary on a seasonal scale with dissolved Oxygen (DO), spiciness and Particulate Organic Carbon (POC). In particular, warmer, more saline water is associated with lower DO in fall and winter.
Risien, C.M., R.A. Desiderio, L.W. Juranek, and J.P. Fram (2020), Sustained, High-Resolution Profiler Observations from the Washington Continental Slope , Abstract [IS43A-05] presented at Ocean Sciences Meeting 2020, San Diego, CA, 17-21 Feb.
Thomson, R. E., and Krassovski, M. V. (2010), Poleward reach of the California Undercurrent extension, J. Geophys. Res., 115, C09027, doi:10.1029/2010JC006280.
Read More
From Whale Songs to Volcanic Eruptions: OOI’s Cable Hears the Sounds of the Ocean
Sound is omnipresent in the ocean. Human-induced noise has the potential to affect marine life.
After the global recession in 2008, the ocean became quieter as shipping declined. Off the coast of Southern California, for example, scientists at Scripps Institution of Oceanography found that noise amplitudes measured from 2007-2010 were lowered by 70 percent with a reduction in one ship contributing about 10 percent.
A similar quieting of the ocean can be expected as global ship traffic continues its decline in response to the corona virus pandemic. This quieter ocean offers scientists ways to expand their ongoing research on ocean sound and its impact on marine life.
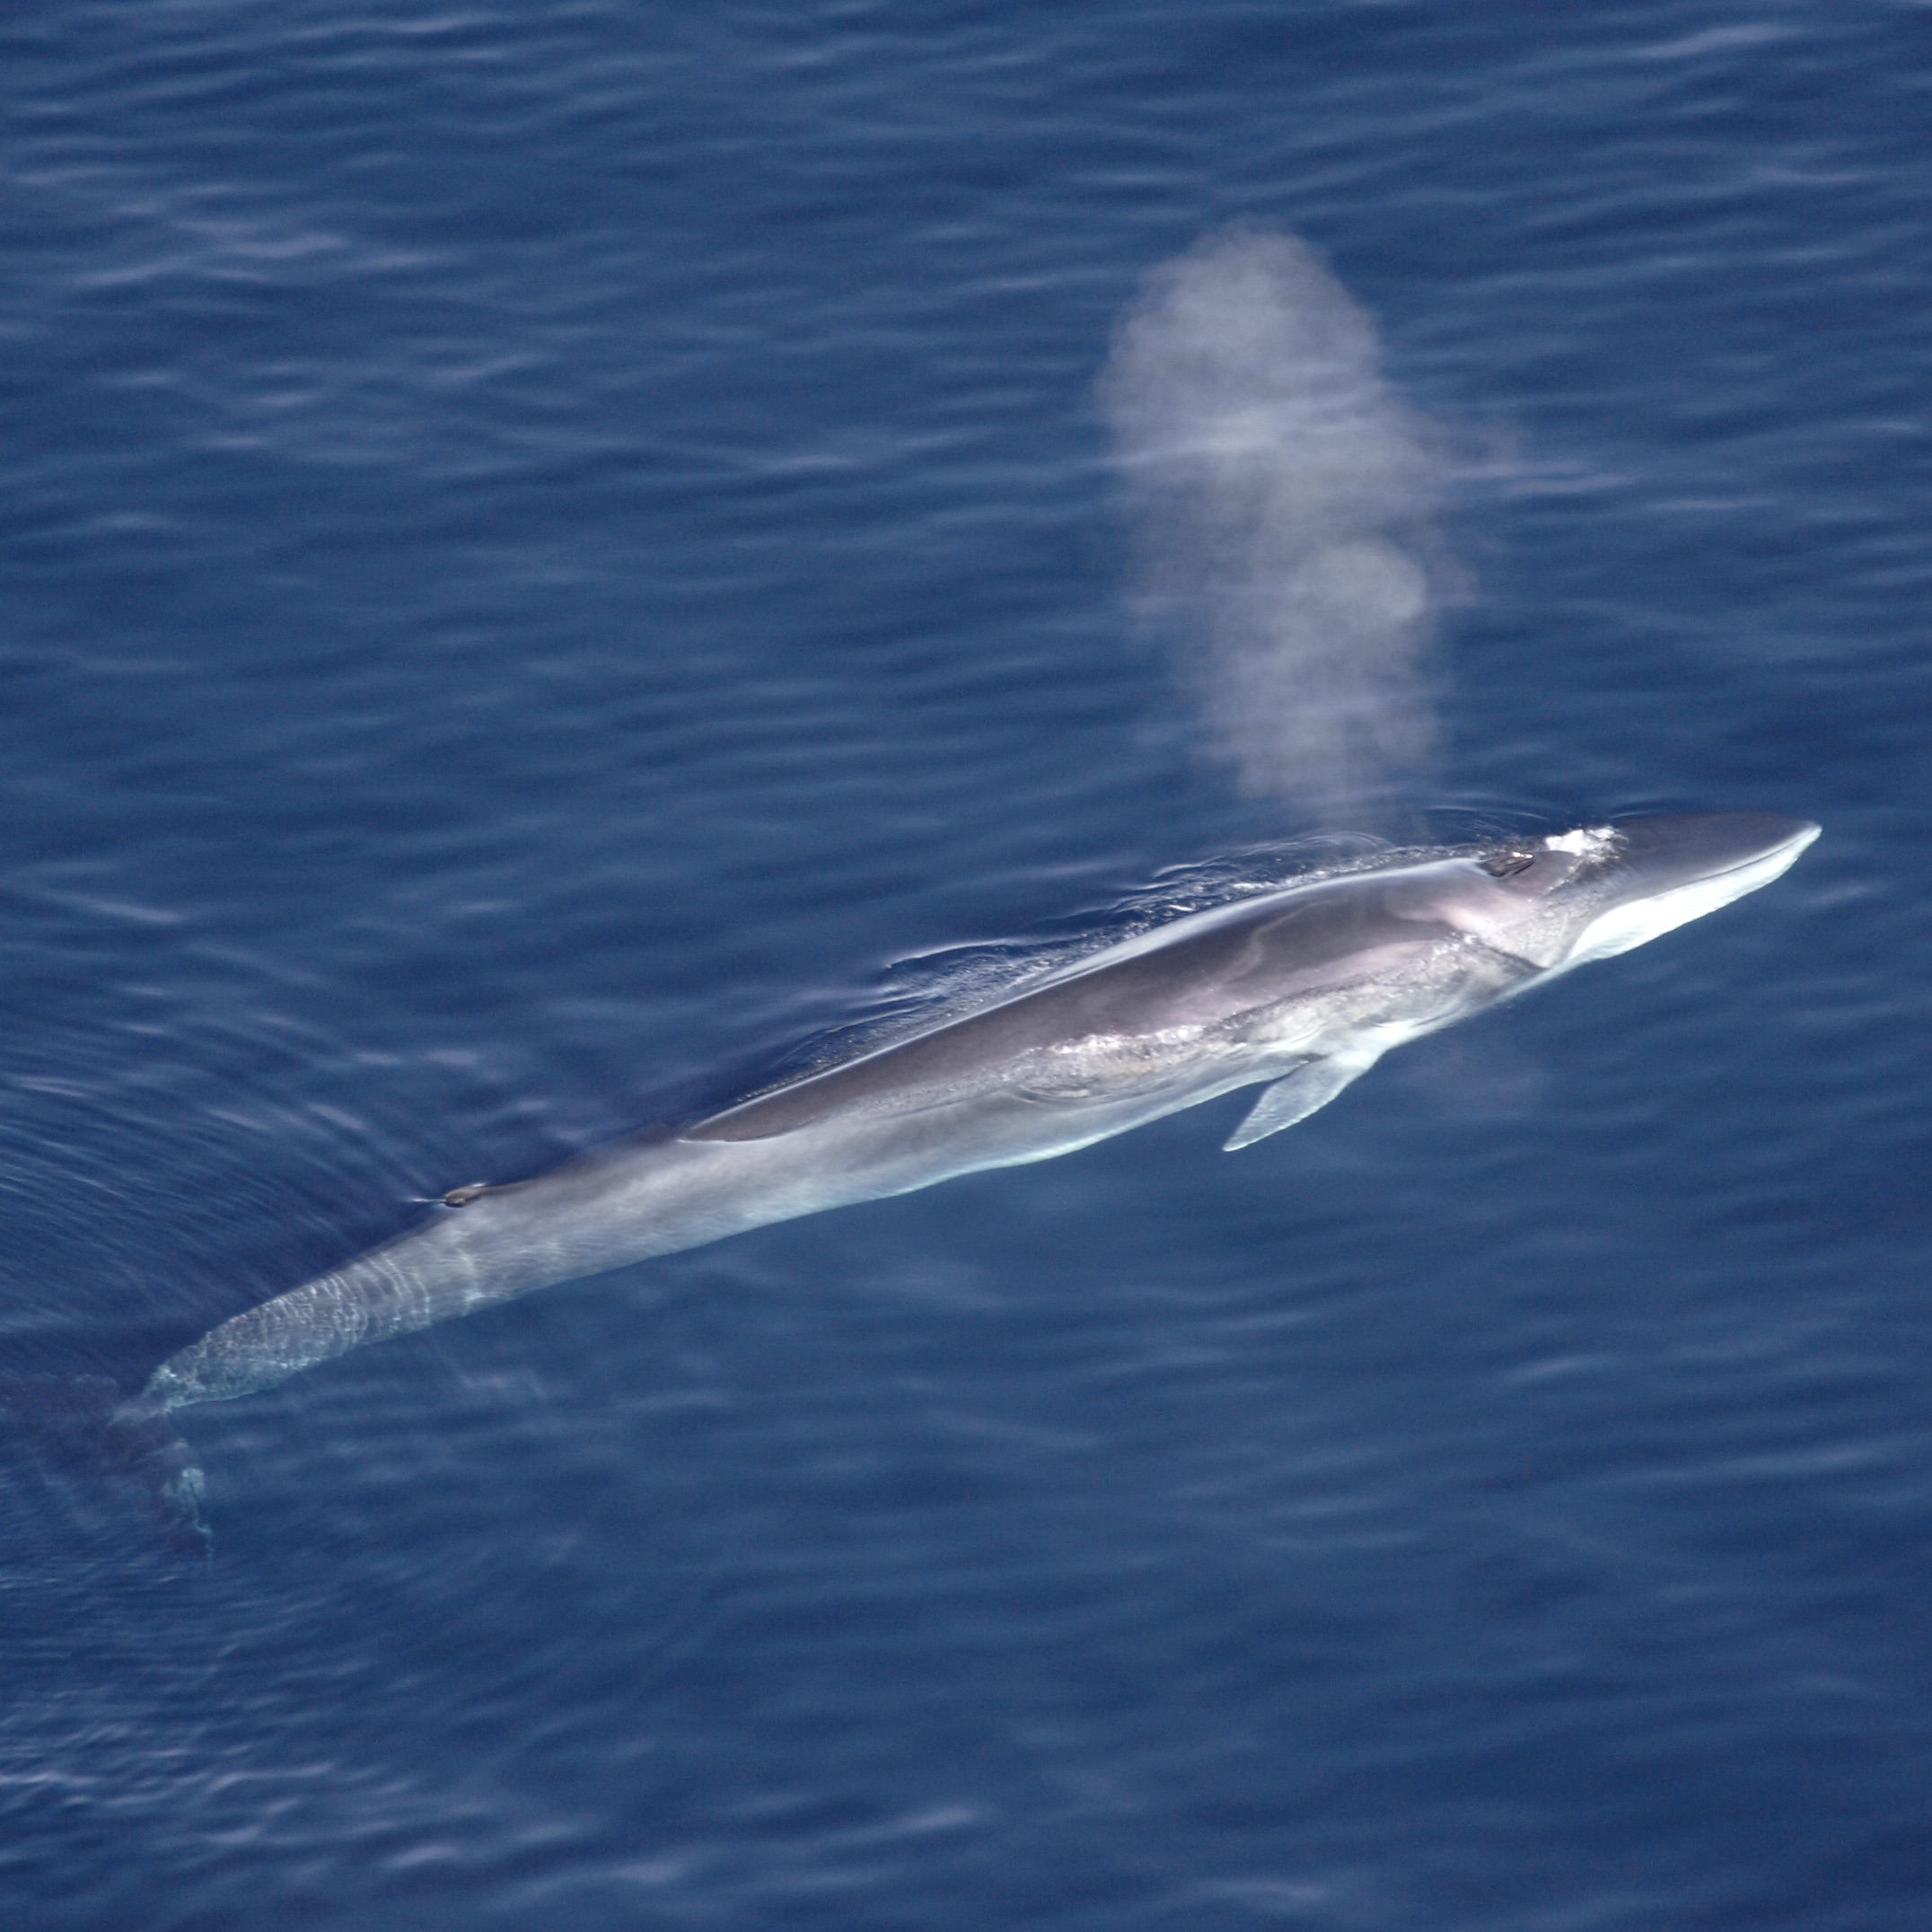
[media type="image" path="https://oceanobservatories.org/wp-content/uploads/2020/04/Finhval_1.jpg" link="#" alt="Fin Whale"][/media]“It takes time to document real change in the ocean, but University of Washington oceanographers have reported that over the past decade, fin whales have been communicating more softly in the Pacific,“ said Deborah Kelley, professor of oceanography at the University of Washington and director of the OOI’s Regional Cabled Array (RCA) component. “A quieter ocean allows us to hear more clearly life and other natural processes within the ocean.”
Years of listening to whales
John Ryan, a biological oceanographer at the Monterey Bay Aquarium Research Institute (MBARI), has been “listening in” on whales and other marine creatures since 2015 using a hydrophone on the Monterey Accelerated Research System (MARS), a cabled observatory, which was in part established as a test bed for the OOI Regional Cabled Array. Ryan and colleagues studied the occurrence of humpback whale (Megaptera novaeangliae) song in the northeast Pacific using three years of continuous recordings off the coast of central California.
[media type="image" path="https://oceanobservatories.org/wp-content/uploads/2020/04/Humpback_Whale_underwater_shot.jpg" link="#" alt="Humpback Whale"][/media]“We’ve been listening almost continuously since July 28, 2015, using a broadband, digital, omnidirectional hydrophone connected to MARS. Listening continuously for that long at such a high sample rate is not easy; only by being connected to the cable is this possible,” explained Ryan.
The researchers were able to discern whale songs from the busy ocean soundscape in Monterey Bay National Marine Sanctuary, which is a feeding and migratory habitat for humpback whales. The humpbacks’ song was detectable for nine months of the year (September–May) and peaked during the winter months of November through January. The study revealed strong relationships between year-to-year changes in the levels of song occurrence and ecosystem conditions that influence foraging ecology. The lowest song occurrence coincided with anomalous warm ocean temperatures, low abundances of krill – a primary food resource for humpback whales, and an extremely toxic harmful algal bloom that affected whales and other marine mammals in the region. Song occurrence increased with increasingly favorable foraging conditions in subsequent years.
Because the hydrophone is on the cabled observatory, its operation can be adjusted to achieve new goals. For example, the sampling rate of the hydrophone was doubled during an experiment that successfully detected very high frequency echolocation clicks of dwarf sperm whales (with Karlina Merkens, National Oceanic and Atmospheric Administration). “And that’s a beautiful aspect of being on the cable,” added Ryan. “Not only do we know that it is working, we catch any network glitches pretty quickly so we don’t lose data, and we can do real-time experiments like these.”
William Wilcock of the University of Washington and his students have compiled a decade worth of data on fin whales in the northern Pacific. Fin whales call at about 20 HZ, which is too low of a frequency for humans to hear, but perfect for seismometers to record. The researchers aggregated ten years of data from both temporary recorders and now permanent RCA hydrophones and seismic sensors and looked at the frequency of the calls and calling intervals. The researchers found both have changed over time.
The fin whales call seasonally and the frequency of the calls has gone down with time.
[audio mp3="https://oceanobservatories.org/wp-content/uploads/2020/04/Fin_whale_10x.mp3"][/audio]Calls peak in late fall, early winter in relation to mating season. Gradually through the season the frequency decreases. At the start of the next season, the call frequency jumps up again, but not quite to where it was the year before. Over ten years, the frequency has gone down about 2 HZ, and scientists are puzzled as to why this is occurring. It is unlikely to be due to increasing ship noise, because this lower sound frequency is getting closer to the range of the noise level of container ship propellers, about 6-10 HZ.
In some settings, ship noise is known to affect whale behavior and the permanent network of hydrophones operated by the OOI and Ocean Networks Canada will provide an opportunity to study whether whales are avoiding the shipping lanes to Asia.
Volcanoes also rumble in the deep
Whale sounds are but one of many acoustic signals being recorded and monitored using hydrophones and broadband seismometers. The OOI’s RCA off the Oregon Coast includes 900 kilometers (~560 miles) of submarine fiber-optic cables that provide unprecedented power, bandwidth, and communication to seafloor instrumentation and profiler moorings that span water depths of 2900 m to 5 m beneath the ocean surface. Using a suite of instruments connected to the cable, which continuously stream data in real time, scientists are listening in on the sounds of submarine volcanism, which accounts for more than 80 percent of all volcanism on Earth.
More than 300 miles off the Oregon coast in 1500 meters of water, 20+ cabled seafloor instruments are located at the summit of Axial Seamount, the most active volcano on the Juan de Fuca Ridge, including hydrophones and seismometers, which can also record sounds in the ocean.
“Scientists were able to hear(as acoustic noises traveling through the crust) >8000 earthquakes that marked the start of the Axial eruption in 2015. Coincident with this seismic crisis bottom pressure tilt instruments showed that the seafloor fell about 2.4 meters (~8 feet).
[video width="670" height="384" m4v="https://oceanobservatories.org/wp-content/uploads/2020/04/Axial-seamount-audio-.m4v"][/video]It was a remarkable collaborative event with scientists from across the country witnessing the eruption unfold live,” added Kelley. Such real-time documenting of an eruption in process was possible because of how Axial is wired. It is the only place in the oceans where numerous processes taking place prior to, during, and following a submarine eruption are captured live through data streaming 24/7. William Wilcock, University of Washington, and Scott Nooner, University of North Carolina, Wilmington, and colleagues reported these findings in Science, 2016.
Data collected from the hydrophones at the seamount’s base supported another discovery about Axial, indicating that it explosively erupted in 2015. Hydrophones recorded long-duration diffusive signals traveling through the ocean water consistent with explosion of gas-rich lavas, similar to Hawaiian style fissure eruptions. Follow-on cruises documented ash on some RCA instruments, again indicating the likelihood of explosive events during the 2015 eruption.
“Having the opportunity to listen in while a submarine volcano is active offers a really interesting window into things,” said Jackie Caplan-Auerbach, associate dean at Western Washington University and lead author of a G-cubed article that reported the possible eruptive findings. “While we cannot say with utter certainty that there were explosions at Axial, there’s a lot of evidence that supports this. We know from having listened to other eruptions that this was the same type of sound. It’s distinct, like the hissing sound of a garden hose on at top speed. We also found these really fine particulates, which could only have resulted from an eruption, had collected on one of the instruments at the site.”
[audio wav="https://oceanobservatories.org/wp-content/uploads/2020/04/axial_explosive.wav"][/audio]Added Caplan-Auerbach, “My favorite part of having OOI is it offers an ability for pure discovery. Its real time nature makes it possible to observe and see what happens. And sometimes the planet just hands you a gift that you didn’t expect. Not always being hypothesis driven is a very valuable aspect of science that I hope does not get lost. I’m very appreciative of projects like this that open our eyes into signals that we didn’t know were there.”
More opportunities to expand knowledge about sound and the sea are on the horizon. The US. Navy has funded Shima Abadi, University of Washington, Bothell, for a comprehensive study of sounds recorded by the OOI hydrophones. Stay tuned!
Image credits: Top fin whale: Wikipedia, Aqqa Rosing-Asvid – Visit Greenland. Second from top: humpback whale: Public domain, National Oceanic and Atmospheric Administration.
Read More
Time Series Allows Investigation of Wind Forcing and Physical and Bio-Optical Variability
From Dever et al., 29 September 2019
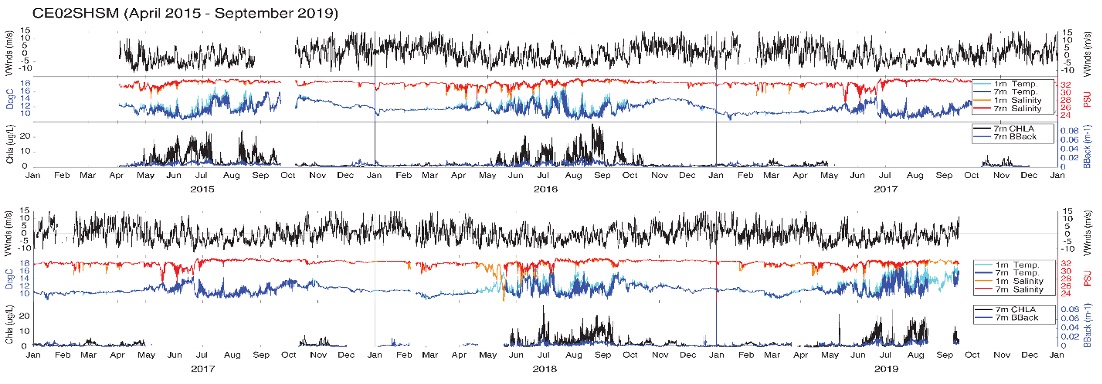
The full scope of OOI Endurance Array surface moorings has been deployed since April 2015. The moorings are deployed off Grays Harbor, Washington and Newport, Oregon at inner shelf, shelf and slope depths. They include surface meteorology, physical oceanographic, chemical and biological sensors. During the summer of 2019, EA staff reviewed mooring data since inception. In September 2019, we presented a poster of these data at the annual Eastern Pacific Ocean Conference (EPOC). The objectives of the poster were to show the time series data and discuss their availability and quality issues with research community members. To stimulate discussion, we reported on seasonal variability in wind forcing, water temperature, and chl-a fluorescence. We described the mooring measurements and how to access the data.
The Oregon and Washington shelves are part of the northern California Current Marine Ecosystem. They exhibit characteristic responses to spring and summer upwelling winds and winter storms. In the above figure, we show representative time series of near surface measurements at the Oregon shelf mooring since its start in April 2015 through the present. As part of the poster, we also presented similar data from the other OOI surface moorings and calculated lagged correlations between wind, temperature, and chlorophyll, and commented on the observed variability.
We also pointed viewers to example Matlab and Python scripts to download and plot the OOI data presented in the poster via the Machine to Machine (M2M) interface on the OOI Data Portal.
Read MoreGlider Observations Provide Insight into Spatial Patterns in Satellite Bio-Optical Measurements
From Henderikx et al., 9 February 2018
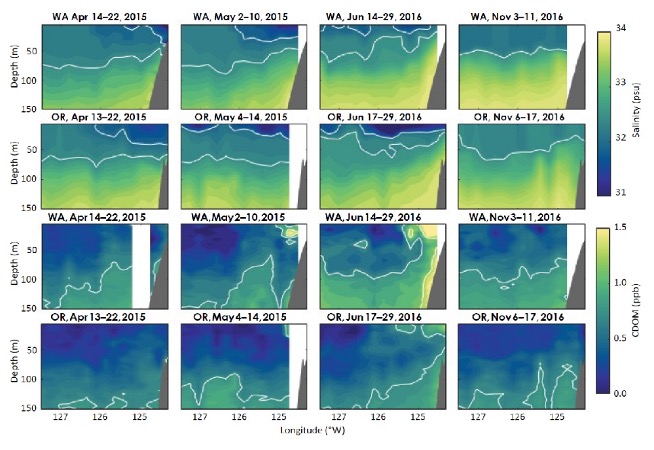
Hendrikx Freitas et al., 2018 compare satellite and Endurance Array glider estimates of chromophoric dissolved organic matter (CDOM) to characterize seasonal patterns and latitudinal and cross-shore gradients in particle concentrations between the Washington and Oregon shelves. While the Oregon and Washington shelves are both highly productive regions of the northern California Current Ecosystem, there are significant differences in the physical processes, with the central Washington shelf generally subject to weaker upwelling and a stronger Columbia River influence. The difference in physical forcing is reflected in satellite estimates of chlorophyll, which show higher concentrations off the Washington coast.
The conclusions from satellites contrast with in situ observations from gliders. Despite the differences in physical forcing, Henderikx et al., 2018 find OOI glider fluorescence based measurements of chlorophyll to be similar in magnitude across the Oregon and Washington shelves. Their research suggests that latitudinal differences in CDOM may be a partial explanation for perceived trends in satellite-derived chlorophyll. The OOI gliders gather simultaneous chlorophyll and CDOM fluorescence from an integrated three-channel sensor. While the glider observations indicate similar levels of chlorophyll fluorescence, they also show an increased presence of suspended sediments and CDOM off WA. The OOI observations, although temporally limited, indicate potential contamination of satellite retrievals of chlorophyll due to CDOM and suspended materials in the water column, particularly off the WA shelf, that should caution further attribution of satellite chlorophyll signals to differences in production.
Read More
