
Posts Tagged ‘Coastal Endurance Array’
Effects of Dissolved Oxygen and Hypoxia on Catch Rates of Nearshore Groundfishes in a Recreational Hook and Line Fishery
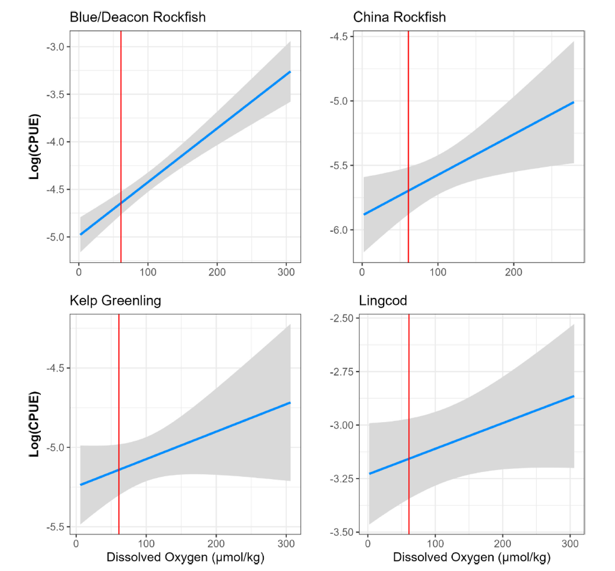
Rasmuson et al. (2026) investigate the impact of hypoxic events on a nearshore, multispecies recreational groundfish fishery along the Oregon coast. Using dissolved oxygen (DO) data from the National Science Foundation’s Ocean Observatories Initiative (OOI) Oregon Inshore Mooring (2018–2022, excluding 2020) and trip-level recreational fishery catch data from the Oregon Department of Fish and Wildlife, they modeled catch-per-unit-effort (CPUE) and species encounter rates as functions of DO and regulatory bag limits. Of the 709 days analyzed, 36.8% were characterized as hypoxic (DO < 61 μmol/kg). Of the 4 years, 2021 had the most severe hypoxia and 2019 had the least. Across all trips, CPUE and average number of species encountered generally declined during hypoxic periods, indicating reduced fishing success. However, species-specific responses varied: some, such as blue/deacon and China rockfish (see Fig. 2), showed increased CPUE with higher DO levels, while others like cabezon and quillback rockfish were more frequently caught during hypoxic events. These patterns suggest that hypoxia alters species’ availability and/or catchability, possibly due to shifts in fish behavior, vertical distribution, or tolerance to low DO. Notably, species with increased CPUE under hypoxia are already considered vulnerable or limiting for the Oregon recreational fishery, raising concerns about increased pressure on sensitive stocks. As hypoxic events become more frequent with climate change, incorporating DO metrics into stock assessments and fisheries management would improve population models for exploited species. Their findings highlight the need for fine-scale, species-specific approaches to recreational fisheries management in the context of changing ocean conditions and suggest that recreational fishers may face constraints in adapting to deoxygenation, especially in strongly place-based or single-species fisheries.
[caption id="attachment_37790" align="alignnone" width="615"] Figure (1) Log (CPUE) for four different species versus DO. Species depicted are those with best-fit Gaussian models that included DO. Gray areas are 95% confidence intervals. Data to the left of the red vertical bar indicate hypoxic conditions and to the right indicate normoxic conditions.[/caption]
___________________
Reference:
Rasmuson, L. K., A. D. Whitman, B. T. Cervantes, and J. P. Fram. 2026. “ Effects of Dissolved Oxygen and Hypoxia on Catch Rates of Nearshore Groundfishes in a Recreational Hook and Line Fishery.” Fisheries Oceanography 1–13. https://doi.org/10.1111/fog.70046.
Read MoreNSF Advances Endurance Array Redeployment
The U.S. National Science Foundation (NSF) has begun the phased redeployment of its Ocean Observatories Initiative (NSF OOI) Endurance Array, restoring critical ocean observations following planned maintenance and servicing.
The redeployment of gliders this summer will restore seasonal observations, enabling scientists to monitor seasonal hypoxia over the central Oregon and Washington shelves. The gliders will also capture changing ocean conditions as El Niño is expected to develop later this year, bringing warmer waters and a deeper thermocline to the region. NSF OOI glider data are available in near real time through the OOI Data Explorer and the national Glider Data Assembly Center (GDAC).
Looking ahead, several moorings are scheduled for redeployment aboard the R/V Revelle in early October, including the Oregon and Washington Shelf surface moorings and the Washington Offshore Profiler Mooring. Redeploying these moorings ahead of the developing El Niño will restore continuous observations of winds, waves, and water column conditions throughout the fall and winter. Data from the redeployed moorings will be available on the OOI Data Explorer and the Northwest Association of Networked Ocean Observing Systems NANOOS; meteorological data will also be available through the NOAA National Data Buoy Center (NDBC).
Planning is also underway for redeployments in the spring of 2027 that will fully restore mooring and glider operations across the Endurance Array.
In parallel with redeployment efforts, the Endurance Array team continues to support the broader ocean observing community through scientific leadership. Project Scientist Ed Dever is chairing a session “Ocean Observing Systems at a Crossroads: Accomplishments, Innovations, & Vision” at the Eastern Pacific Ocean Conference.
Dever is also co-convening the Fall 2026 AGU session “Long-Term Ocean Observatories as Drivers of Sensor & Data Science Innovation” with Mike Vardaro and Wendi Ruef of the University of Washington Regional Cabled Array.
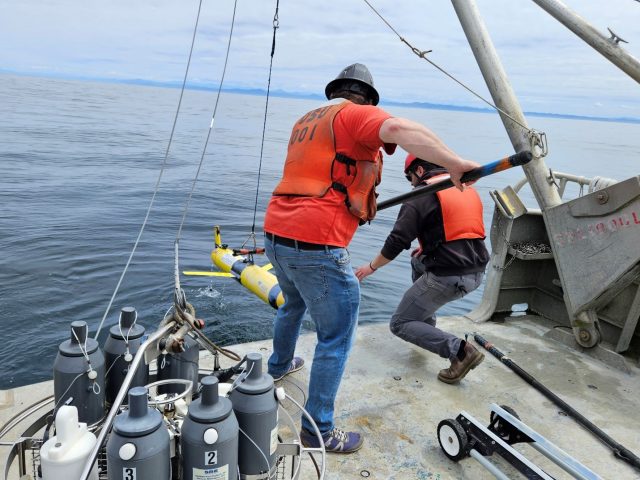
[caption id="attachment_37731" align="alignnone" width="1430"]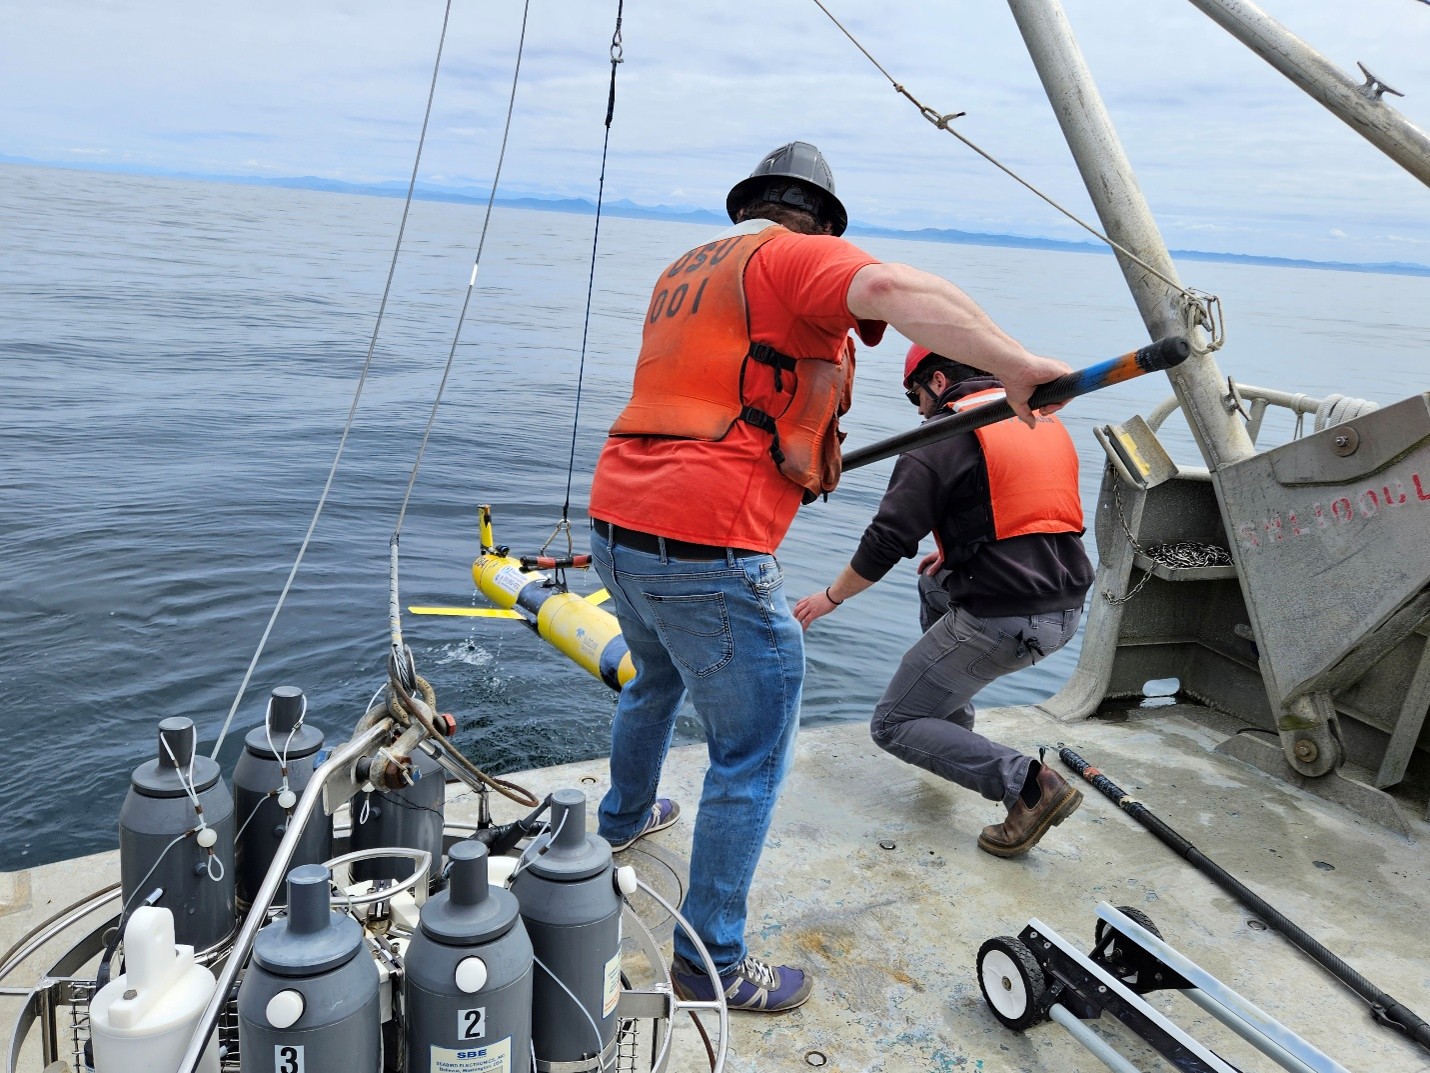 NSF OOI Endurance Array staff recover glider 384 to adjust its ballast before sending it on its mission over the Oregon Shelf. Photo credit: Scarlett Arbuckle (Oregon State University).[/caption]
Read More
NSF OOI Endurance Array staff recover glider 384 to adjust its ballast before sending it on its mission over the Oregon Shelf. Photo credit: Scarlett Arbuckle (Oregon State University).[/caption]
Read More Endurance Array Update: Maintaining Critical Observations off Oregon
The U.S. National Science Foundation (NSF) Ocean Observatories Initiative Endurance Array (EA) continues to adapt to evolving funding conditions while maintaining key ocean observations along the Oregon coast.
In September 2025, NSF allowed the Oregon Shelf mooring to remain in the water through spring 2026, even as most other moorings in the array were paused. Since then, the absence of other moorings has been noticed – local fishermen have reached out with concerns, highlighting how widely these data are used beyond solely the research community.
“We heard directly from fishermen when the data stream went offline,” said Ed Dever, Principal Investigator of the Endurance Array. “That really shows how important these observations are – not just for research, but for real-world decision-making and safety.”
Through additional funding provided under a continuing resolution, the Endurance Array team now plans to recover and redeploy the Oregon Shelf mooring in June 2026 and again in October 2026. These efforts are intended to keep the mooring operational through at least spring 2027.
“Our focus is on continuing operations with the resources we have,” Dever said. “Even maintaining a subset of these observations is critical for the scientific community.”
The current deployment, which began in June 2025, has not been without challenges. In late January 2026, the mooring lost wind turbine charging capability, forcing the team to suspend real-time data transmission to conserve power. Despite this setback, many battery-powered instruments have continued to record data internally, which will be recovered during the upcoming June cruise.
As seasonal conditions improve, increasing solar energy has provided enough power to bring meteorological sensors back online and resume partial real-time data transmission.
In addition to the mooring, NSF has approved continued glider operations along the Newport Line. A glider currently in the water is collecting subsurface measurements, such as temperature, salinity, oxygen, and chlorophyll, and transmitting data in near real time, helping to sustain this long-standing observational record.
“The Newport Line is part of a long-standing time series that predates OOI,” Dever said. “It remains an essential component for understanding variability in the California Current system.”
Together, these efforts reflect a focused strategy: maintaining the most critical observations and preserving long-term data records, even under constrained resources.
“Long-term time series are incredibly valuable,” Dever emphasized. “Once they’re interrupted, you can’t simply recreate them – it’s a permanent loss of insight into how the ocean is changing.”
[caption id="attachment_37561" align="alignnone" width="2560"]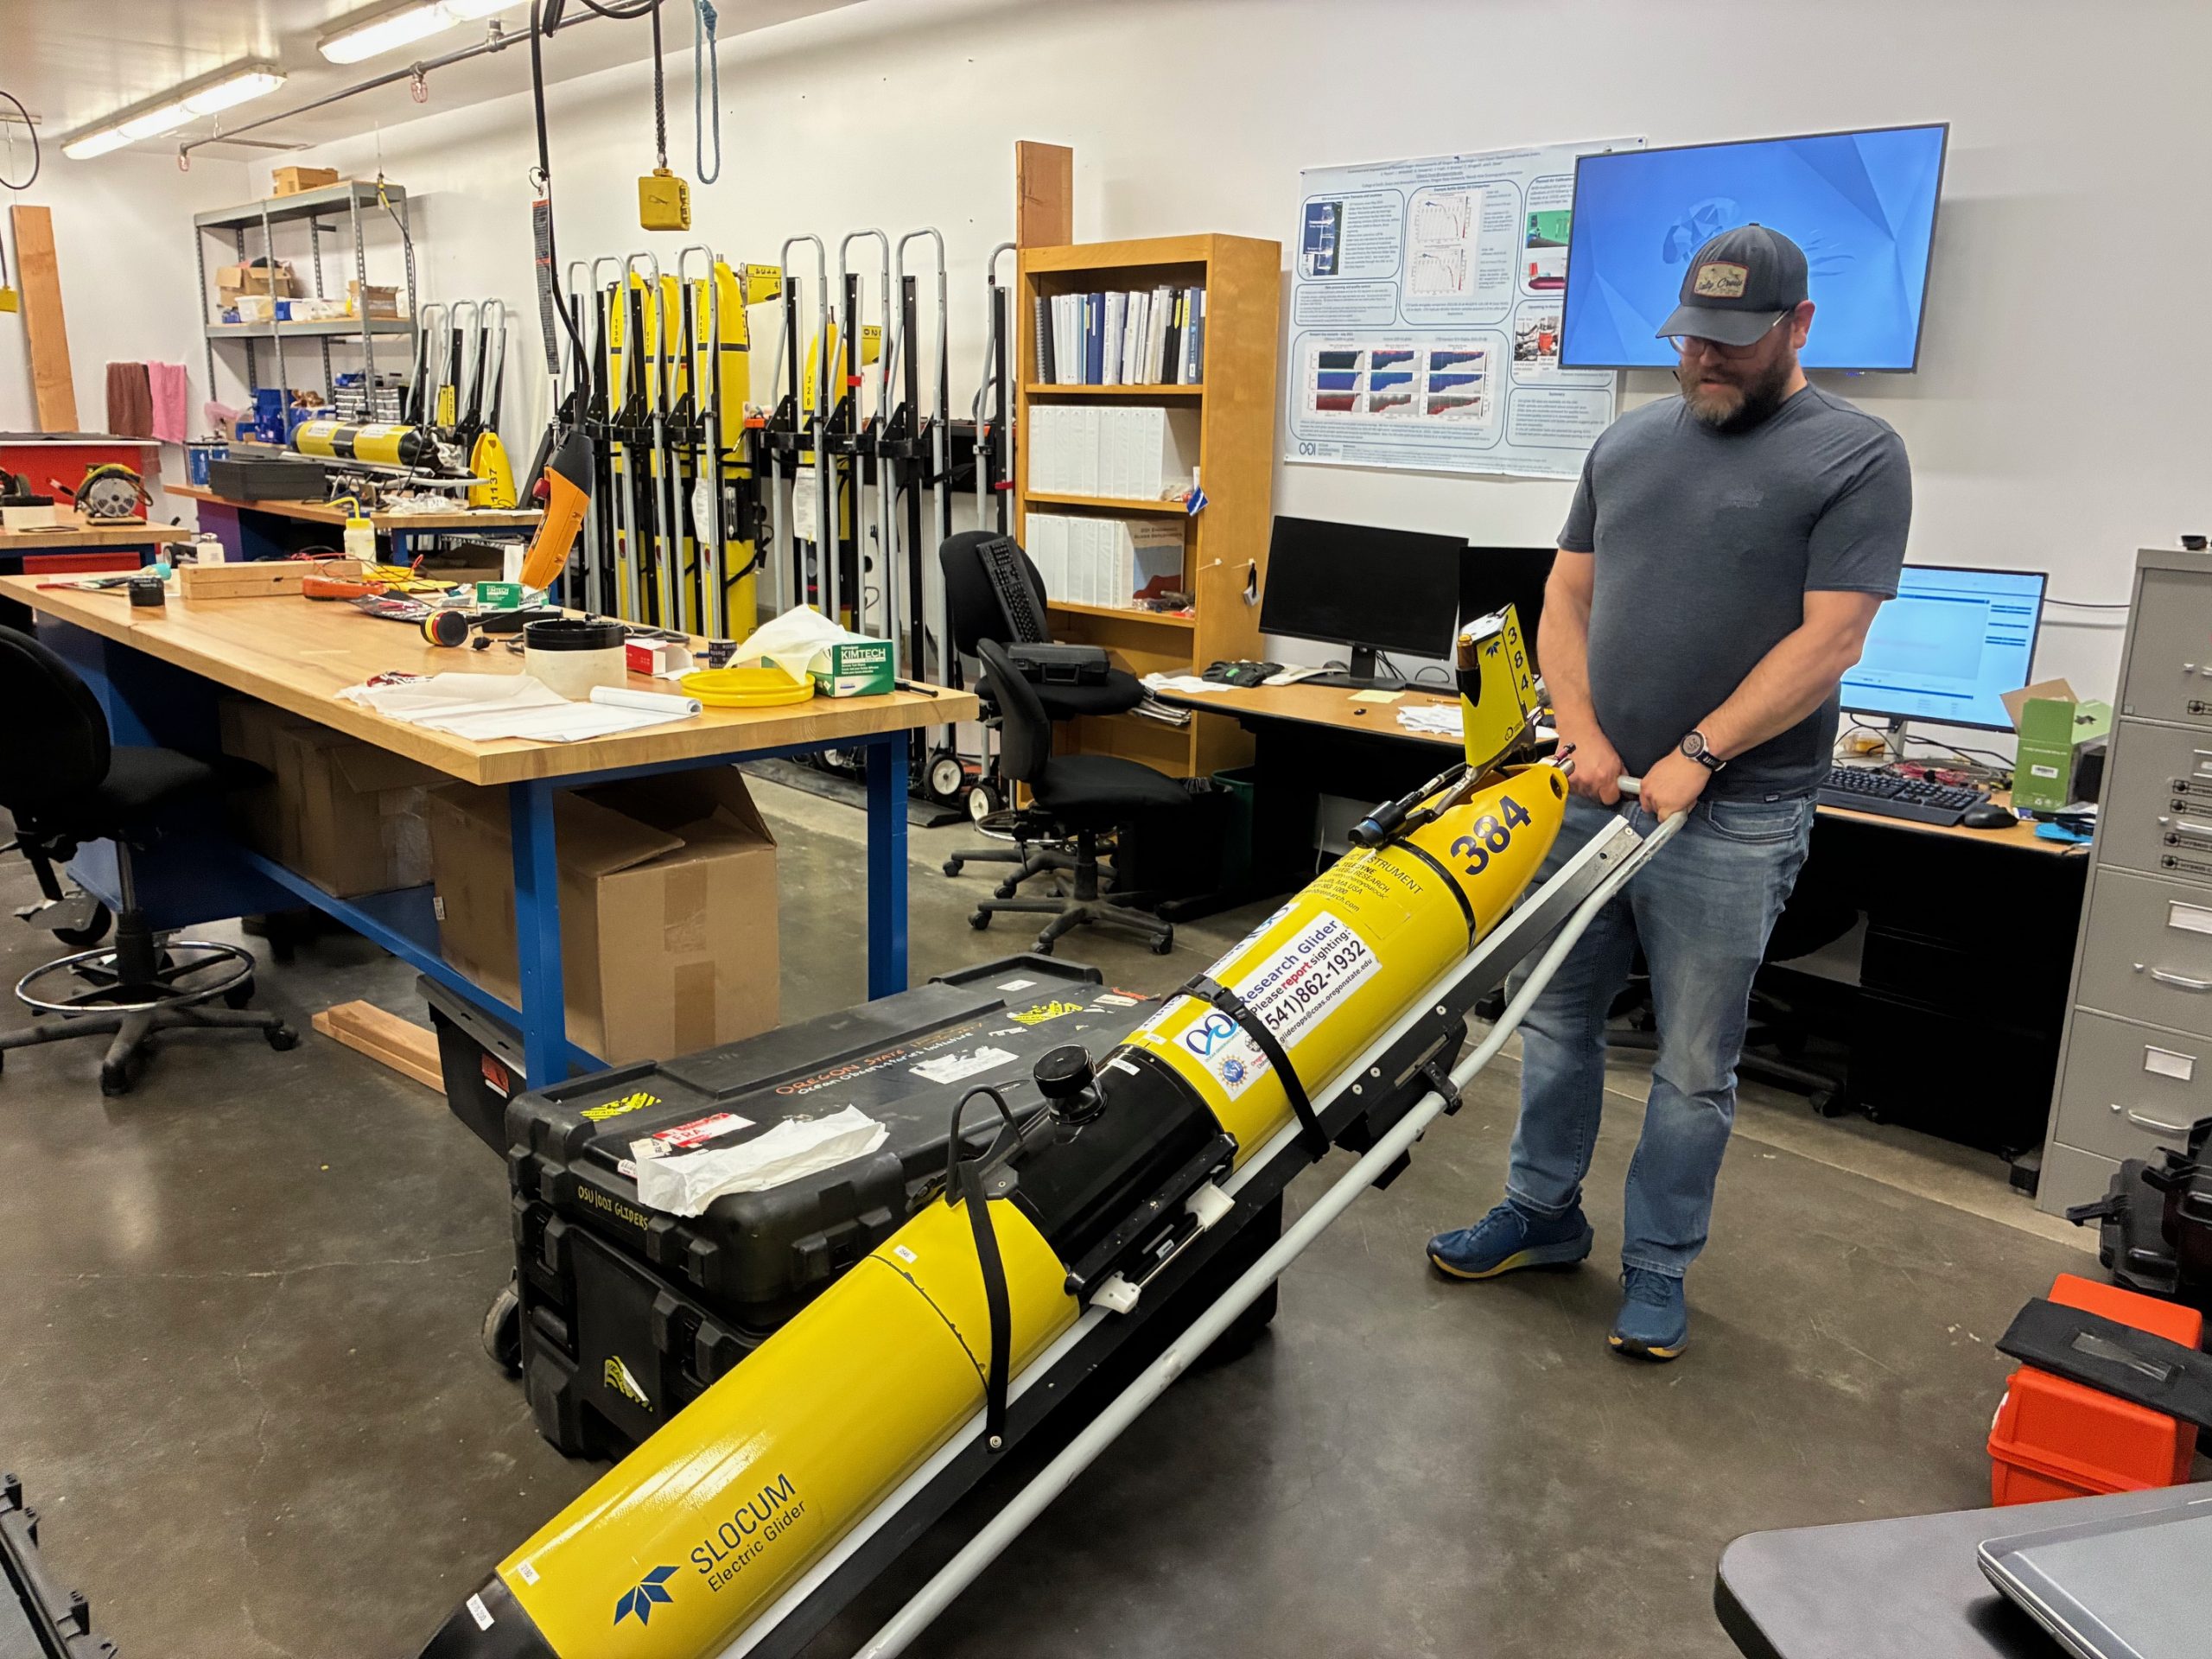 Glider technician Stuart Pearce with glider prepped for deployment on the Newport line. This glider is ready to deploy in the spring prior to the June 2026 cruise. Photo credit: Ed Dever, OSU[/caption]
[caption id="attachment_37560" align="alignnone" width="2560"]
Glider technician Stuart Pearce with glider prepped for deployment on the Newport line. This glider is ready to deploy in the spring prior to the June 2026 cruise. Photo credit: Ed Dever, OSU[/caption]
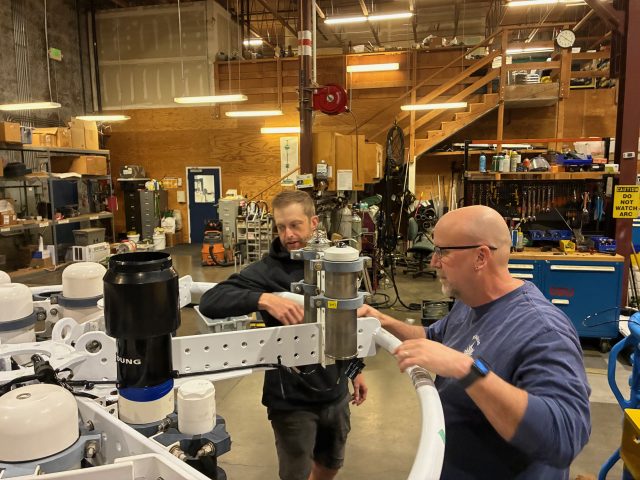
[caption id="attachment_37560" align="alignnone" width="2560"]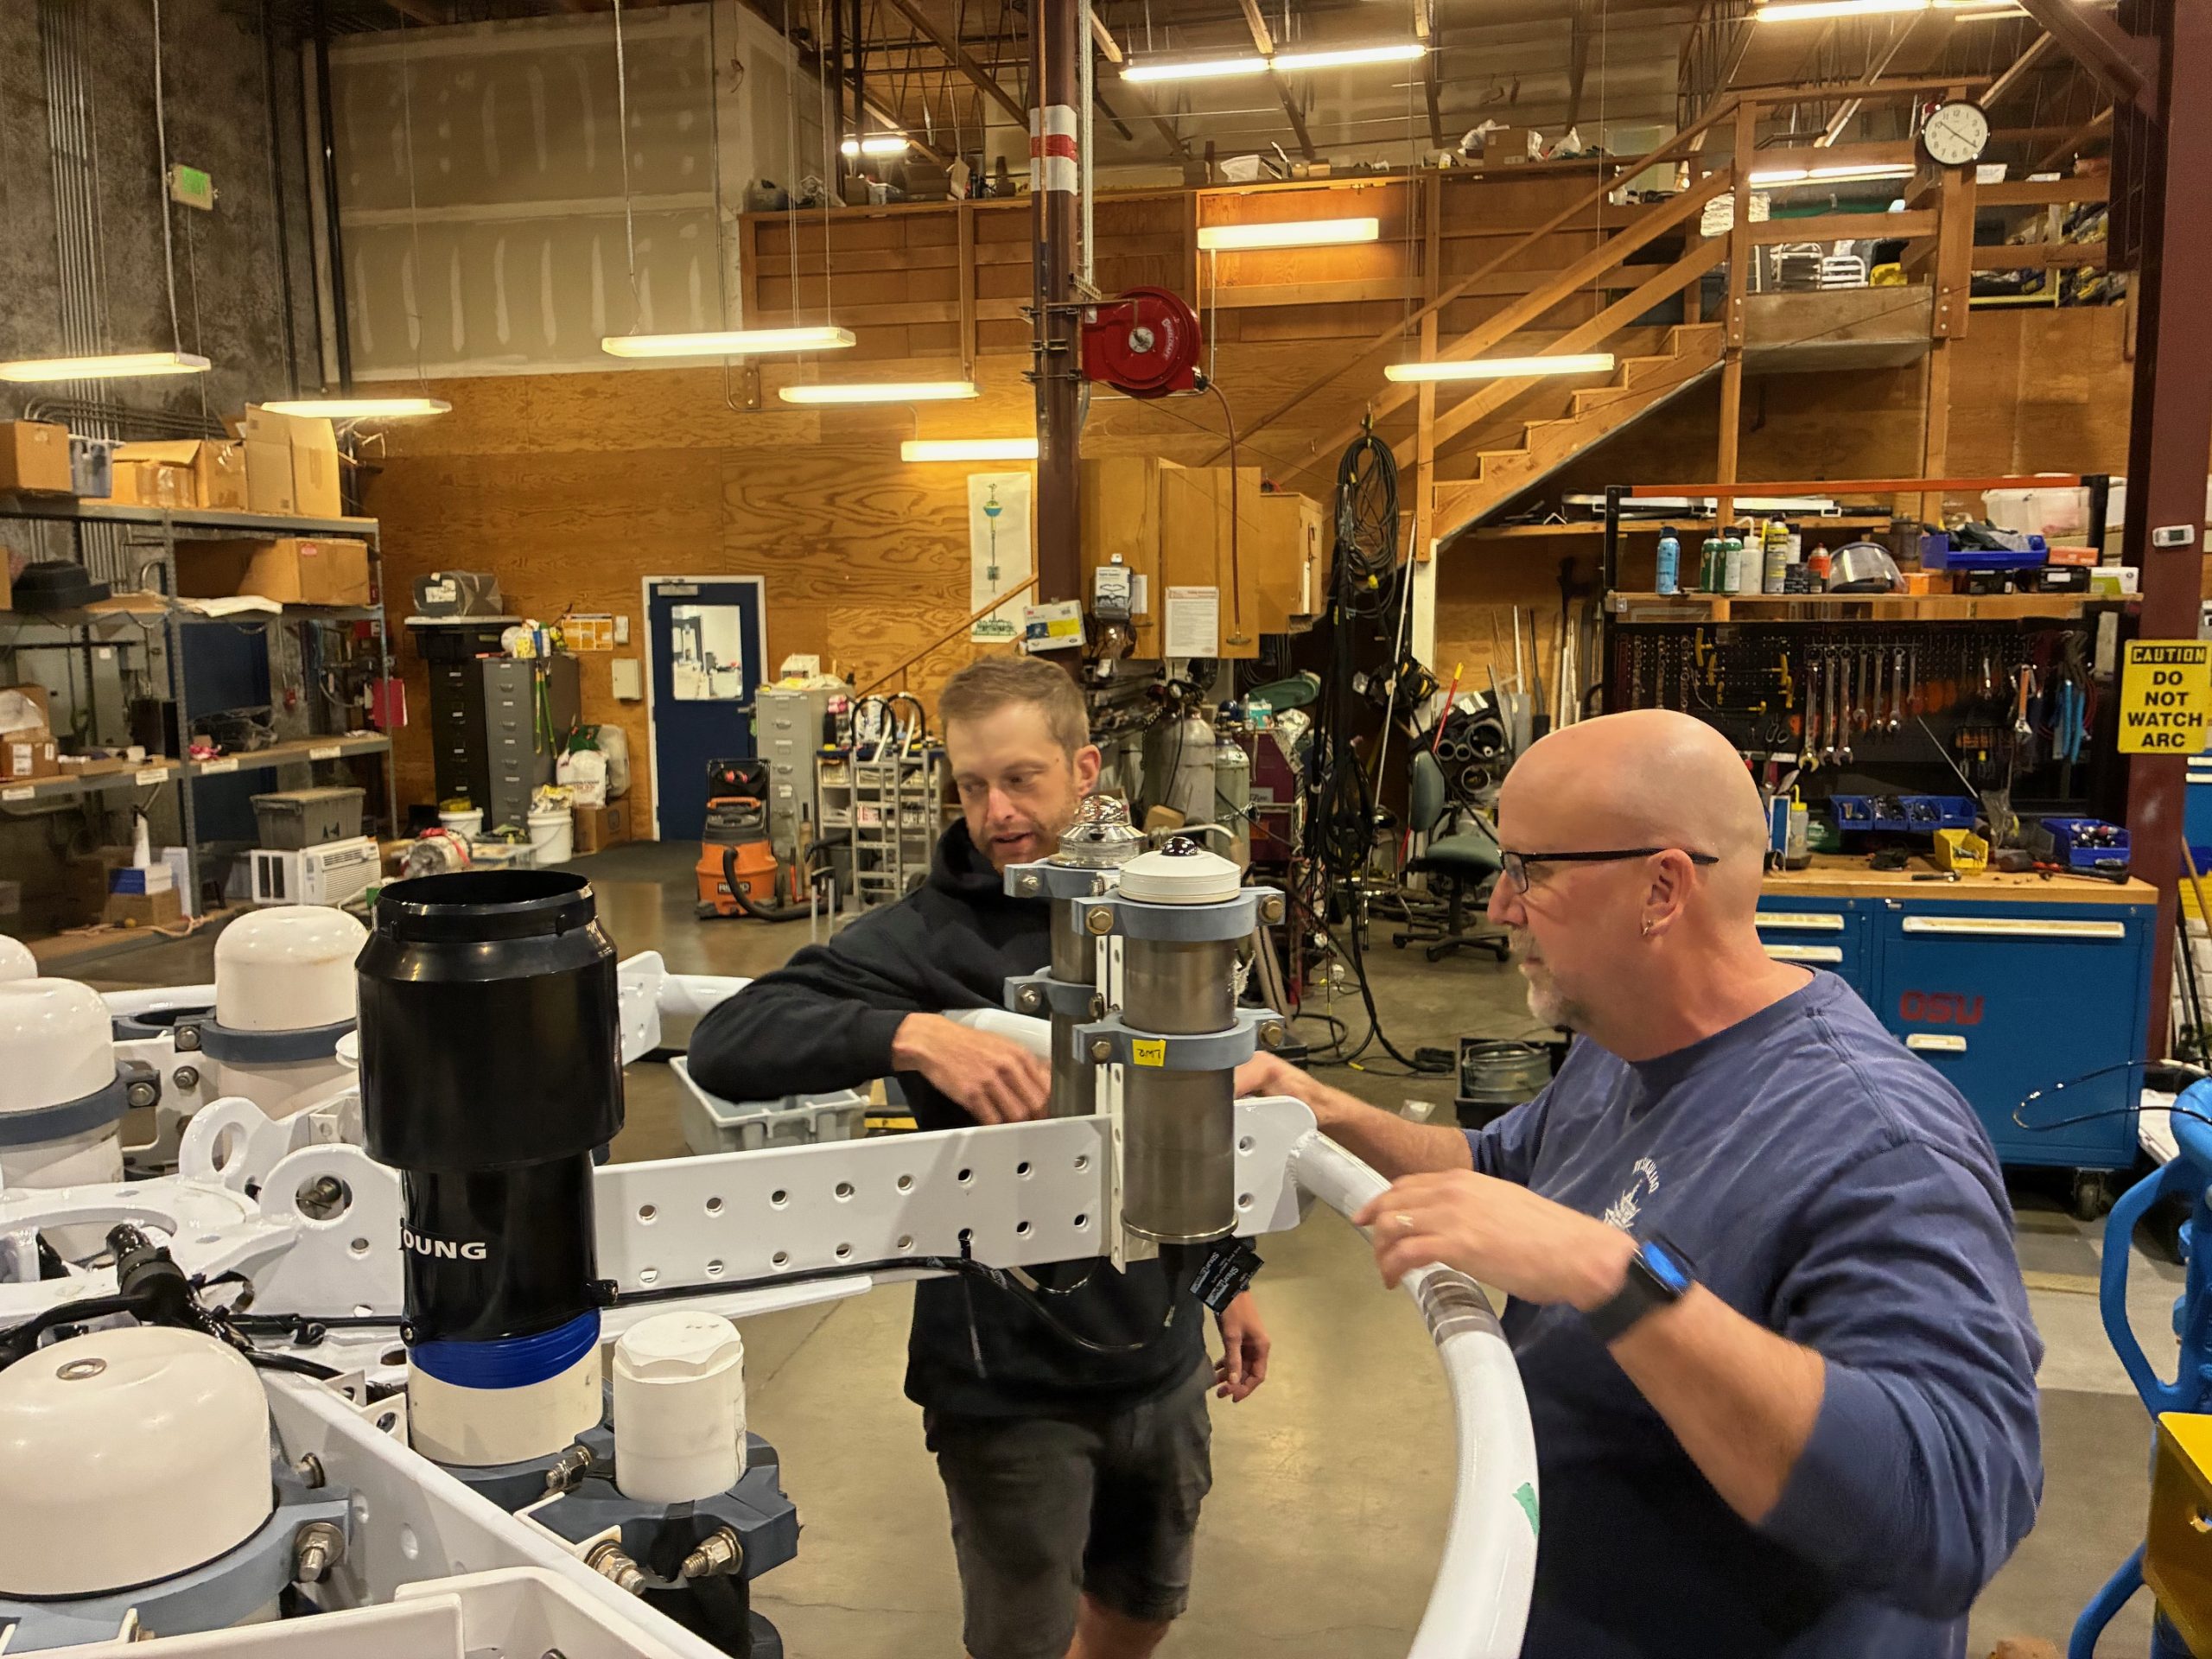 Mooring integration lead Alex Wick (left) and data lead Chris Wingard (right) examine met instruments on the Oregon Shelf buoy to be deployed in June 2026. Instruments have been programmed and are being tested in the high bay. Photo credit: Ed Dever, OSU[/caption]
[caption id="attachment_37559" align="alignnone" width="2560"]
Mooring integration lead Alex Wick (left) and data lead Chris Wingard (right) examine met instruments on the Oregon Shelf buoy to be deployed in June 2026. Instruments have been programmed and are being tested in the high bay. Photo credit: Ed Dever, OSU[/caption]
[caption id="attachment_37559" align="alignnone" width="2560"]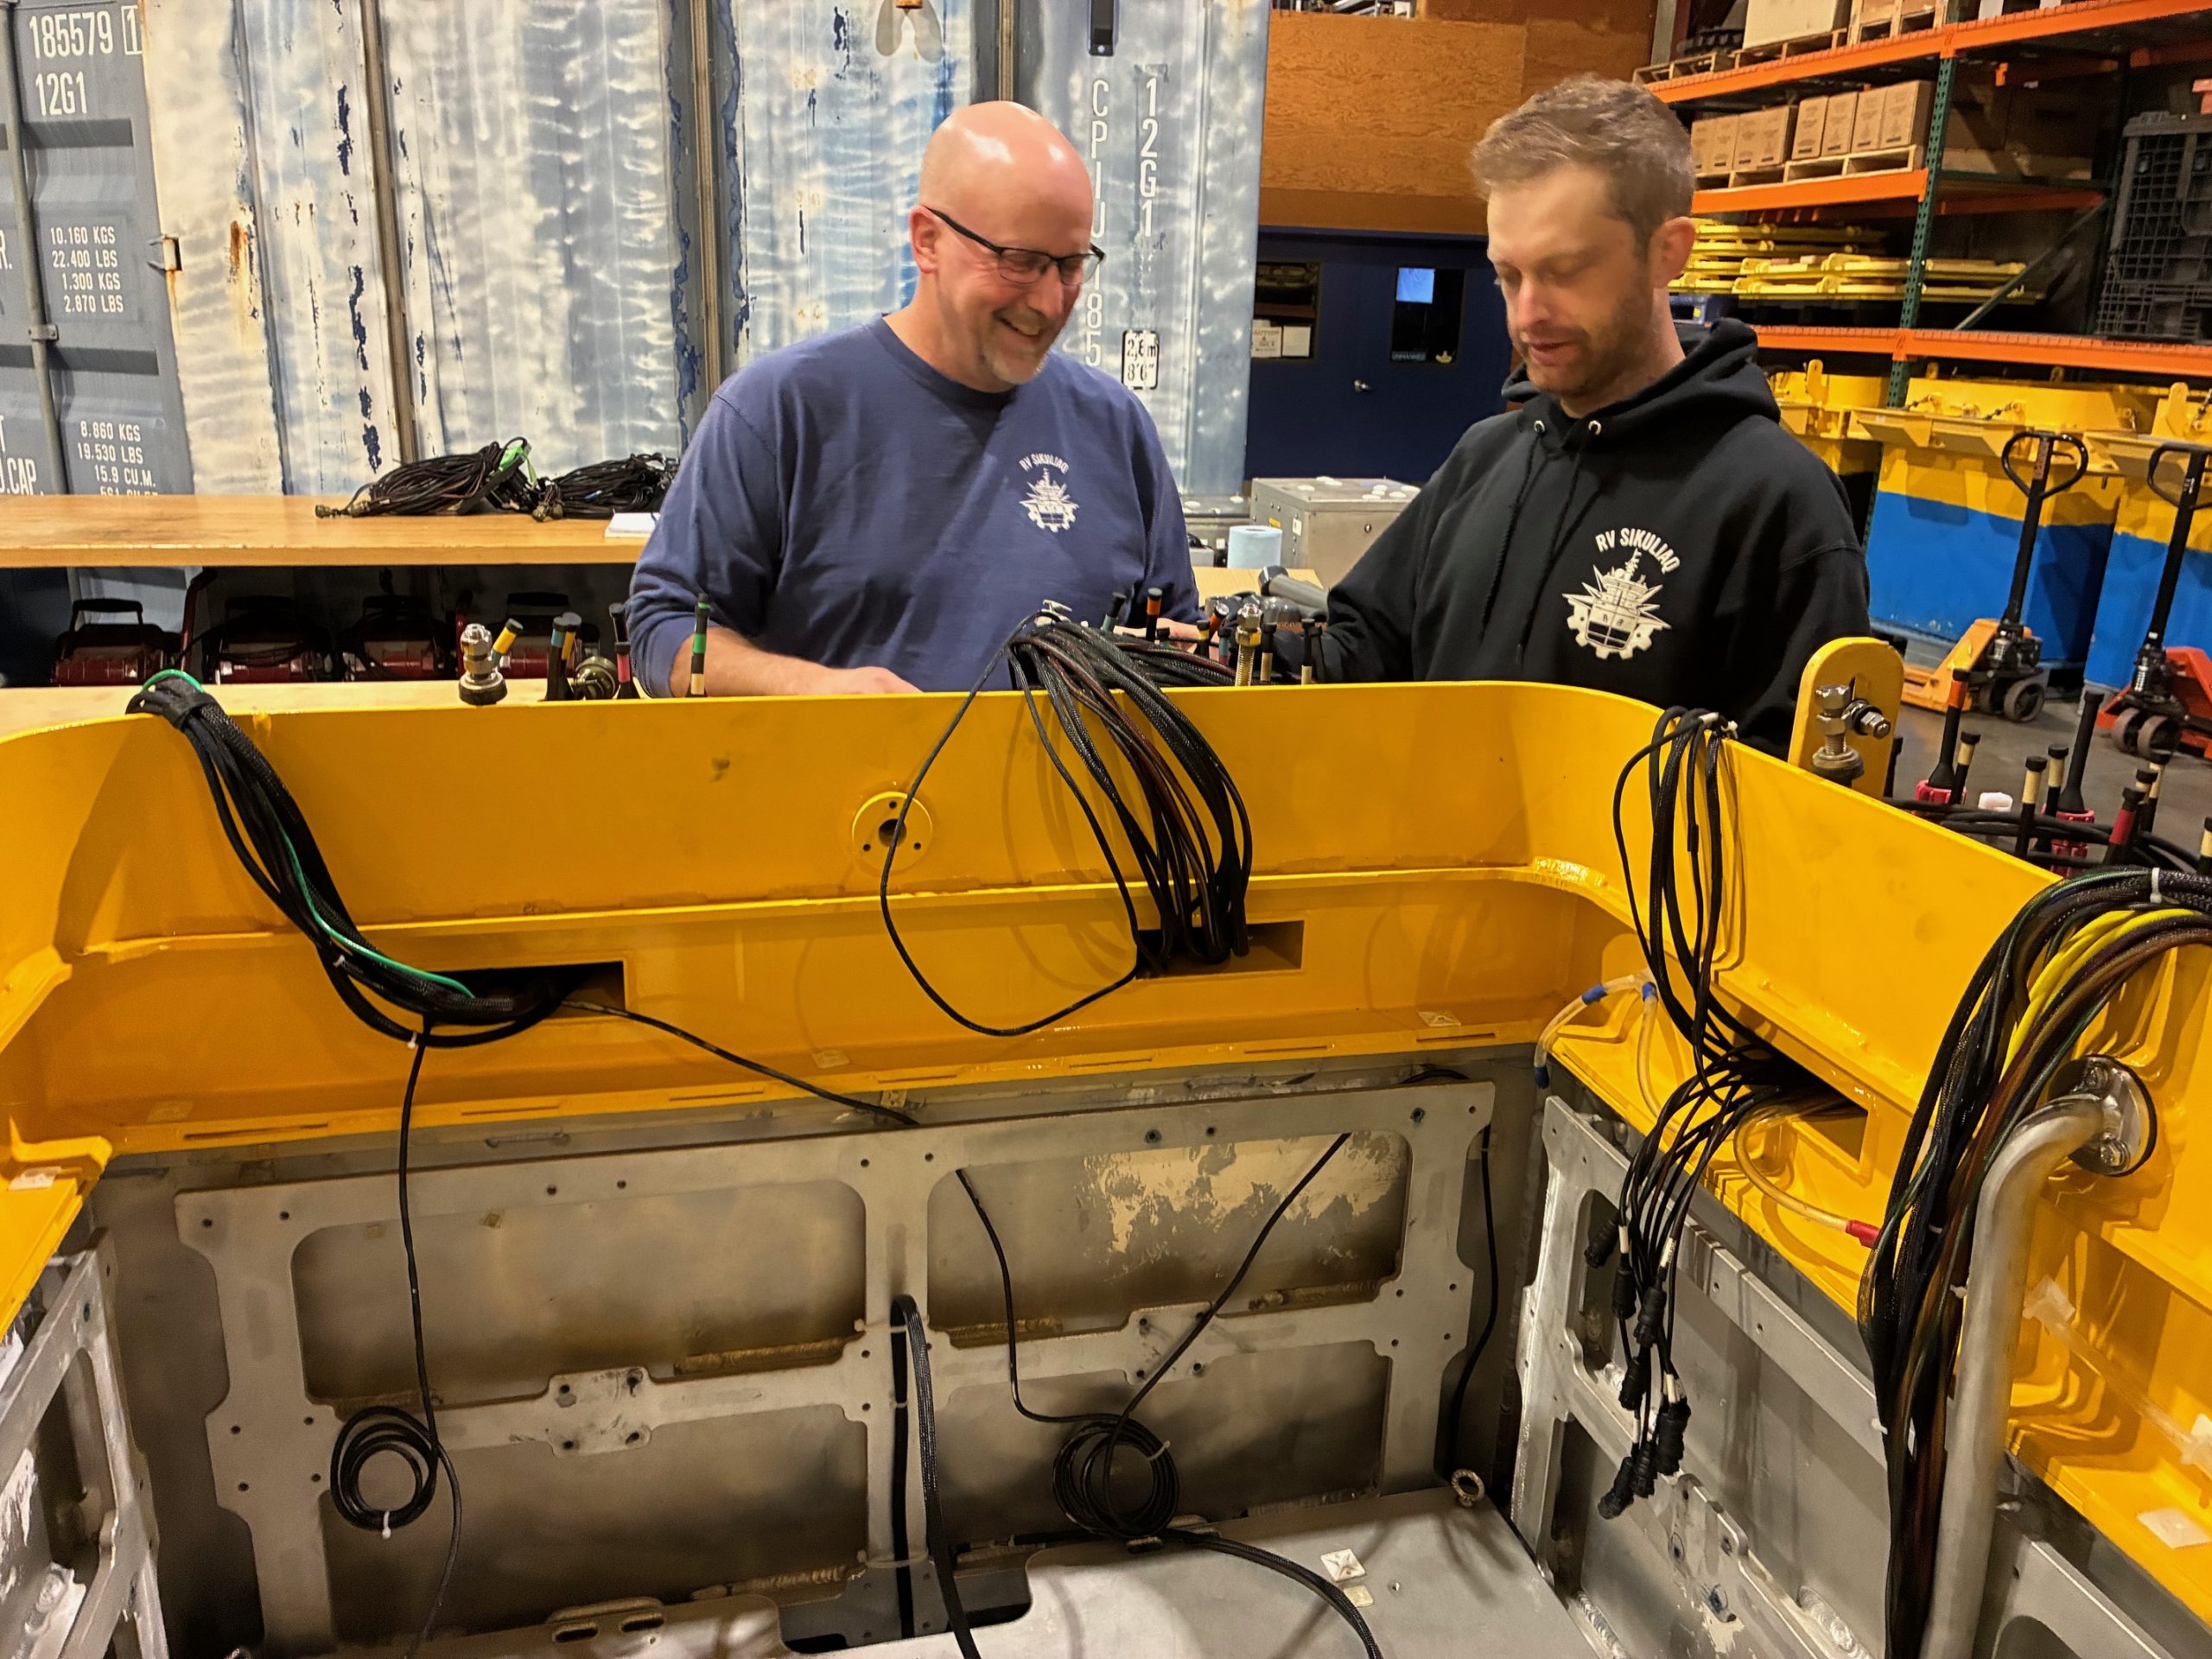 Data lead Chris Wingard (left) and mooring integration lead Alex Wick (right) examine the wiring harness on the Oregon Shelf buoy well to be deployed in October 2026. Early prep work is being done to enable this mooring to be deployed in October. Photo credit: Ed Dever, OSU[/caption]
Read More
Data lead Chris Wingard (left) and mooring integration lead Alex Wick (right) examine the wiring harness on the Oregon Shelf buoy well to be deployed in October 2026. Early prep work is being done to enable this mooring to be deployed in October. Photo credit: Ed Dever, OSU[/caption]
Read More Accounting for Ocean Waves and Current Shear in Wind Stress Parameterization
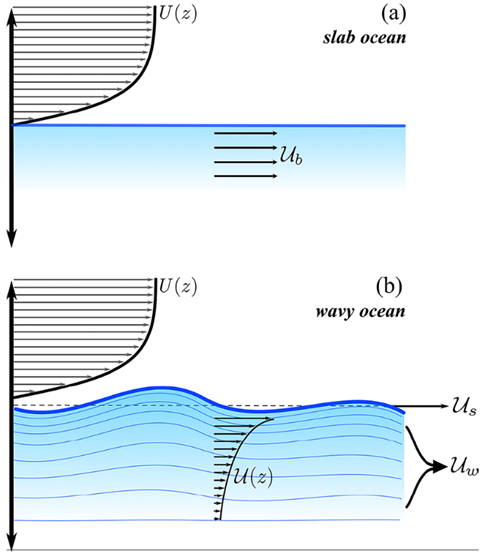
Ortiz-Suslow et al. (2025) use measurements of direct covariance wind stress, directional wave spectra, and current profiles from the OOI Coastal Endurance Array (Ocean Observatories Initiative) offshore of Newport, Oregon (2017–2023) to test a proposed new general framework for the bulk air-sea momentum flux that directly accounts for vertical current shear and surface waves in quantifying the stress at the interface. Their approach partitions the stress at the interface into viscous skin and (wave) form drag components, each applied to their relevant surface advections, which are quantified using the inertial motions within the sub-surface log layer and the modulation of waves by currents predicted by linear theory, respectively.
Their framework does not alter the overall dependence of momentum flux on mean wind forcing, and they found the largest impacts at relatively low wind speeds. Below 3 m s−1, accounting for sub-surface shear reduced form drag variation by 40–50% as compared to a current-agnostic approach. As compared to a shear-free current, i.e., slab ocean, a 35% reduction in form drag variation was found. At low wind forcing, neglecting the currents led to systematically overestimating the form stress by 20 to 50% — an effect that could not be captured by using the slab ocean approach. Their framework builds on the existing understanding of wind-wave-current interaction, yielding a novel formulation that explicitly accounts for the role of current shear and surface waves in air-sea momentum flux. Ortiz-Suslow et al. find their work holds significant implications for air-sea coupled modeling in general conditions.
In using the Oregon Shelf (CE02SHSM) data, Ortiz-Suslow et al. note, “There are several distinct advantages to using these data for this analysis: (1) the range of the dataset goes back seven years with good temporal coverage, (2) there are co-located wind, wave, and current measurements at hourly intervals for in-depth analysis, and (3) the site is exposed to a wide range of wind, wave, and current conditions. Furthermore, by using this dataset, we take advantage of internal quality data control and processing steps that are standardized across the OOI array network.”
[caption id="attachment_37363" align="alignnone" width="488"] Conceptual diagram highlighting the distinction between defining the relative wind velocity over the (a) slab ocean versus the (b) wavy interface. In the presence of near-surface shear, the relative contributions of viscous skin (Us) and wave form (Uw) must be directly accounted when calculating the relative wind at the base of the sheared wind profile (Figure 30, Ortiz-Suslow et al., 2025).[/caption]
___________________
Reference:
Ortiz-Suslow, D.G., N. Laxague, J-V. Björkqvist, M. Curcic, (2025). Accounting for Ocean Waves and Current Shear in Wind Stress Parameterization. Boundary-Layer Meteorology, 191(38), https://doi.org/10.1007/s10546-025-00926-9
Read MoreSubmarine canyon sediment transport and accumulation during sea level highstand: Interactive seasonal regimes in the head of Astoria Canyon, WA
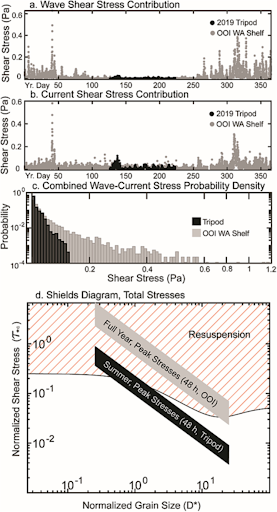
Lahr et al. (2025) use in-situ hydrodynamic data from a benthic tripod deployment in the head of Astoria Canyon to show that sediment resuspension and transport during summer is driven by internal tides and plume-associated nonlinear internal waves. Observations of shoreward-directed currents and low shear stresses (<0.14 Pa) along with sediment trap data suggest that seasonal loading of the canyon head occurs during summer. Nearby long-term wave data from the OOI Washington Shelf mooring shows that winter storm significant wave height often exceeds 10 m, driving shear stress capable of resuspending all grain sizes present within the canyon head. Swell events are generally concurrent with downwelling flows, providing a mechanism for episodic downcanyon sediment flux. This study indicates that canyon heads can continue to function as sites of sediment winnowing and bottom boundary layer export even with a detached, shelf-depth canyon head.
As part of this study, Lahr et al. (2025), used data from the OOI Washington Shelf Surface Mooring located 81 km north of the tripod site in Astoria Canyon. The 2019 benthic tripod deployment by Ogston was done as an ancillary activity on the Endurance 11B cruise aboard R/V Oceanus. The data used were concurrent spectral surface wave and meteorological data near bed current velocity for 2016 (chosen for its complete records). Figure xx shows the benthic tripod stress overlaid with the OOI Washington shelf mooring stress. Over the summer, the benthic tripod stress and OOI estimated stress compare well. Winter stresses (available from OOI mooring only) are much larger than those observed in summer.
[caption id="attachment_37116" align="alignnone" width="277"] Figure 1. Shear stress computed from the Astoria Canyon tripod deployment (black) and the OOI Shelf mooring (gray). Panels a) and b) depict relative stress contributions from waves and currents respectively, c) the distribution of total stresses, and d) maximum shear stresses from summer and winter on a Shields diagram. (Figure 3, Lahr et al., 2025)[/caption]
___________________
Reference:
Lahr, E.J., A.S. Ogston, J.C. Hill, H.E. Glover, and K.J. Rosenberger (2025). Submarine canyon sediment transport and accumulation during sea level highstand: Interactive seasonal regimes in the head of Astoria Canyon, WA. Marine Geology, no. (2025): 107516. https://www.sciencedirect.com/science/article/pii/S0025322725000416.
Read MoreOOI Endurance Array: December Virtual Office Hours
The OOI Endurance Array team will host monthly virtual office hours on the first Wednesday of each month at 12 PM ET / 9 AM PT.
Drop in to ask questions, connect with the team, or just stay in the loop.
Zoom Link: https://oregonstate.zoom.us/j/93329747805?pwd=31ofVyNtza6u33rGfoqXO6JZIBGn3v.1
Read MoreGap-Filled Dissolved Oxygen Data from the Ocean Observatories Initiative Endurance Array Inshore Moorings
Brandy Cervantes contributed the dataset described below to Zenodo. This dataset now appears in the OOI Community Datasets under the OOI home page.
The National Science Foundation Ocean Observatories Initiative (OOI) collects continuous in-situ measurements of dissolved oxygen (DO) on the Endurance Array moorings in the inner shelf region of the Oregon and Washington coasts. Aanderaa Optode 4831 oxygen sensors were deployed at 7 meters depth on the near surface instrument frame (NSIF) and on the collocated coastal surface piercing profiler (CSPP) moorings. The sensors suffer from calibration drift due to biofouling, which can cause a dramatic increase in DO during daylight hours and corresponding decrease at night compared to the conditions in the water column. This enhanced diel signal, when present, is much more pronounced on fixed-depth sensors and usually begins to occur 1-2 months after a mooring is deployed. After this biofouling issue was identified, OOI began deploying UV lamps adjacent to the oxygen sensor in spring 2018, after which there was substantial improvement in DO data quality. Each file in this dataset contains the measured near surface DO and the corrected near surface DO at the Oregon and Washington inner shelf surface moorings (ISSM) with gaps from periods of biofouling replaced with the DO measured by the CSPP.
___________________
References:
Cervantes, B. (2025). Gap-Filled Dissolved Oxygen Data from the Ocean Observatories Initiative Endurance Array Inshore Moorings [Data set]. Zenodo. https://doi.org/10.5281/zenodo.15742508
Read MoreSubsurface Temperature Anomalies off Central Oregon during 2014–2021

Brandy T. Cervantes, Melanie R. Fewings, and Craig M. Risien
Cervantes et al. (2024) use water temperature observations from a stationary oceanographic platform located in 80 m water depth off Newport, Oregon to calculate variations from the long term mean temperature at the surface, near surface, and bottom from 1999 to 2021. This site, known as NH-10, was occupied since 1999 successively by an Oregon State University National Oceanographic Partnership Program (OSU NOPP), GLOBEC Long Term Observation Program, Oregon Coastal Ocean Observing System (OrCOOS), NANOOS/CMOP. Since 2015 it has been occupied by the NSF OOI Coastal Endurance Oregon Shelf mooring (CE02SHSM). The temperature observations from these different programs that have not previously been combined into one long time series. Of particular interest are the details of the marine heatwave (MHW) periods of 2014–2016 and 2019– 2020, which had widespread impacts on marine ecosystems. Strong deviations from the mean water temperature observed near the ocean bottom during late 2016 are the largest sustained warm anomalies in the time series. The 2019–2020 period shows warm anomalies in the summer and fall that are only observed near the surface.
They also analyze the local winds during years with and without MHWs and find that spring/summer upwelling favorable, or northerly winds, which are important for bringing cold, nutrient rich water to the surface in coastal regions, interrupt MHW events and can lessen extreme heating during MHWs in coastal waters as illustrated in Figure 33.
The three periods detailed in Figure 33 show warmer daily surface temperatures during the MHW years than the non‐MHW years and several days during 2014–2016 with surface and bottom anomalies greater than 4°C and during 2014–2016 and 2019–2020 with surface anomalies greater than 4°C (Figure 12a). During upwelling favorable winds (negative wind stress), the three periods follow similar patterns with colder surface temperatures typically associated with higher wind stress magnitudes. During downwelling‐favorable winds (positive wind stress), 2014–2016 is substantially warmer at the surface than the other periods at all wind stress values.
[caption id="attachment_36388" align="alignnone" width="526"] Figure 33: 8‐Day low‐pass filtered surface temperature at NH‐10/CE02SHSM for (a) 1999–2000, (d) 2014–2015, and (g) 2019–2020; 8‐day low‐pass filtered along‐shelf surface velocity for (b) 1999–2000, (e) 2014–2015, and (h) 2019–2020; and NDBC 46050 wind stress vectors (thin light lines) and along‐shelf 8‐day wind stress (thick lines) (c) 1999–2000, (f) 2014–2015, and (i) 2019–2020. Events identified as surface marine heatwaves are shaded in gray. The thick black line in panels (a–b), (d–e), and (g–h) is the climatological mean computed over the full NH‐10 time series (Figure 33c), repeated twice, and the thin black lines are the 90th and tenth percentiles.[/caption]
___________________
References:
Cervantes, B. T., Fewings, M. R., & Risien, C. M. (2024). Subsurface temperature anomalies off central Oregon during 2014–2021. Journal of Geophysical Research: Oceans, 129, e2023JC020565. https://doi.org/10.1029/2023JC020565
Read MoreTagging and Tracking Large Fish Along the PNW Coast

A Navy-funded project is currently monitoring Pacific Salmon along the coasts of Oregon and Washington, using specialized tracking technology to better understand fish movements in near-real time. This effort, led by Dr. Taylor Chapple of Oregon State University, is part of the Marine Species Monitoring initiative, supported by the U.S. Navy Pacific Fleet.
While separate from the U.S. National Science Foundation’s Ocean Observatories Initiative (OOI) cruises, this project takes advantage of OOI’s Endurance Array moorings by placing Vemco VR2C tag readers on select moorings to detect and track tagged fish. The collected data provides valuable insights that could benefit commercial fishers, marine conservation efforts, and naval operations.
Tracking Salmon in Real-Time
As part of this initiative, researchers are tagging Pacific Salmon and tracking their movements using Vemco VR2C tag readers. These specialized instruments have been deployed on three OOI Endurance Array moorings: the Oregon Inshore Surface Mooring (CE01ISSM), the Washington Inshore Surface Mooring (CE06ISSM), and the Washington Shelf Surface Mooring (CE07SHSM).
When a tagged fish approaches one of these moorings, the tag reader records the encounter and transmits the data to shore within hours. This near-real-time data can be useful for commercial fishers, military operations, and other maritime stakeholders operating in the Pacific Northwest.
Expanding the Scope: Tracking Other Marine Life
Beyond salmon, the tag readers detect other marine species that have been tagged through separate research projects. These include sharks tagged from California to Alaska, sturgeon, other large fish, and even Dungeness crabs. The data collected from these detections is shared through OOI’s raw data server, contributing to a growing body of research on marine life movements in the region.
Data Access
To make the data easily available, each mooring with a tag reader generates a CSV file whenever it transmits data. These files have been combined into larger datasets, organized by mooring deployment, allowing researchers to analyze fish migration patterns and ecosystem dynamics.
By using OOI’s moorings for data collection, this project enhances our understanding of large fish movements along the Pacific Northwest coast, demonstrating the value of integrated ocean monitoring and advanced tagging technology.
To learn more and access the full dataset, visit the Tagging and Tracking of Large Fish Along the PNW Coast webpage.
Bloom Compression Alongside Marine Heatwaves Contemporary with the Oregon Upwelling Season

Black et al. (2024) examine the impacts of marine heatwave (MHW) events on upwelling-driven blooms off the Oregon coast. They combine OOI data from Endurance moorings off Oregon with satellite data and indices of upwelling and MHW presence to determine how MHW’s impact these blooms. Their work focuses on MHWs and coincident events that occurred off Oregon during the summers of 2015–2023. They found the presence of MHW’s limited the offshore extent of phytoplankton blooms. In late summer 2015 and 2019, both documented MHW years, coastal phytoplankton biomass extended on average 6 and 9 km offshore of the shelf break along the Newport Hydrographic Line, respectively. During years not influenced by anomalous warming, coastal biomass extended over 34 km offshore of the shelf break. Reduced biomass also occurs with reduced upwelling transport and nutrient flux during these anomalous warm periods. However, the enhanced front associated with a MHW aids in the compression of phytoplankton closer to shore. Over shorter events, heatwaves propagating far inshore also coincide with reduced chlorophyll a and sea-surface density at select cross-shelf locations, further supporting a physical displacement mechanism. Paired with the physiological impacts on communities, heatwave-reinforced physical confinement of blooms over the inner-shelf may have a measurable effect on the gravitational flux and alongshore transport of particulate organic carbon. Black is a PhD student at Oregon State University and notes that all data used in the paper, including of course OOI data, are open source. They provide details regarding data access methods and intermediate processing steps along with code modules to reproduce the work at https://github.com/IanTBlack/oregon-shelf-mhw.
Black et al. focus much of their analysis on the Oregon Offshore mooring, CE04 (Fig. x). Here they show individual warm events aligned with periods where Chl a was much lower than the time-series average and the climatological mean. The analysis period for 2019 had the lowest average Chl a across all years. From the CE04-derived Chl a climatology, they observed an occurrence of a regular spring bloom (April) and a summer bloom (September). The peak of the summer bloom appears contemporary with the warmest time of year at CE04, and years 2019 and 2023 were the only years that experienced MHWs during this same period. The summer blooms of 2019 and 2023 at CE04 were also noticeably suppressed and difficult to differentiate from surrounding Chl a values.
[caption id="attachment_35688" align="alignnone" width="624"] Figure 28: Ocean Observatories Initiative (OOI) CE04, Coastal Upwelling Transport Index (CUTI), and Biologically Effective Upwelling Transport Index (BEUTI) time series between 2015 and 2023. Daily mean values are in light blue. Red vertical spans indicate potential marine heatwave (MHW) events and gray vertical spans indicate the time between the spring and fall transition dates. A centered 11-d rolling mean was applied to smooth the data (black).[/caption]
___________________
Reference:
I Black, IT, Kavanaugh, MT, Reimers, CE. “Bloom compression alongside marine heatwaves contemporary with the Oregon upwelling season.” Limnology and Oceanography, no. (2024): First published: 16 December 2024, https://doi.org/10.1002/lno.12757
Read More