
Posts Tagged ‘Coastal Endurance Array’
Impact of Ocean Model Resolution on Temperature Inversions in the Northeast Pacific Ocean
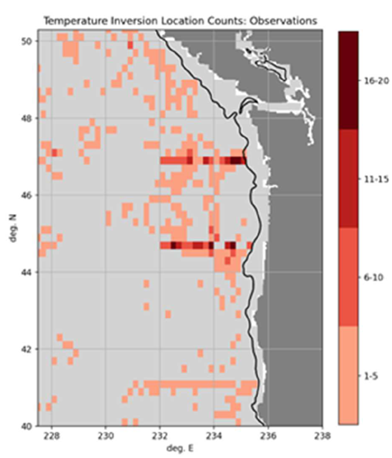
Temperature inversions are a local vertical minimum in temperature located at a shallower depth than a local maximum. In the Northeast Pacific, several water masses and multiple mechanisms for transforming or advecting ocean temperature (cold air events, upwelling, river discharge, cross-shelf eddy transport) create favorable conditions for temperature inversions. Modeling these temperature inversions is challenging. Osborne et al. (2023) analyze observations from 2020 and 2021 to characterize inversions in the Northeast Pacific. The data for these observations come largely from OOI Endurance Array gliders accessed through the GTS database. They compare the observed inversions to model results from the U.S. Navy’s Global Ocean Forecast System version 3.1 (GOFS 3.1) and two instances of the Navy Coastal Ocean Model. Temperature inversions are observed to be present in about 45% of profiles with temperature minimums between 50 – 150 m, temperature maximums between 75 – 175 m, and inversion thickness almost entirely less than 40 m. Modeled temperature inversions are present in only about 5% of model-observations comparisons, with weaker, shallower minimums. This is attributed to two primary causes: coarse model resolution at the inversion depth and the assimilation process which low-pass filters temperature, making inversions weaker. Osborn et al. identify additional work to test the impact of vertical grids on improving model performance.
[caption id="attachment_34977" align="alignnone" width="392"] Maps of inversion counts for observed profiles collected during 2020-2021 and analyzed in this work. Profiles have been filtered to be offshore of the 200 m isobath and to only one profile per collection platform per day (e.g., one profile per glider per day). Black line near the coast marks the 200 m isobath. Light gray indicates no profiles collected during the study period.[/caption]
___________________
References:
J. Osborne V, C. M. Amos and G. A. Jacobs, “Impact of Ocean Model Resolution on Temperature Inversions in the Northeast Pacific Ocean,” OCEANS 2023 – MTS/IEEE U.S. Gulf Coast, Biloxi, MS, USA, 2023, pp. 1-8, doi: 10.23919/OCEANS52994. 2023.10337390.
Read MoreUG2 Workshop ’24: A Collaborative Hub for Underwater Glider Innovation

The UG2 Workshop ’24, held from September 10-12 on the University of Michigan campus, brought together leading researchers, industry professionals, and practitioners to advance the capabilities and collaborative efforts of the underwater glider community. National Science Foundation Ocean Observatories Initiative (OOI) attendees included Ed Dever, Principal Investigator of the Northeast Pacific Endurance Array (EA), Peter Brickley, Senior Engineer with the Coastal and Global Scale Nodes (CGSN), and EA glider lead Stuart Pearce and glider tech Jonathan Whitefield. Over the course of three days, OOI participants contributed to in-depth discussions on data management, operational best practices, and emerging technologies, laying the foundation for future advancements in ocean monitoring and glider operations.
Workshop Goals and Objectives
The primary objective of UG2 is to foster a cohesive community that promotes the sharing of glider mission resources within the U.S. and internationally. The 2024 Workshop aimed to:
- Harmonize Glider Efforts: Improve data management and foster partnerships while documenting best practices to enhance collaboration.
- Share New Developments: Highlight recent advancements in sensors, glider technologies, and novel applications.
- Refine Operational Activities: Enhance strategies for sustained ocean observations and explore the impact of glider data on ocean modeling.
- Identify Action Items and Needs: Address communication gaps and improve UG2’s communication platforms for the future.
- Network with Glider Users: Facilitate interactions among U.S. and international glider users to strengthen partnerships.
Key Highlights
The workshop featured several interactive components that fostered deep engagement and collaborative dialogue:
- Liesl Hotaling’s Plenary Talk and Breakout Session: Liesl Hotaling’s plenary talk and subsequent breakout session focused on developing microcredentials for ocean technology professionals. This initiative aims to address workforce needs by creating stackable credentials that recognize core competencies. Her session, co-led with Josh Kohut, invited attendees to discuss the application of these credentials in building capacity for glider maintenance and piloting.
- Data Management Sessions (Day 2): A significant portion of Day 2 was dedicated to addressing challenges in glider data management. Facilitators Jennifer Bowers, Leila Baghdad-Brahim, and Jennifer Sevadjian led discussions on best practices for data collection, registration, and sharing. The sessions provided valuable insights into the U.S. IOOS National Glider Data Assembly Center (DAC) and efforts to standardize glider data handling, ensuring efficient management of multidimensional data. All OOI glider data are routinely reported to the DAC using code developed by Stuart Pearce and others.
- Sustained National Glider Network Session (Day 2): Daniel Rudnick and J. Xavier Prochaska facilitated this session, which emphasized the importance of a sustained glider-based observation network within the Global Ocean Observing System (GOOS). Participants explored the feasibility of creating a coordinated network that integrates coastal and basin-scale observations, building on previous efforts by the Ocean Gliders Boundary Ocean Observing Network (BOON). The OOI’s Endurance Array lines are part of the BOON along the US Pacific coast.
- Poster Presentations: The poster sessions showcased a wide range of research and operational insights. OOI contributed two posters.
- Stuart Pearce et al. presented a poster on “OOI In-Air Oxygen Calibration Adjustments and Improved Oxygen Sensor Mount,” highlighting advancements in sensor calibration for improved accuracy.
- Peter Brickley et al. showcased “OOI Glider Operations in the Mid-Atlantic Bight,” detailing operational strategies and findings from extensive glider deployments in this dynamic region.
Outcomes and Next Steps
The workshop successfully facilitated deep engagement and collaboration, resulting in several key outcomes:
- Enhanced Data Management Practices: The data management sessions provided a comprehensive overview of current challenges and future directions, including early-stage data federation efforts aimed at harmonizing international standards.
- Support for a Sustained Glider Network: The discussions around a national glider network laid the groundwork for future collaboration, emphasizing the need for long-term, high-resolution coastal and deep ocean observations.
- Advancements in Professional Training: The workshop underscored the importance of developing innovative, stackable educational opportunities to build capacity in the blue economy. These efforts aim to enhance workforce skills and provide diverse learning pathways for individuals seeking careers in ocean technology.
[caption id="attachment_34904" align="alignnone" width="640"]
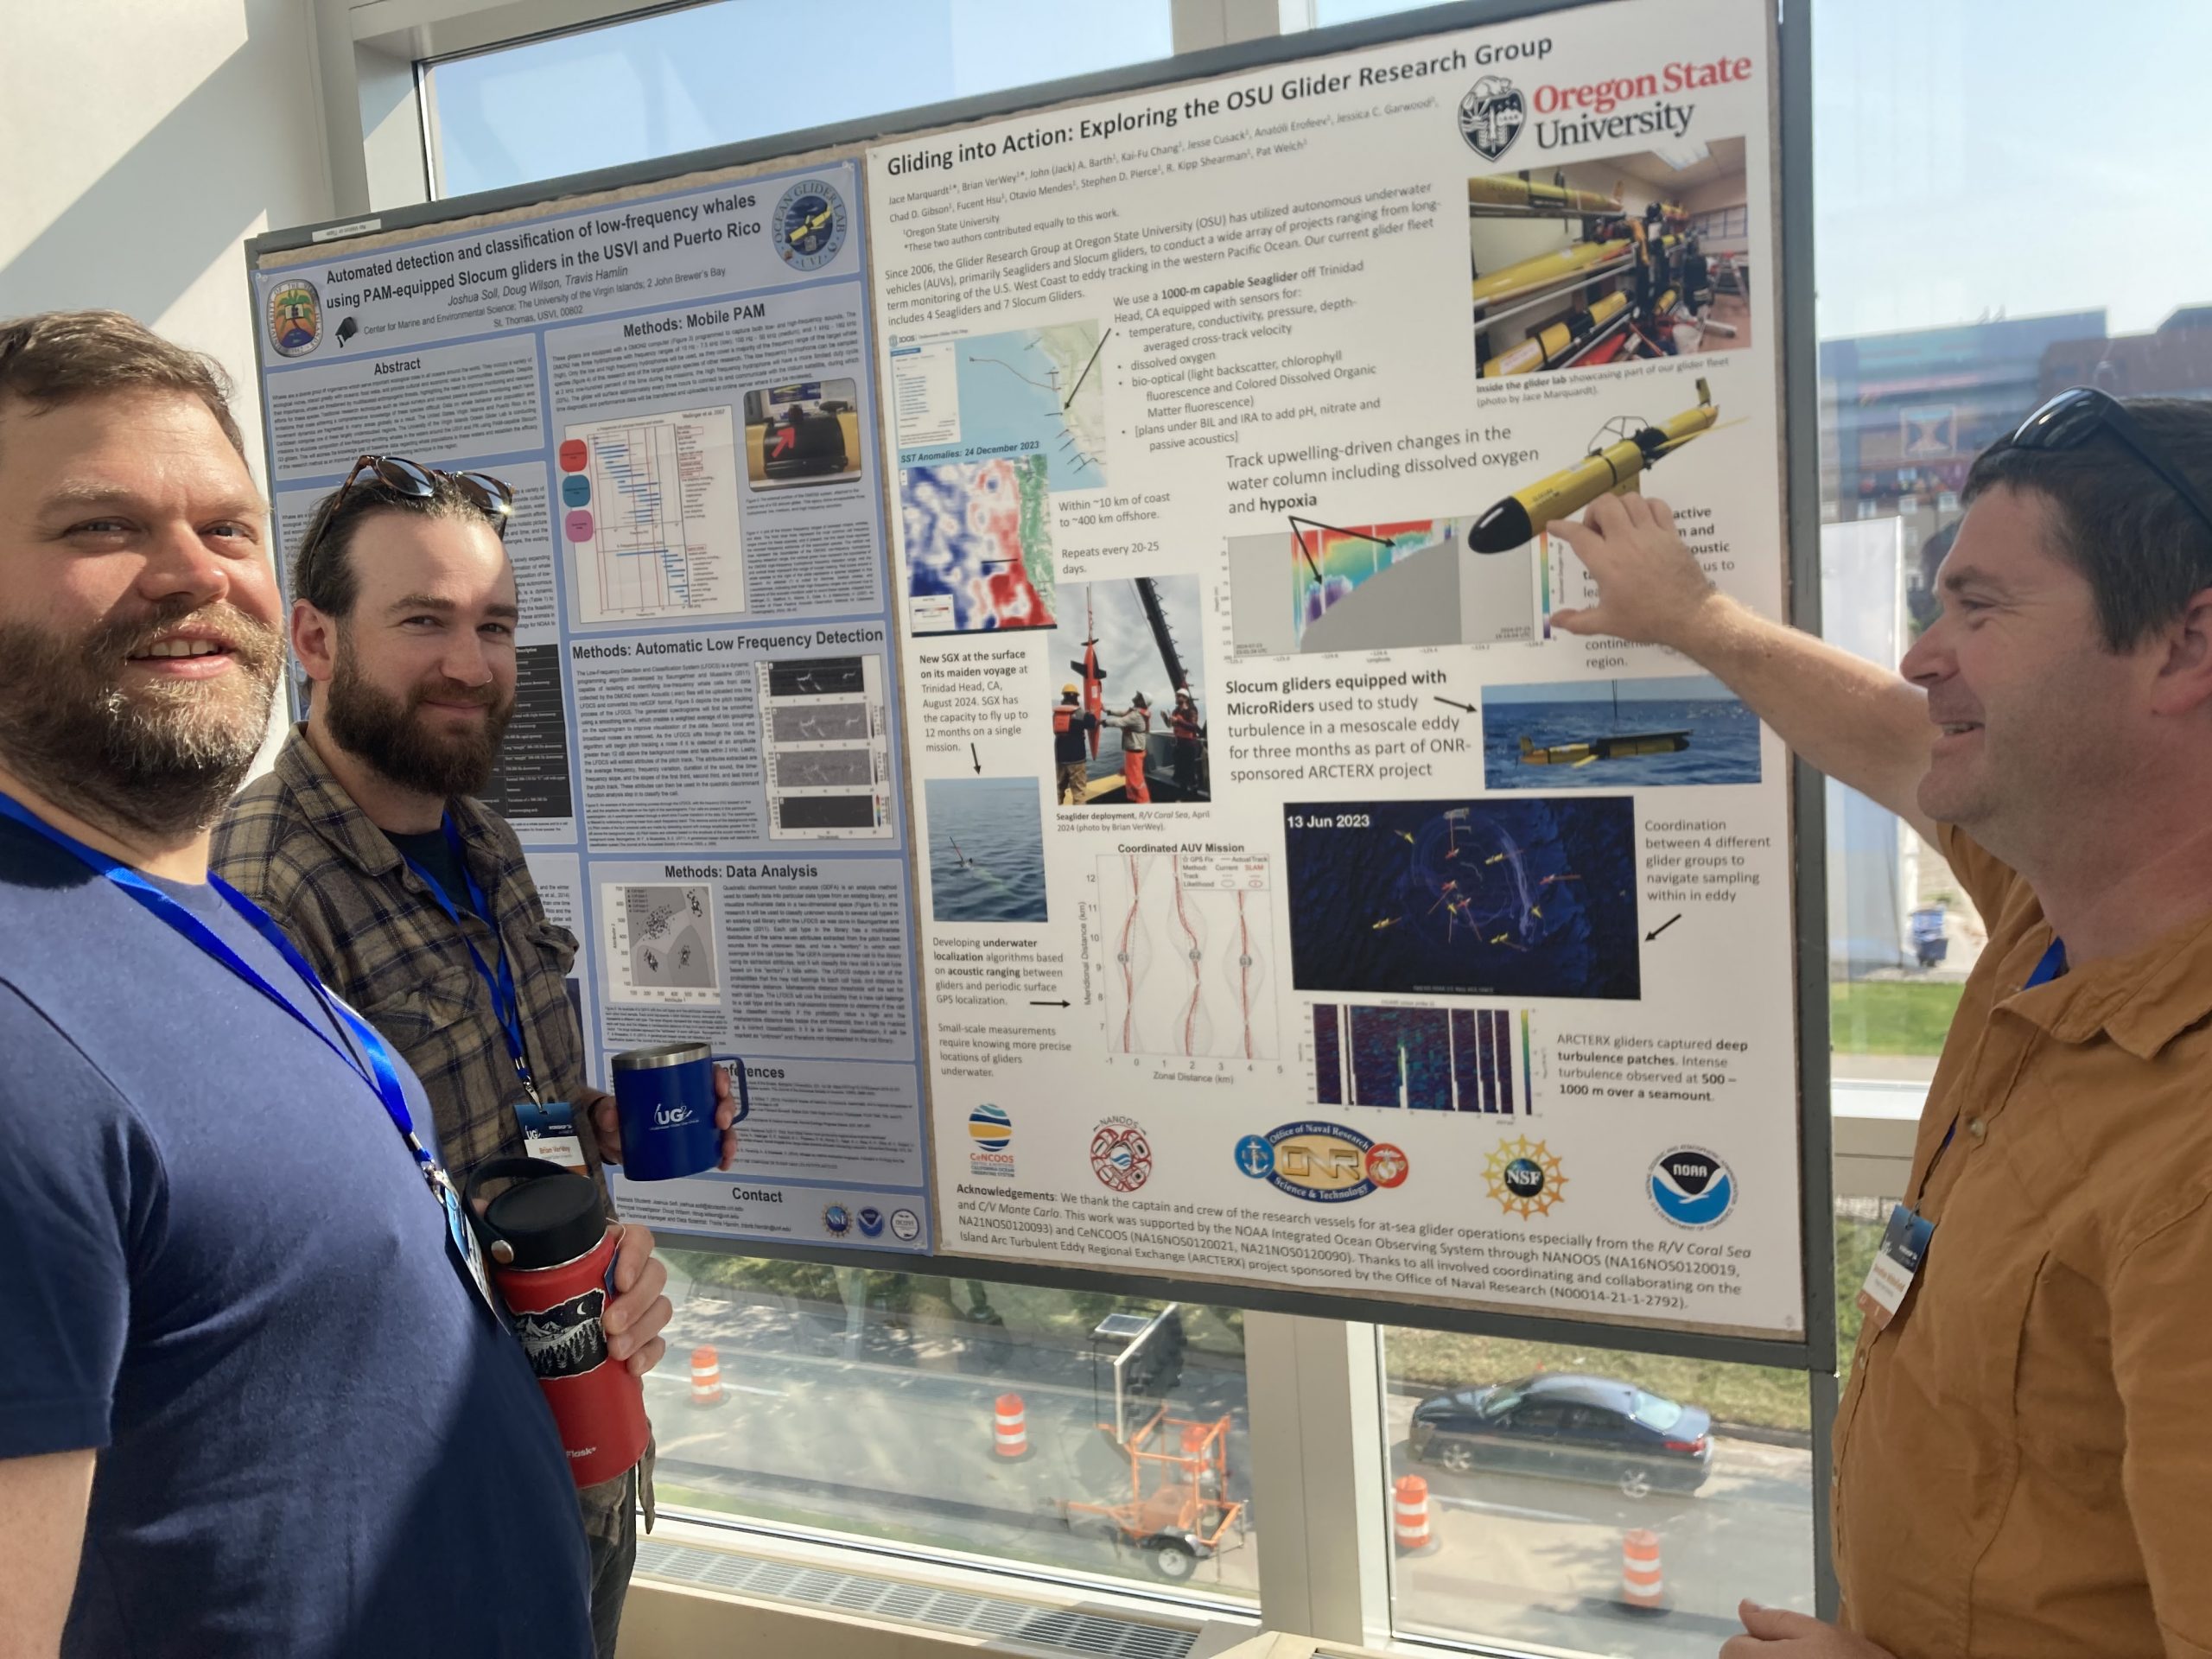 Stuart Pearce (OSU Endurance, left), Brian VerWey (OSU research glider group, center), and Jonathan Whitefield (OSU Endurance, right) pose during discussions around Brian’s poster.[/caption]
Read More
Stuart Pearce (OSU Endurance, left), Brian VerWey (OSU research glider group, center), and Jonathan Whitefield (OSU Endurance, right) pose during discussions around Brian’s poster.[/caption]
Read More Subsurface Acoustic Ducts in the Northern California Current System
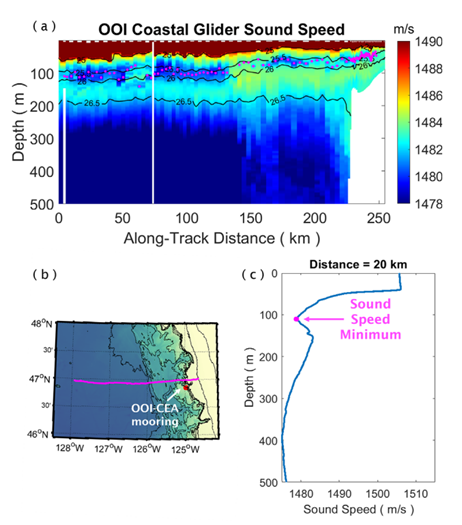
Xu et al.’s analysis of the hydrographic data recorded along the U.S. Pacific Northwest coastline leads to the identification of a secondary subsurface acoustic duct. A numerical simulation based on the sound-speed field determined from OOI Coastal Endurance and APL-UW glider CTD data suggests that the presence of the duct has major impact on sound propagation at a mid-range frequency of 3.5 kHz in the upper ocean (Figure 31). Specifically, the ducting effect is evident in the trapping of sound energy and the consequent reduction in transmission loss within the duct. Glider observations show that the duct is a large-scale phenomenon that extends hundreds of kilometers from the outer continental shelf to regions offshore of the continental slope. The axis of the duct shoals onshore from between 80 and 100 m depth offshore of the continental slope to less than 60 m over the shelf. Analysis of the sound-speed profiles determined from glider CTD data suggests that the prevalence of the duct decreases onshore, from over 40% in regions offshore of the continental slope to less than 5% over the shelf. In addition, analysis of the long-term time series of sound-speed profiles determined from the CTD data recorded over the shelf slope off the Washington Coast suggests that the duct is more prevalent in summer to fall than in winter to spring. Furthermore, examination of concurrent OOI Coastal Endurance Array (Washington Offshore Profiling Mooring) observations of sound speed and flow velocity indicates that the duct observed over the shelf slope is associated with a vertically sheared along-slope velocity profile, characterized by equatorward near-surface flow overlaying poleward subsurface flow.
[caption id="attachment_34581" align="alignnone" width="462"] (adapted from Fig. 3 of Xu et al., 2024) (a) The sound-speed field obtained from the CTD data recorded by an OOI-CEA coastal glider during 06-16 October 2018. The contour lines are potential density (in kg/m3). The magenta dots mark the locations of the local sound-speed minima along the axis of the subsurface duct. (b) The trajectory of the Seaglider. The red dot marks the location of the OOI-CEA Washington Offshore profiler mooring. The bathymetry contour lines mark seafloor depths in 100 m increments between 10 and 500 m and then in 500 m increments between 500 and 3000 m. (c) The vertical sound-speed profile at 20 km along-track distance. The local sound-speed minimum at the axis of the duct is labeled.[/caption]
___________________
References:
Guangyu Xu, Ramsey R. Harcourt, Dajun Tang, Brian T. Hefner, Eric I. Thorsos, John B. Mickett; Subsurface acoustic ducts in the Northern California current system. J. Acoust. Soc. Am. 1 March 2024; 155 (3): 1881–1894. https://doi.org/10.1121/10.0024146
Read MoreGraduate Students Apply Now for Endurance Fall Shipboard Experience
Upcoming cruise volunteer opportunity on NSF Ocean Observatories Initiative Coastal Endurance Array Expedition
When: Leave Newport, Oregon on October 4, 2024; return to Newport on October 20, 2024
Applications Due: August 30, 2024
There is an opening for a student volunteer in the Fall 2024 as part of the U. S. National Science Foundation Ocean Observatories Initiative (OOI) Coastal Endurance Array on R/V Sikuliaq. The Coastal Endurance Array team will deploy and recover oceanographic moorings, profilers and gliders off Washington and Oregon. Seven surface moorings will be deployed and recovered along with up to four profilers and six gliders. The team will also conduct CTD (Conductivity, Temperature, and Depth) casts, with bottle sampling, and collect underway ship data for comparison to data from deployed equipment.
The selected volunteer will have the opportunity to assist in the deployment and recoveries of moorings and water sample processing. They will also have opportunities to work directly with OOI data. The cruise will consist of two legs, each lasting about 8 days. Interested applicants can apply to participate on either or both legs. Domestic (within the USA) travel reimbursement is possible.
The primary goal of this program is to provide graduate students currently completing (or who have recently completed) a degree in a field of oceanographic research with the opportunity to participate in a research cruise. The participant will be a member of the scientific party and be involved in data collection and all other activities at sea. It is envisioned that the individual will be familiar with the science to be conducted at sea, and thus, form new collaborations and potentially develop new research directions. To be eligible to participate, the individual must either currently be studying at a U.S.-based institution or be a recent graduate, and have either a U.S. Passport or an applicable U.S. Visa.
Questions and application materials should be sent to Edward.Dever@oregonstate.edu. Application materials are:
- a CV or resume
- a one page letter of interest describing how this opportunity fits their professional and/or research interests
- contact information for two references.
For a first-hand view of what to expect at sea, check out this video.
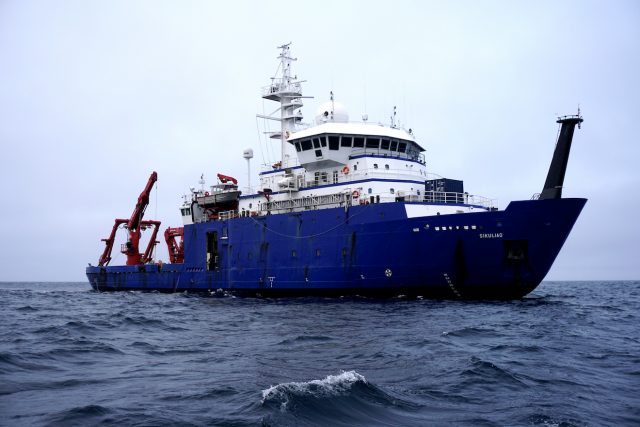
[media-caption path="https://oceanobservatories.org/wp-content/uploads/2024/06/Sikuliaq-1.jpeg" link="#"]R/V Sikuliaq, University of Alaska Fairbanks.[/media-caption] Read MoreIan Black: Taking Inspiration from OOI
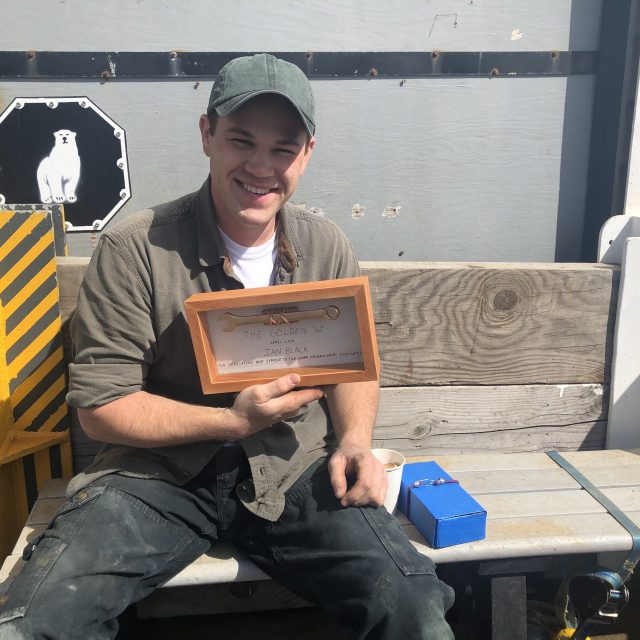
As an undergraduate at Oregon State University (OSU), Ian Black attended an oceanography course taught by the OOI’s Coastal Endurance Array Principal Investigator Ed Dever, where he was introduced to key oceanographic concepts and the observational capacity of the OOI. Black was so intrigued by the work that he approached Dever and asked about an internship with the OOI Endurance Array.
“Initially it was scraping barnacles, turning wrenches, very dirty and manual labor,” explained Black. “And I liked it. The project and its mission made sense to me.” The OOI provided Black with his first experience at sea, the Regional Cabled Array’s VISIONs cruise in 2015, where he sailed with another OOI alum Katie Bigham. Toward the end of his internship and undergraduate program, Black was interested in continuing to work on the Endurance Array and was encouraged to pursue a master’s degree. Throughout graduate school, Black continued to work part-time on the Endurance Array, continuing to scrape barnacles, but also gained some experience in electronics and coding.
In 2018, Black received his M.S. in Marine Resource Management and was hired on as an Endurance Array technician. Between 2018 and 2021, Black focused primarily on the Coastal Surface Piercing Profilers that are deployed at the CE01, CE02, CE06, and CE07 sites located off Oregon and Washington. He also provided assistance with the large coastal surface moorings and gliders during downtime and cruises.
Not one to sit still too long, Black decided to pursue a PhD, again at OSU in 2021. Black was originally brought on by his co-advisors, Dr. Clare Reimers and Dr. Maria Kavanaugh, to focus on the bio-optical sensors that are to be deployed on the NSF’s new Regional Class Research Vessels. While waiting for the deployment of these vessels, Black has developed a newfound interest in marine heatwaves. Currently, he and his advisors have a manuscript under review where they use OOI Endurance Array data to explore the biophysical impacts of marine heatwaves on phytoplankton.
[media-caption path="https://oceanobservatories.org/wp-content/uploads/2024/05/Profiler-Victory-2-scaled.jpg" link="#"]Left to Right: Jon Fram, Ian Black, Alex Wick, and Steve Lambert pose with a recently recovered profiler. Credit: Oregon State University.[/media-caption]For the next chapter in his PhD dissertation, Black plans to again use OOI data from the Endurance Array to explore the finer scale effects of marine heatwaves over the Oregon shelf. “There are a lot of high-resolution data products from the moorings, profilers, and gliders that could be combined to tell an interesting story”, Black said. In particular, there are some “some really interesting still images from the camera located at the shelf site that coincide with events or phenomena that are commonly introduced in oceanography courses, much like the class Ed (Dever) taught all those years ago. Seeing these things with real data really reinforces those core oceanographic concepts.” Black hopes that this work will end up as a second manuscript, but at the very least “the code and results can be used as a tool, perhaps in the classroom, to show students that the concepts they learn about are supported with modern data.” Black added that has been instrumental in his PhD research. He uses it between several times per week to review, process, and assess data.
“The OOI Endurance Team has been supportive at every stage of my career so far, not just the OOI ones. “It’s a great place to work and Ed (Dever) and Jon (Fram) work hard to keep people invested in the project.” The few years working as a technician and almost decade of interaction with the OOI has been an important part of my development. Black added, “I even missed the camaraderie so much that I recently volunteered to join the 20th deployment of the Endurance Array (EA20) this past spring.” As an undergraduate, Black’s first Endurance cruise was EA5.
Black brings an interesting perspective to OOI data. He now looks at it from the vantage point of a scientist and how it can be used to answer questions, as well as from an engineering viewpoint on how data are collected in such a unforgiving marine environment. “The amount of data offered by OOI is daunting and is going to take anyone, regardless of data analysis skill level, a long time to look through. In my opinion, it is particularly important for graduate students, who might have more time to look at the data, to just start looking to see what they can find.” Black gave an example of the richness and uniqueness of data available. In 2019 as the Blob 2.0 marine heatwave was expanding in the Northeast Pacific, he was deploying an OOI profiler at the Oregon shelf site (CE02SHSP). Due to platform malfunction, operator error, or a combination of, the profiler decided to surface every 20 minutes for 2 days instead of the typical 12 hours for 2 months. Black hopes that something interesting could be found in this data and thinks it could make for a good term project for a class. “It’s very interesting data and it’s public’s data.” If Black stays in academia, he plans to encourage his students to explore open data collected by groups such as the NSF’s OOI.
Read More
Widespread and Increasing Near-bottom Hypoxia in Pacific NW Coastal Ocean
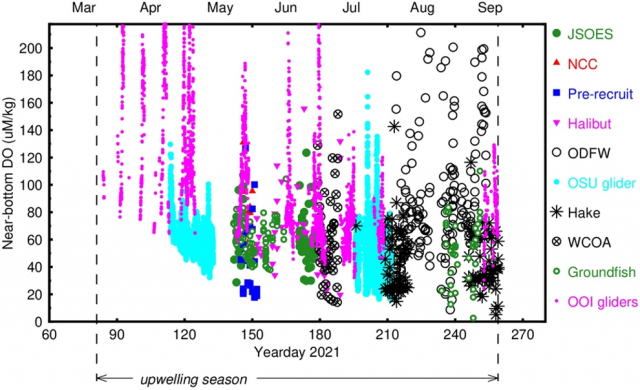
Barth et al. (2024) examined the 2021 summer upwelling season off the United States Pacific Northwest coast. Upwelling was unusually strong leading to widespread near-bottom, low-oxygen waters. During summer 2021, an unprecedented number of ship- and underwater glider-based measurements of dissolved oxygen were made in this region. Near-bottom hypoxia, that is dissolved oxygen less than 61 µmol kg−1 and harmful to marine animals, was observed over nearly half of the continental shelf inshore of the 200-m isobath, covering 15,500 square kilometers. A mid-shelf ribbon with near-bottom, dissolved oxygen less than 50 µmol kg−1 extended for 450 km off north-central Oregon and Washington. Spatial patterns in near-bottom oxygen are related to the continental shelf width and other features of the region. Maps of near-bottom oxygen since 1950 show a consistent trend toward lower oxygen levels over time. The fraction of near-bottom water inshore of the 200-m isobath that is hypoxic on average during the summer upwelling season increases over time from nearly absent (2%) in 1950–1980, to 24% in 2009–2018, compared with 56% during the anomalously strong upwelling conditions in 2021. Widespread and increasing near-bottom hypoxia is consistent with increased upwelling-favorable wind forcing under climate change.
As part of their analysis, Barth et al. (2024) used NSF OOI glider data from 2021 along the Newport Hydrographic Line along with other data indicated in Fig x.. Near-bottom dissolved oxygen data from each survey as a function of time show the typical decrease of minimum values as the summer hypoxia season proceeds (Fig. x). High DO values are measured by the OOI gliders early in the upwelling season when winds were relaxed or downwelling-favorable early in the upwelling season, and by the Oregon Department of Fisheries and Wildlife (ODFW) survey that focused on very shallow (water depths of 50 m or less), inshore waters.
[media-caption path="https://oceanobservatories.org/wp-content/uploads/2024/05/Endurance-Figure.png" link="#"]Figure x Near-bottom dissolved oxygen as a function of time during the 2021 summer upwelling season.[/media-caption]__________________
Reference:
Barth, J.A., Pierce, S.D., Carter, B.R. et al. Widespread and increasing near-bottom hypoxia in the coastal ocean off the United States Pacific Northwest. Sci Rep 14, 3798 (2024). https://doi.org/10.1038/s41598-024-54476-0
Read MoreEndurance Team Overcomes All Challenges to Complete its 20th Expedition
“Early spring cruises always present some weather challenges and this year was no exception,” said Coastal Endurance Project Manager and Chief Scientist on the Endurance 20 Expedition Jonathan Fram.
For this, the twentieth NSF OOI Coastal Endurance Array cruise, conditions were typical for the time of the year in the northeast Pacific. Temperatures on deck ranged from 44-52 degrees F. Winds blew in from the north at a low of 5 and up to 25 knots. Wave heights were up to 12–15-foot swells. In short, there was a lot to contend with, which forced the R/V Sikuliaq and the Endurance 20 team to sit it out in port for two weather days, waiting for conditions to abate.
“We re-arranged the schedule to take advantage of intermittent weather windows and are pleased that we succeeded in accomplishing almost all of our mission objectives. We appreciate being one of the first cruises of the year because it allows us to get fresh moorings in the water around the time of spring transition. In spring, the predominant wind direction shifts to from the North, which upwells water along the West Coast.”
Despite the less-than-ideal working conditions, the Endurance 20 team and crew of the Sikuliaq got the job done. They successfully completed all cruise activities except for the deployment of the Washington Inshore Coastal Surface Piercing Profiler and one glider. Both had failed pre-deployment checks. Since both gliders and CSPPs can be deployed from smaller boats, the decision was made to hold their deployments. Ship reservation requests have already been made to get them into the water later this spring.
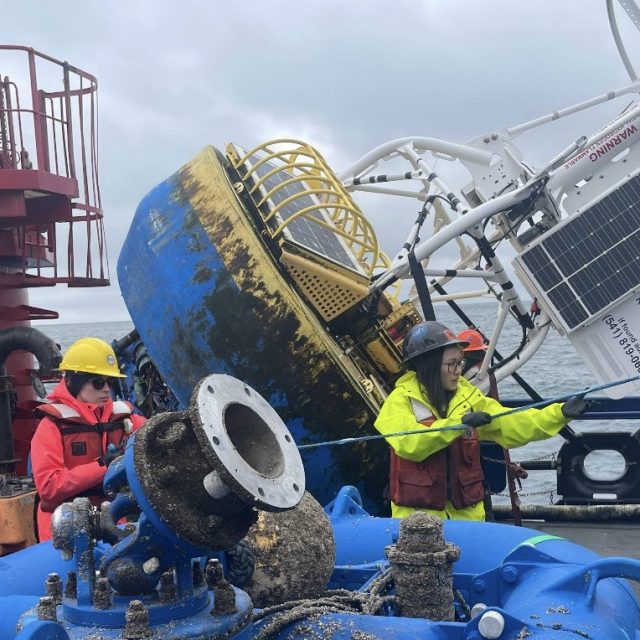
In total, the team recovered and deployed six surface moorings (two battery powered buoys and four large buoys powered by wind and solar energy), one offshore and two surface piercing profiler moorings (CSPP), and three gliders. One glider experiencing navigation issues was recovered. CTD casts (to measure conductivity, temperature, and depth) and water sampling were conducted along with each mooring operation.
[media-caption path="https://oceanobservatories.org/wp-content/uploads/2024/04/Sea-lions.jpeg" link="#"]California sea-lions haul out on Endurance Array shelf buoys during the day. These buoys ride higher at night, which corresponds to when the sea-lions leave to feed. Aluminum guards keep the sea-lions off the solar panels and prevent sea-lions from chewing wires and connectors. The team sprayed off biofouling after getting the buoy on board. Credit: Jonathan Fram, OSU.[/media-caption]The expedition marked several firsts: This was the first cruise in which all buoy deck solar panels on all moorings operated for the entire previous deployment. This was also the first deployment in which all buoys incorporated new sea lion guards, thanks to the idea and implementation by Deck Lead Alex Wick. This was also the first time that Raelynn Heinitz took the reins of deck lead from Alex Wick. There were other less notable firsts. A field of crab pots surrounded the Inshore Washington Mooring. One derelict pot was even found far offshore wrapped around the Washington shelf mooring. The crab pots posed extra hazards that the Sikuliaq and recovery team had to maneuver around.
[media-caption path="https://oceanobservatories.org/wp-content/uploads/2024/04/Crab-pots-.jpg" link="#"]Image of crab pots surrounding the ship as the R/V Sikuliaq and the Endurance 20 team were adjacent to the Washington Inshore Surface Mooring. The primary purpose of this radar is to detect sea ice, but it works well on crab pot floats too. The circle’s radius is ¾ nautical miles. Credit: Jonathan Fram, OSU.[/media-caption]In addition to the mission objectives, the Endurance Team successfully completed ancillary scientific operations. They helped scientific partners University of South Carolina researcher Eric Tappa and Oregon State University student Faith Schell recover and deploy a sediment trap adjacent to OOI’s Oregon Slope Base site. This is part of an ongoing research effort of OSU Associate Professor Jennifer Fehrenbacher and USC Professor Claudia Benitez-Nelson, who study the geochemistry, biomineralization, and marine biology of the sediments. The Team also deployed fish tag readers for OSU Assistant Professor Taylor Chapple to support his work studying sharks and other large marine predators.
“These ongoing collaborations with scientists are beneficial to everyone,” added Fram. “They not only maximize the use of ship time but increase the understanding of the areas in which we are gathering data. Plus, it’s great for us who do the data gathering to interact directly with the scientists who are using the data.”
A review of the day-to-day operations of the Endurance 20 Team can be found here.
Read More
Endurance Array Reaches 20th Deployment
Since 2014 when the U.S. National Science Foundation Ocean Observatories Initiative Coastal Endurance Array was first deployed in the waters off the coasts of Oregon and Washington, the array has been turned – that is moorings were recovered and replaced with new – 19 times. The upcoming expedition on March 28th, with 15 scientists and engineers aboard the R/V Sikuliaq will be the 19th time that the array has been pulled out of the water and replaced, and the 20th time the array has been deployed.
Over the past nine years, the turns have happened every six months, except for in 2020 when COVID restrictions caused the Endurance team to space two consecutive turn cruises 9 months apart. Regular recovery and deployments are needed to ensure the observing equipment stays operational.
“The EA team has really gotten proficient at turning the arrays,” said Jonathan Fram, the Endurance Array’s Project Manager, who will serve as the Chief Scientist for this expedition, his 10th time leading the effort. “We’ve made many technical improvements over the years to combat the powerful and ever-changing conditions of the Northeast Pacific Ocean so that we can continue to collect and report continuous ocean data from this important region.”
The 20th expedition will begin and end at the Oregon State University’s newly renovated pier in Newport, Oregon. The arrays and associated equipment will be transported to Newport from Corvallis in six tractor trailer trucks. Because of the large size of these components, the expedition will be conducted in two legs. The first leg will head to the Washington site, with a transit time of 2/3’s of a day. The second leg will be to the Oregon site. In total, the team will recover and deploy six surface moorings (two battery powered buoys and four large buoys powered by wind and solar energy), one offshore and three surface piercing profiler moorings, and four gliders. One glider experiencing navigation issues will be recovered. CTD casts (to measure conductivity, temperature, and depth) and water sampling will be conducted along with each mooring operation.
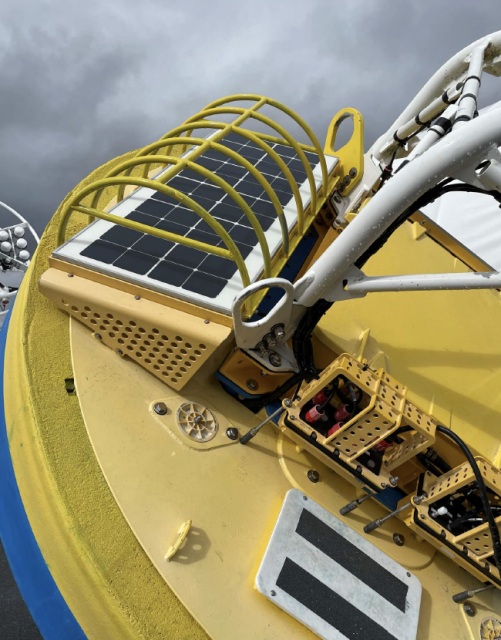
This 20th trip includes several technical improvements. The line used on the Heavy Lift Winch has been increased in size to improve load strength and safety. Each buoy will include a covered wagon style guard against sea lions, who regularly use the buoys as rest stops. All batteries have been replaced or upgraded. Additional improvements have been made that will result in better real-time wind data, and underwater camera operations. The Endurance 20 team also will be deploying new test instruments to see if they might improve data gathering for wind, pH, and partial pressure of carbon dioxide.
[media-caption path="https://oceanobservatories.org/wp-content/uploads/2024/03/Screenshot-2024-03-21-at-11.54.35-AM.png" link="#"]To dissuade sea lions that regularly stop and rest on Endurance Array buoys, OOI engineers have ingeniously devised a steel cover to protect the solar panels that provide power to the mooring. Credit: Jonathan Fram, OSU.[/media-caption]“The order of operations will in part depend on conditions,” added Fram, who joked, “but we expect this trip to be easier than last spring’s, which was three weeks earlier, when we were preparing for the cruise in the snow.”
In addition to regular operations, the Endurance Team will be joined by scientific partners. University of South Carolina (USC) researcher Eric Tappa and Oregon State University (OSU) student Faith Schell will be onboard to help turn a sediment trap adjacent to OOI’s Oregon Slope Base site. This is part of an ongoing research effort of OSU Associate Professor Jennifer Fehrenbacher and USC Professor Claudia Benitez-Nelson, who study the geochemistry, biomineralization, and marine biology of the sediments. Additionally, the team will be deploying fish tag readers for OSU Assistant Professor Taylor Chapple to support his work studying sharks and other large marine predators.
The expedition’s progress will be reported daily. Bookmark this page and follow along as the work unfolds.
Read More
Diel Vertical Migrators Respond to Short-Term Upwelling Events
Sato and Benoit-Bird, in their 2024 publication, explore how animals remain in a productive yet highly advective environment in the Northern California Current System using NSF OOI Regional Cabled Array (RCA) and Endurance Array (EA) data from the Oregon Shelf site. They characterized fish biomass using upward-looking active bio-acoustic sonar data from the RCA and interpreted results in consideration of upwelling and downwelling using EA wind data and combined cross-shelf velocity data from the RCA and EA.
Acoustic scatterers, consistent with swim bladder-bearing fish, were only present during the downwelling season as these animals avoided the cold waters associated with strong upwelling conditions in summer and fall. Fish responded to short-term upwelling events by increasing the frequency of diel vertical migration. Throughout the study, their vertical positions corresponded to the depth of minimum cross-shelf transport, providing a mechanism for retention. The observed behavioral response highlights the importance of studying ecological processes at short timescales and the ability of pelagic organisms to control their horizontal distributions through fine-tuned diel vertical migration in response to upwelling.
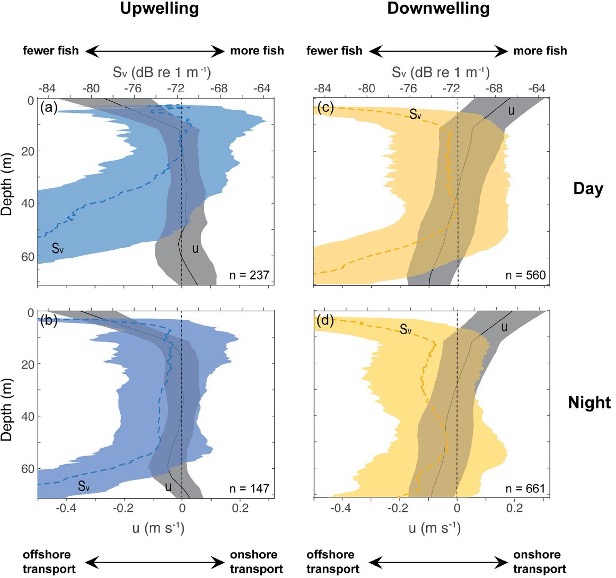
Time series data provided by the combined EA and RCA data made it possible for Sato and Benoit-Bird to perform consistent statistical analyses of bio-acoustic sonar, wind and ocean velocity data [Figure 22, after Figure 4, Sato and Benoit-Bird (2023)]. The vertical positions of scattering layers relative to the cross-shelf velocities revealed the careful positioning of animals at the depth of minimum onshore- offshore transport. The authors focused on cross-shelf transport, the most significant mechanism affecting population dynamics of pelagic organisms. During strong upwelling periods, cross-shelf velocities were strong near the surface and became nearly zero below 15-m depth. The peak scattering layers were in the upper 20 m of the water column during daytime, but organisms avoided the strong offshore currents at the surface (Figure 22a). At night, the scattering layers expanded their vertical distributions, but avoided the region nearest the bottom where onshore currents were strong (Figure 22b). During downwelling periods, scattering layers were located at the depth of minimal transport during day and night and animals avoided strong onshore currents near the surface and offshore currents near the bottom (Figures 22c and 22d).
[media-caption path="https://oceanobservatories.org/wp-content/uploads/2024/02/Science-Highlight-Feb-2024.jpg" link="#"]Figure 22: The influence of upwelling and downwelling on diel vertical migration[/media-caption]Sato and Benoit-Bird show that animals respond to the risk of offshore advection through active changes in their vertical movement that depend on upwelling conditions at daily time scales. Rapid behavioral response of animals to short-term upwelling events highlights their ability to finely tune their vertical positions relative to physical forcing which ultimately controls their horizontal distributions. This work expands our understanding of the ecological role of diel vertical migration beyond its role as a predator avoidance strategy and reveals a tight coupling between animal behavior and physical forcing.
Vertical profiles of cross-shelf velocities (u; gray, solid lines) and volume backscattering strength (Sv; colors, dotted lines), shown as mean ± standard deviations, during (a, b) strong upwelling periods with diel vertical migration and (c, d) strong downwelling periods without diel vertical migration. Data points qualified for strong upwelling and downwelling periods were selected from the time series over 14 months. Negative values in u indicate offshore transport and positive values indicate onshore transport, and larger Sv values suggest higher density of swim bladdered fish.
Read More
Battling the Corrosive Properties of Seawater
OOI engineers face the challenge of keeping ocean observing equipment operational in demanding locations for up to a year at a time. In addition to wind, waves, extreme pressure, ship traffic and trawling disruption, engineers continually battle the corrosive properties of salt water.
Senior Technician for OOI’s Coastal Endurance Array Kristin Politano provided a primer on OOI’s tactics to prevent corrosion of its equipment and instrumentation. “It’s a fun balancing act between cost versus strength versus weight versus durability. Different metals are great for certain things, so we use them in different places.”
OOI engineers try to avoid all forms of corrosion, especially galvanic corrosion, an electrochemical process where one metal corrodes preferentially in the presence of an electrolyte. In this case, seawater serves as the electrolyte or the corrosion “enabler.” When two dissimilar metals are connected in seawater, one of them is going to corrode faster than the other.
Since zinc is very prone to corrosion and corrodes much faster than other materials used on OOI moorings, engineers use it as a “sacrificial lamb” in OOI operations. They place zinc strategically on the moorings to encourage galvanic corrosion to occur on the zinc, rather than degrading instruments, electronics, and the frames that hold the moorings and instrumentation in place.
Politano gave an example of how zinc works to protect other metals used on the moorings. Aluminum is used on the Coastal Surface Piercing Profiler frames (CSPP), the Near-Surface Instrument Frames (NSIF), a cage that contains ocean observing instruments below surface moorings, and Multi-function Nodes (MFN) frames, which are at the base of some surface moorings and act both as anchors as well as platforms to affix instruments.
[media-caption path="https://oceanobservatories.org/wp-content/uploads/2024/01/IMG_376765-scaled.jpg" link="#"]Members of the Coastal Endurance Team deploy a Coastal Surface Piercing Profiler (CSPP) into the Pacific off the coast of Oregon. The zincs are the bare metal disks attached to the CSPP frame near loops at the top of the frame. Credit: Jon Fram, OSU.[/media-caption]The NSIF, MFN, and CSPP have sacrificial zinc cylinders attached so that when the frames containing the instruments go into the water, the aluminum doesn’t degrade as quickly as it might otherwise. The zinc will degrade first, providing a protective layer for the important assets within the frames. “Zinc serves as a really effective form of galvanic corrosion protection,” Politano added. “Zincs come in many different form factors, but we use ones that can be bolted directly to the mooring frames and other mechanical components,” said Politano.
Location Dictates Effectiveness
Zincs are used on both the Coastal Endurance’s inshore and offshore mooring platforms. The zincs on the inshore platforms dissolve faster and require replacement more often due to low dissolved oxygen conditions and that encourage corrosion. Zincs on the offshore moorings last longer due to a higher oxygenated environment offshore.
Decisions about materials to use on various parts of the moorings also in part, depends on durability, conditions, and cost. Stainless steel is very durable and reacts to form a protective oxide film on its outer surface, but this reaction needs oxygen to grow and repair itself. In areas with hypoxia (lack of oxygen) particularly in the summer months, there is not enough oxygen in the water column for the stainless oxide layer to rebuild and repair itself.
[media-caption path="https://oceanobservatories.org/wp-content/uploads/2024/01/MFN.jpg" link="#"]Coastal Pioneer Array Team members get ready to deploy a 9000-pound multi-function node off the coast of Martha’s Vineyard. Credit: Rebecca Travis © WHOI.[/media-caption]Delrin, a high-grade plastic (acetyl resin), is also used on the moorings as a corrosion preventive measure. Because of Delrin’s durability, stiffness, light weight, and water resistance, Delrin is used in instrument housings and electrical panels because it doesn’t conduct electricity, but it lacks the strength of aluminum. “Delrin is strong, but not as strong as aluminum. So, we wouldn’t make a mooring tower or a mooring Halo out of a plastic material,” said Politano. Components above water are made from aluminum because it is lightweight and extremely strong. To increase strength and resilience, above water aluminum components are powder coated that prevents water from contacting the metal. The powder coating contains various pigments, polymer resins, curatives, leveling agents, and other additives, which is applied to an aluminum surface with an electrostatic spray. “The powder coating is sprayed on, and cured in an oven that triggers a chemical reaction that hardens the coating, making a hard shell, protecting the metal beneath it,” she explained. “A good way to imagine it is like a big M&M covering the chocolate metal inside,” she added.
The OOI team uses silicon bronze (bronze coated with a silica coating) and titanium for many underwater components. The silicon bronze has mild anti-fouling properties, which is important for OOI’s coastal arrays to help reduce biofouling. The mooring components go from a bright coppery color to a green, blue patina color. The patina acts as a durable, strong, protective layer that is highly resistant to corrosion and doesn’t fatigue. “We use silicon bronze to bolt instrument clamps to MFN and NSIF frames and to attach instrument to the frames. The benefit of silicon bronze is that it is much cheaper than some of the other materials like titanium, so we can afford to use it many places,” said Politano.
Balancing Cost and Placement Considerations
Titanium is a fantastic material to use in the marine environment because it is highly corrosion resistance, very strong, and can remain in a marine environment for a long time. The downside is that it is very expensive, so it is used judiciously. Titanium also has a high strength to weight ratio, which makes it ideal for floating things in the water column and it is used to bolt together all of the critical structural mooring components. For instance, titanium bolts are used to connect surface buoys to the electromechanical chain (EM), which contains electrical components allowing power and communication with the below surface elements, to the NSIF and stretch hoses to the MFN, which anchors the mooring on the sea floor. Like stainless steel, titanium has a protective oxide layer with the ability to “heal itself.”
In addition to strength, durability, and cost the OOI team must consider the mix of materials it uses, avoiding places where two metals might touch each other. For example, copper is used as a primary anti-fouling material to mitigate the ever-present challenge of minimizing marine growth. Copper is soft so it isn’t used to attach critical mooring components. Care must be taken to avoid any dissimilar metals coming in contact with one another. The outcome of such contact would be an extreme case of galvanic corrosion!
“It really is this sort of ballet of trying to balance the cost of the material versus the strength of the material versus the weight. We put lightweight materials above the water. The expensive materials that are really strong are used to hold the whole mooring together. And then the in-between materials that are strong, but not as expensive as the really strong materials, are used to hold all the instruments together. So, it’s a fun little balancing act,” Politano concluded.
As it turns out choosing the right materials also is a good return on investment. According to OOI Lead Systems Engineer Matthew Palanza, “While the cost of these corrosion-prevention materials is high, the loss of equipment and data due to failures caused by corrosion is much greater. Incorporating corrosion-prevention materials into the array extends their service life much longer. This makes it possible for some housings, connectors, and other components to be re-used every time an array is redeployed. In fact, some housings are designed to last for the 30-year duration of the program.”
Read More