
Posts Tagged ‘Coastal Endurance Array’
Biofouling Mitigation from Top to Bottom
OOI operates its arrays in challenging environments. At the sea surface, sea lions find the buoys attractive resting spots. At the bottom, instruments must collect data under varying temperatures at intense pressures. And, then throughout the water column’s photic zone is marine growth. Marine life finds OOI’s instrumentation and arrays irresistible, where it attaches and grows like gangbusters.
The folks who keep OOI’s arrays operational explain the conditions this way:
“Putting any kind of instrumentation – electrical or scientific instrumentation – in the water for a year or more at a time is always a challenge, said Dana Manalang, Engineer, OOI Regional Cabled Array (RCA). “It’s a harsh environment due to the high pressures and salt water so getting systems to operate sub-seas is the largest challenge we face.”
“It’s a challenging place to work,” concluded Coastal Endurance Array Project Manager Jonathan Fram, “And, we are very thankful to have the opportunity to make stuff that can survive in just about any marine environment.”
So how do they do it? OOI engineers develop creative ways to tackle the many challenges, particularly in terms of some of the peskier, persistent ones like keeping marine growth, referred hereafter as biofouling, at bay.
Diaper cream as a solution
Coastal and Global Scale Node (CGSN), Coastal Endurance, and RCA team members have implemented novel ways to minimize and in-situ clean marine growth on sensors, gliders, and components of the arrays that spend up to 12 months in the water.
One such novelty is the application of diaper cream. An inexpensive and convenient form of zinc oxide, diaper cream, has been used for decades as a marine anti-foulant, with moderate effectiveness. . “Its application for oceanographic equipment goes back at least to the 1990’s, and is considered non-toxic relative to other concoctions, “ explained Peter Brickley, CGSN Observatory Operations Lead. Other anti-fouling scheme exist, but some are expensive, some add weight, while others take too long to apply and don’t fit into the team’s operational deployment plans.
“The only downside is that diaper cream has be to done onboard right before deployment, or it’s a mess,” he added.
Coastal Endurance Project Manager Jonathan Fram said, “One key issue is that gliders are made of aluminum, so we can’t use copper-based antifouling material on them. Diaper cream is zinc-based, so it won’t corrode gliders’ aluminum.” The Coastal Endurance Team regularly applies diaper cream to its glider fleet, with measurable success. “Gliders with barnacles on them can’t swim straight or efficiently. The diaper cream provides a protective coating to which marine growth cannot readily adhere. It helps keep our gliders moving easily through the water and reporting data.”
[media-caption path="https://oceanobservatories.org/wp-content/uploads/2023/12/Diaper-cream-117.jpg" link="#"]Coastal Endurance team members Raelynn Heinitz and Alex Wick apply diaper cream before launch of a glider off the Oregon coast. The ointment prevents marine growth on gliders that traverse the shallow coastal waters near the Endurance Array’s Washington and Oregon-Newport lines. Marine organisms thrive in the shallow water where sunlight can penetrate, aiding marine growth. Credit: Kathy Hough, NOAA.[/media-caption] [media-caption path="https://oceanobservatories.org/wp-content/uploads/2023/12/without-diaper-cream.jpg" link="#"]Shown above is a recovered glider having spent three months in the upper coastal waters off the Washington coast. It would have been covered with marine life, imperiling its ability to maneuver, but the protective diaper cream kept most of them at bay. Credit: Kathy Hough, NOAA.[/media-caption]After being successfully tested on gliders, the Coastal Endurance Array and RCA teams then tried the protective diaper cream as an option to keeping acoustic transducers on the arrays clean, as suggested by the vendor. An acoustic transducer is an electrical device that vibrates, producing sound waves in water. OOI uses transducers in both echosounders and hydrophones. Here, too, the diaper cream proved to be an inexpensive and effective biofouling mitigation measure.
[media-caption path="https://oceanobservatories.org/wp-content/uploads/2023/12/acoustic-transducer.jpg" link="#"]An acoustic transducer covered with diaper cream to prevent biofouling during its six-months in the water. Credit: Kathy Hough, NOAA.[/media-caption]Addition of UV lights
Putting ultraviolet lights in the water to discourage marine growth is another proven biofouling mitigation measure. Early on, the Coastal Endurance team deployed two oxygen optodes, which measure dissolved oxygen, side-by-side at seven meters depth on the Oregon Shelf Surface Mooring with a UV light pointed at one of them. Data from the two sensors tracked each other for six weeks after which the unprotected sensor fouled. Within weeks, there were daily afternoon spikes of up to twice the oxygen level of the protected sensor, with slightly lower measurements than the unprotected sensor at night due to respiration of the biofilm. Since this test, optodes are regularly deployed with UV lights to aid their operation. (Annotations of OOI moored oxygen data note when a UV light was not operating with it.)
Following the success of the UV-light on dissolved oxygen sensors, the CGSN team tested this antifouling measure on a moored Coastal Pioneer Array spectral irradiance (SPKIR) sensor, which measures the amount of light energy that reaches a surface. The testing was conducted with Sea Bird Scientific, the SPKIR vendor. The vendor confirmed that the UV light did not damage the instrument’s optics nor did it interfere with its light measurements. After this confirmation and positive result, UV lights are now used on all SPKIR sensors on Surface Moorings, Coastal Surface Piercing Profilers, and uncabled digital still cameras moored at less than 70 meters. The teams adjust the on/off cycle of the UV lights so that biofouling is prevented without damaging the sensors, interfering with measurements, or using too much power.
[media-caption path="https://oceanobservatories.org/wp-content/uploads/2023/12/Screenshot-2023-11-27-at-6.02.17-PM.jpeg" link="#"]Sea Bird Scientific’s spectral irradiance sensor needs to be clean to effectively measure light energy in the water column. Shining UV lights on these sensors helps to minimize biofouling and clouding of the sensor.Credit: Sea Bird Scientific.[/media-caption]Lens-Cleaning Brushes
The RCA also has adopted novel ways to deal with biofouling on the Pacific Ocean seafloor. RCA operates and maintains a high-definition (HD) video camera (CAMHD) at the base of an actively venting hydrothermal chimney called “Mushroom” (see below) in the ASHES vent field of Axial Seamount Caldera. Live HD video of this > 4-m high chimney and surrounding seafloor is streamed to shore on an automated schedule for 14 minutes at 3-hour intervals, with longer non-stop monitoring for 24 hours twice a month and 72 hours at the beginning of each month.
[media-caption path="https://oceanobservatories.org/wp-content/uploads/2023/12/Figure-a.jpg" link="#"]RCA’s high-definition video camera installed next to “Mushroom” hydrothermal chimney in the ASHES vent field of Axial Caldera. Credit: UW/NSF-OOI/WHOI; J2-1534, V23.[/media-caption]The scene is fully scanned with programmable pan, tilt, and zoom functions of this instrument, which provides detailed imagery of the high-temperature water spigots, sea spiders, lipets tube worms and other biota covering both the chimney and surrounding lava-covered seafloor.
[media-caption path="https://oceanobservatories.org/wp-content/uploads/2023/12/Figure-b.jpg" link="#"]Close-up of the RCA HD video camera at the base of “Mushroom” hydrothermal chimney. Credit: UW/NSF-OOI/WHOI; J2-1534, V23.[/media-caption]Unfortunately, such live subjects, microorganisms, and other organic/inorganic processes often deposit a film on the camera lens which interferes with visualization. To ensure optimal clarity of HD video between site maintenance visits during annual RCA operation and maintenance expeditions, an automated lens cleaning protocol using a simple brush, installed on the instrument’s frame in the front of the lens has been instituted.
[media-caption path="https://oceanobservatories.org/wp-content/uploads/2023/12/Figure-c-.png" link="#"]Lens-cleaning brush, indicated by red arrow, installed in front of RCA’s HD video camera and used during an automated cleaning protocol. Credit: UW/NSF-OOI/WHOI; J2-1534, V23..[/media-caption]This programmed event occurs three times a month and tilts the camera down and pans it left and right, allowing the brush to gently clean the lens. The video streaming and lens cleaning schedules can be optimized remotely from shore by RCA personnel to provide the highest scientific and educational value from the HD video.
Eco Anti-fouling paint
Ever wonder why OOI’s buoys are painted blue? This eco-friendly paint serves the same purpose as diaper cream and UV lights—to minimize marine growth on the buoys and its metal components. The teams use a commercially available water-based and copper-free anti-fouling paint. Once recovered, the CGSN and Coastal Endurance Array components are taken apart and refurbished so they function like new once ready to be redeployed. All metal components and float areas are cleaned and receive a fresh coat of paint in the hope of diminishing their attractiveness to life below the surface.
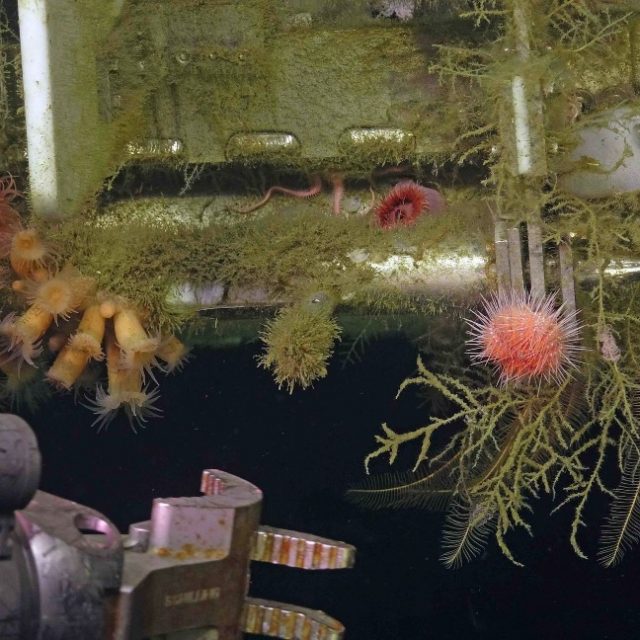
[media-caption path="https://oceanobservatories.org/wp-content/uploads/2023/12/predeployment.png" link="#"]Pre-deployment: The Coastal Pioneer buoys assembled, painted and ready for deployment for six months in the Atlantic Ocean, off the coast of Martha’s Vineyard. Credit: Derek Buffitt © WHOI.[/media-caption] [media-caption path="https://oceanobservatories.org/wp-content/uploads/2023/12/Biofouled-mooring-in-air-2023-03-17-13-33-17-2.jpg" link="#"]After six months in the northeast Pacific, the Coastal Endurance Surface mooring buoy had become a rich habitat for marine life. Credit: Kim Kenney, OSU.[/media-caption] [media-caption path="https://oceanobservatories.org/wp-content/uploads/2023/12/Pink-sea-urchins.jpg" link="#"]Biofouling can be beautiful, as demonstrated here as the ROV Jason prepares to recover the RCA Shallow Profiler during its annual operations and maintenance expedition. Credit: UW/NSF-OOI/WHOI; J2-1516: v23.[/media-caption]
Read More
NSF Grants OSU Ocean Research Consortium $220 million
The Daily Barometer reported on a recent National Science Foundation $220 million award to a consortium of ocean research institutions — Woods Hole Oceanographic Institution, Oregon State University and the University of Washington — to carry on the operation and maintenance of the NSF-funded Ocean Observatories Initiative. The funding runs through 2028. Read the article here.
Read MoreA Three Stream Ocean Optics Model
A Three Stream Ocean Optics Model: Regional Implementation and Validation. Adapted by OOI from Miller M., 2022.
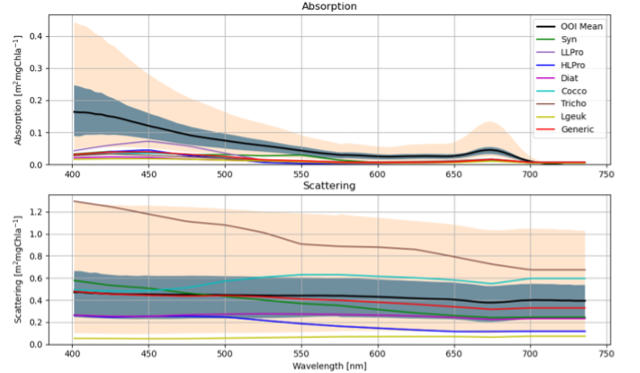
[media-caption path="https://oceanobservatories.org/wp-content/uploads/2023/07/EA-science-highlight.png" link="#"](Figure 3.10 from Miller (2022) Top: The black line shows the mean OOI absorption as a function of wavelength for OOI Endurance CSPP Oregon shelf deployment 15 (August – Sept 2019). The gray shading shows the OOI absorption extent between the 20% and 80 % quantiles. The tan shading shows the maximum and minimum extent of OOI absorption. The colored lines correspond to the modeled absorption for different single species approximations. Bottom: Same as top, but for scattering instead of absorption.[/media-caption]Miles Miller used OOI data as part of this MS thesis awarded September 2022 from the Univ. California, Santa Cruz. The goal of his work was to develop the potential to estimate phytoplankton community structure from remotely sensed optical information and not direct in situ phytoplankton observations. As a step towards this goal, he estimated phytoplankton community structure using spectrally dependent optical absorption and scattering data from an AC-S on the Oregon Shelf profiler. Miller developed linear relationships between modeled phytoplankton absorption and scattering and corresponding observations and solved them by constrained least squares inversion over a field of thirteen wavelengths using six phytoplankton types. He solved the problem for independent absorption and scattering as well as coupled absorption and scattering. He estimated phytoplankton communities as a function of profile depth and for multiple profiles in time.
The model produced accurate downward irradiance fields when using observed absorption and scattering profiles obtained from the Ocean Observatories Initiative’s Oregon Shelf Surface Piercing Profiler Mooring. Through this forward modeling-based comparison to observations it was found that the optical model can produce accurate profiles under certain conditions, making it promising for data assimilation of remote sensing reflectance as a function of wavelength. Miller identified several outstanding issues remaining to be addressed to move from using in situ measured absorption and scattering to estimates from remote sensing reflectance. Because the optical model accuracy is primarily dependent on absorption and scattering, he argued that remote sensing reflectance accuracy can be improved with enhanced phytoplankton community structure and CDOM estimations (see Figure 3.10 from Miller (2022). This figure shows that the modeled phytoplankton light attenuation agrees well with the measurements but that modeled absorption underestimates measurements. This underestimation hints that chromophoric dissolved organic matter (CDOM) is not being properly resolved as CDOM affects only total absorption and not scattering.
_________________________________________
Miller, M. (2022). A Three Stream Ocean Optics Model: Regional Implementation and Validation (master’s thesis). University of California, Santa Cruz. 62 pp.
Read MoreCollaborative Data Partnership Providing Fuller, More Robust Picture of Conditions in Northeast Pacific
A new data initiative involving more than 20 years of oceanographic data from Olympic Coast National Marine Sanctuary (OCNMS) promises to provide scientists and the public with a more robust picture of changing ocean conditions within the sanctuary and Northeast Pacific Ocean.
Funded by the National Oceanic and Atmospheric Administration’s (NOAA) Climate Program Office, a team from Oregon State University is working to make 23 years of sanctuary mooring data and data from CTD (Conductivity, Temperature, and Depth) casts available through publicly accessible data repositories. The three-year project will also combine the sanctuary’s data with complementary data sets in the region, including data from the Ocean ObservatorIes Initiative (OOI) Coastal Endurance Array.
“The OCNMS data are a critically important data set that has not been fully unlocked and represents a treasure chest of information that we’ve only begun to crack open,” said Jenny Waddell, research coordinator at Olympic Coast National Marine Sanctuary and a collaborator on the project. “The data will provide information about marine heat waves, changes in timing of spring transition to upwelling, seasonal hypoxia, and ocean acidification, all of which will help improve the management of marine resources in the sanctuary.”
Olympic Coast National Marine Sanctuary, along Washington State’s outer coast, represents one of North America’s most productive marine ecosystems. An area of summertime upwelling of cold nutrient-rich waters, the sanctuary hosts a diverse ecosystem that is home to many commercially and culturally important fisheries.
[media-caption path="https://oceanobservatories.org/wp-content/uploads/2023/06/SP_stern_JWaddell_Aug2021.jpeg" link="#"]The stern of the R/V Storm Petrel hints at some of the enhanced capacity that this new vessel brings to research on the Olympic Coast, including a larger work area on the back deck, an upper deck for seabird and mammal surveys, a new pot hauler and knuckle boom crane, and a much more capable A-frame and winch. Credit: Jenny Waddell © NOAA.[/media-caption]Collected by 10 oceanographic moorings, the process of taking 23 years of the sanctuary’s quality-controlled data (water temperature, salinity, density, spiciness, velocity, and dissolved oxygen concentration) and meshing them with data from 700 CTD casts is a huge undertaking that will be conducted in multiple steps. The first step was the handover of all processed and raw data by the sanctuary to data experts Brandy Cervantes and Craig Risien at OSU. The data experts, who are Co-PIs on the NOAA project, are going through all the data and reprocessing where necessary to make sure that all the data are interoperable. The high-resolution CTD data are of particular interest, having never been made widely available before. These data will provide information about the water column to complement and validate the data collected by the instruments on the moorings.
OOI’s Contribution
The Coastal Endurance Array’s Washington Inshore mooring is the shallowest of the three OOI moorings off Washington State and lies just inside the sanctuary’s southern boundary. This location helps provide an in-depth look at ongoing conditions nearer the coast. While the other two Endurance Array moorings off Washington State are farther offshore and to the south, not formally within the sanctuary boundaries, they provide valuable year-round data, which are particularly helpful for context on conditions farther offshore from the sanctuary and for regional forecasting and prediction efforts of ocean conditions. Sanctuary moorings are seasonal, collecting data when they are deployed in May through the first week of October when they are recovered, except for a single overwintering mooring, so OOI data also provide important year-round context for OCNMS.
“Data from the other two Endurance Array moorings not within the sanctuary boundary are equally valuable, not just for prediction purposes, but to our tribal partners. A unique thing about the Olympic Coast National Marine Sanctuary is that nearly the entire sanctuary is within the Usual and Accustomed Fishing Areas of the four coastal treaty tribes in Washington — the Hoh Tribe, Makah Tribe, Quileute Tribe, and the Quinault Indian Nation. The sanctuary and OOI-derived data are particularly valuable to the Quinault Tribe, who use these data to estimate fish runs. They have found, for example, that our oxygen data are a good predictor of the Coho salmon run size in some of the coastal rivers,” Waddell explained.
Olympic Coast Data Applications
Sanctuary data are the foundation of the LiveOcean model, an ongoing project of the University of Washington Coastal Modeling Group that provides short-term (three-day) forecasts of ocean conditions—currents, temperature, salinity and biogeochemical fields such as harmful algal blooms. Sanctuary data also are incorporated in the J-SCOPE model, operated by the Northwest Association of Networked Ocean Observing Systems (NANOOS), for seasonal (six to nine month) forecasts of ocean conditions that are relevant to management decisions for fisheries, protected species, and ecosystem health.
Sanctuary and OOI data also serve as the basis for novel estimates of pre-industrial and near future (2030–2050) ocean acidification conditions on the Olympic Coast led by NOAA Pacific Marine Environmental Laboratory ocean carbon scientists. These estimates are made possible by rich NOAA Ocean Acidification Program-funded coastal observing efforts and inform state and tribal fisheries and water quality management (cf. Alin et al. 2023 in press).
Changing Conditions
“In the 23 years that we’ve been collecting data, we have been documenting changing ocean conditions that are quite alarming,” said Waddell. The 465-page latest Condition Report for the Sanctuary details how ocean conditions along the Olympic Coast continue to change and intensify in response to climate change. The report lays out concerns about the impacts from ocean acidification, warming ocean temperatures, increased stratification, rising sea levels, and declines in dissolved oxygen, in addition to the intermittent occurrences from more intense and frequent marine heatwaves, harmful algal blooms, and coastal storms.
[media-caption path="https://oceanobservatories.org/wp-content/uploads/2023/06/IMG_4898.jpg" link="#"]Oceanographic moorings deployed by Olympic Coast National Marine Sanctuary, such as this mooring near Cape Alava, have been tracking changes in ocean conditions along this remote and rugged coastline for more than two decades. Credit: Jenny Waddell ©NOAA.[/media-caption]To help bring this information to the public, the sanctuary has developed a user-friendly and searchable graphic interface that provides easy access to data within the report. Called the Web Condition Report (WebCR), the interface is designed to connect people with information they are interested in.
[media-caption path="https://oceanobservatories.org/wp-content/uploads/2023/06/OCNMS_O2_plots_5panel_2018-scaled.jpg" link="#"]
This is an example of the type of information available through WebCR. Like animals on land, most marine animal species need oxygen to survive. To obtain oxygen, whales and turtles periodically breathe air at the water’s surface, while most fish species obtain oxygen that is dissolved in seawater. Low oxygen levels can harm marine animals or force them to move to areas with more hospitable conditions. Cape Elizabeth in the south (2006–2017), for example, has gotten progressively worse over time and in recent years is hypoxic 44 percent of the time. Image source: Alin et al., 2023 in prep. Also reprinted from: Office of National Marine Sanctuaries. 2022. Olympic Coast National Marine Sanctuary Condition Report: 2008–2019. U.S. Department of Commerce, National Oceanic and Atmospheric Administration, Office of National Marine Sanctuaries, Silver Spring, MD. 453 pp.[/media-caption] “These 23 years of data now being sorted will help us get a handle on what is really going on in the Pacific Northwest. It’s an important microcosm of what’s happening on a larger scale. Only around 25,000 people live along the Olympic Coast between Neah Bay and Ocean Shores, so the human footprint of this place is minimal. Most of what we’re seeing and what the data are telling us are climate forced issues coming to bear here,” added Waddell. “And having our data in the hands of senior oceanographers who know exactly what to do with it is just so incredibly valuable to understand not only what’s happening at the ocean surface, but within the full water column, which is where most of the impacts of climate change are occurring.”
The Principal Investigator (PI) for this project is College of Earth, Ocean and Atmospheric Science (CEOAS) Oregon State University (OSU) Associate Professor Melanie R. Fewings. Co-principal Investigators are Craig M. Risien, OSU Senior Faculty Research Assistant II and OOI Cyberinfrastructure Project Manager; Co-Principal Investigator Brandy T. Cervantes, OSU Senior Research Associate.
In addition to the PIs and NOAA’s Waddell, other collaborators include Dr. Simone Alin, NOAA Pacific Marine Environmental Laboratory, Katie Wrubel, Resource Protection Specialist, OCNMS, Joe Schumacker, Marine Resources Scientist, Quinault Indian Nation, Dept. of Fisheries, Tommy Moore, Oceanographer, Northwest Indian Fisheries Commission, Charles Seaton, Senior Oceanographer, Columbia River Inter-Tribal Fish Commission, Kym Jacobson, Research Zoologist, NOAA Northwest Fisheries Science Center, Jennifer Fisher, NOAA Cooperative Institute for Marine Ecosystem and Resources Studies, OSU, and Maria Kavanaugh, Assistant Professor, CEOAS, OSU, and Principal Investigator of the Marine Biodiversity Network.
Read More
Forecasting Hypoxia to Support the Dungeness Crab Fishery
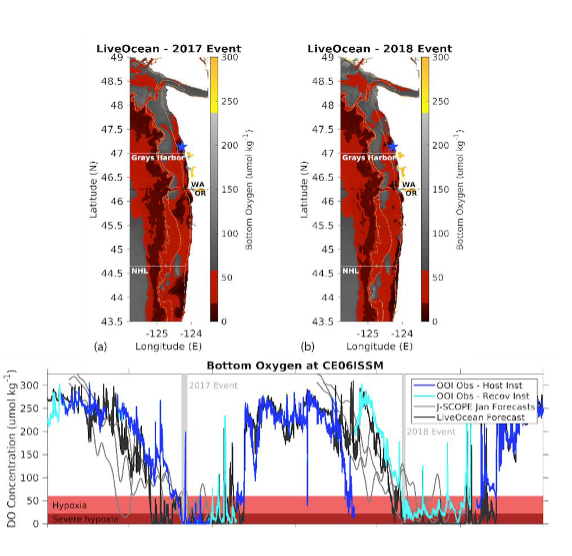
Hypoxia is regularly experienced in Washington and Oregon waters and has been linked to mass mortality events of hypoxia-intolerant species, including the valuable Dungeness crab. The Coastal Endurance Array is aiding the development of a hypoxia forecasting system in this region.
Read MoreIdentifying Impacts of Ocean Acidification and Hypoxia
Ocean acidification has emerged as a leading threat to marine ecosystems, and the fisheries and shellfish growers that depend on a productive and vibrant ocean. The Coastal Endurance Array in the Pacific Northwest array is situated in an epicenter for early impacts from the co-occurrence of ocean acidification and hypoxia.
Read MoreInternal Tide Impacts on Ocean Circulation
Internal tides (ITs) have critical roles in determining the meridional overturning circulation and oceanic heat budget. The Regional Cabled and Coastal Endurance Arrays data are making it possible to identify the impacts of changes associated with the ITs.
Read MoreMarine Heatwaves
The Coastal Endurance, the Regional Cabled, and the Global Station Papa Arrays were key in identifying and monitoring the approach of a marine heatwave known as the “Blob” and its links to multiple ecosystem impacts on the US west coast.
Read MoreMission Accomplished Despite Weather
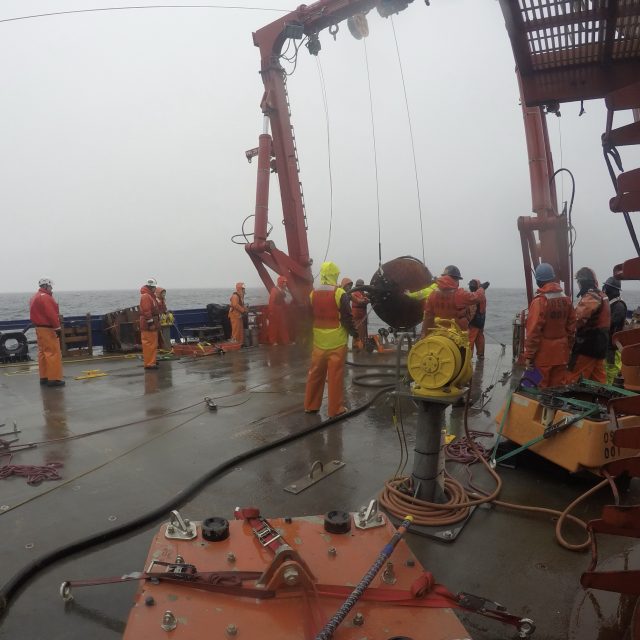
Thirteen days at sea. Two weather days. Wave heights that ranged from 2 – 12 ft, with most days somewhere around 7 foot waves. Winds from a pleasant 5 knots to days with up to 35 knots, with higher intermittent gusts. Except for two days when the sun shone, the weather was damp, cloudy, rainy, with an occasional wintery mix. Despite the conditions, the Endurance Team 18 accomplished its main mission objectives.
Much of the experience for those aboard the R/V Sikuliaq for the 18th turn of the Coastal Endurance Array focused on the weather, which presented operational challenges and less-than-ideal working conditions on some days with wintery conditions. Yet it was unseasonably mild for March. The team did a great job of taking advantage of good weather windows and, when needed, donned foul weather gear and kept at it for the duration of the expedition.
[media-caption path="https://oceanobservatories.org/wp-content/uploads/2023/03/recoveryinRain-1.jpeg" link="#"]Not required: sunscreen. Required: a good set of foulies, dry socks, and breaks for hot chow and beverages. The Endurance 18 expedition experienced less-than-ideal weather during this late winter recovery and deployment mission. Credit: Jonathan Fram, OSU.[/media-caption]“I can’t say enough about the professionalism of our team, and the crew of the R/V Sikuliaq,” said Jonathan Fram, Chief Scientist for Endurance 18, and project manager for the Coastal Endurance Array. “We literally weathered storms together to ensure a timely recovery and deployment of the Coastal Endurance Array. Everyone worked safely, without complaint to get the job done. “
Every six months, the Endurance Array Team heads to sea off the coast of Washington and Oregon to recover ocean observing equipment that has been in the water reporting data. This time, the expedition happened earlier in the year, in late winter rather than in early spring. This timing could have been compounded this year by the atmospheric rivers on the west coast of the US, but luckily the associated storms stayed south of the Endurance Array.
Nonetheless, the Endurance 18 succeeded. They recovered and deployed seven moorings, recovered two gliders, and deployed four gliders on the array. The team also deployed a coastal surface piercing profiler. Working with a remotely operated vehicle, the team was able to locate and recover an anchor that was stuck on the bottom.
[media-caption path="https://oceanobservatories.org/wp-content/uploads/2023/03/Anchor-clip-2.jpg" link="#"]A remotely operated vehicle was used to recover one of the mooring’s anchors that was stuck on the bottom. The ROV remote arm was used to clip on to the anchor and an onboard winch pulled it onboard. Credit: Alex Wick, OSU.[/media-caption]The expedition had a few non-weather-related novel components, as well. During leg two, University of South Carolina researcher Eric Tappa led the recovery and deployment of a sediment trap adjacent to OOI’s Oregon Slope Base site. This was the fourth time the sediment traps were deployed as part of Oregon State University Professor Jennifer Fehrenbacher’s and University of South Carolina Professor Claudia Benitez-Nelson’s work reconstructing ocean circulation, temperature, and chemistry in the past from sediment collected.
Each leg of the trip also had a new University-National Oceanographic Laboratory System (UNOLS) cruise volunteer and an OSU undergraduate, employed by OOI to help with the refurbishment of moorings, onboard. Such seagoing experience is invaluable to those deciding on future career paths. Listen to what UNOLS volunteer Olana Costa and OSU Undergraduate Athena Abramhamsen have to say about their experiences.
Last but not least, during leg two, OSU science videographer Kimberly Kenny recorded onboard work and shared her experiences in multiple videos and images that can be seen here and here.
“Regardless of conditions, there is nothing like being at sea with an energetic, committed group of colleagues,” said Fram. “Time at sea provides a unique opportunity to re-enforce the importance of our work to provide data to help better understand some of the changes taking place in the ocean.”
Read More
Making the Ocean Accessible Through Sound
“Scientists are finding that people can sometimes pick up more information from their ears than the eyes can see. And ears can perceive patterns in the data that the eyes can’t see,” said Amy Bower, a Senior Scientist at Woods Hole Oceanographic Institution and Principal Investigator for the Accessible Oceans project. “Adding sound to science allows more people to experience science, follow their curiosity, and make science more accessible to all. “
Bower joined forces with a multidisciplinary team to explore ways sound could be used to visualize data. Funded by the National Science Foundation’s Advancing Informal STEM Learning Program, Bower and her team have been working for nearly two years on Accessible Oceans: Exploring Ocean Data through Sound. Their goal is to inclusively design and pilot auditory displays of real ocean data. They are implementing a process called sonification, assigning sound to data points. Each member brings expertise to the task at hand. Principal Investigator Bower is an oceanographer. Dr. Jon Bellona is a sound designer with specialization in data sonification at the University of Oregon. Dr. Jessica Roberts and graduate student Huaigu Li, both at Georgia Tech, are Learning Sciences and human-computer interaction experts. Dr. Leslie Smith, an oceanographer and specialist in ocean science education and communication at Your Ocean Consulting, Inc., rounds out the team. Bower is a blind scientist, who lends a crucial perspective in the research and overall execution of the project.
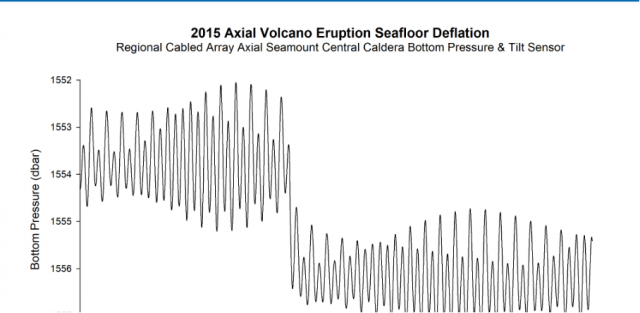
To begin, the team chose to use datasets collected by the Ocean Observatories Initiative (OOI) that had previously been transformed into classroom-ready use by Smith and the Ocean Data Labs. The team is working first on three of these curated datasets: the 2015 eruption of Axial Seamount, the vertical migration of zooplankton during an eclipse event, and carbon dioxide exchange between the ocean and the atmosphere.
“Data is made of numbers. Sonification is basically just translating numbers into sound,” Bower explained. “So instead of seeing numbers go up and down on a graph, for example, you can hear them go up and down.”
To ensure an inclusive final product, the team has undertaken a co-design process in which a variety of stakeholders have been engaged for input throughout the process. The team interviewed both subject matter experts and teachers of the blind and visually impaired to ensure that both scientific and pedagogical needs were being met. They then explored the integration of various auditory display techniques and ended up with a mix of data sonification, narration, and environmental sounds. The team put together a sample of five to six sonification examples for each data set, then surveyed a group of blind, visually impaired and sighted adults and students with science and non-science backgrounds. The survey’s purpose was to ask which sounds and which approaches might work best for both sighted and visually impaired listeners.
“We asked, for example, which of these sounds do you think best represents gases coming in and out of the ocean. The feedback was overwhelmingly in favor of a breathing sound,” said Bower. “As listeners will hear in the first example below that deals with carbon dioxide exchange between the ocean and the atmosphere, the breathing sound, with narration explaining what to expect, really brings the data to life.”
Accessible Oceans is a pilot and feasibility study for a museum exhibit that would introduce the broader public to what it’s like to experience ocean data through sound. At the end of this two-year project, the team intends to submit another proposal to design and build an exhibit that make ocean data come alive in a new and accessible way.
“As we’ve been working on this project, we’ve come to realize that to engage more people in science, technology, engineering and math, we can appeal to their ears as well as their eyes,” added Bower. “And I’m determined to help make science as accessible as possible for everyone.”
________________________________________________________________________
To hear more about Amy Bower’s work as an oceanographer and her exploration of sonification, tune into this episode of The Science of Ocean Sounds, Tumble Science Podcast for Kids.
Read More