
Posts Tagged ‘Coastal Endurance Array’
Oregon Sea Grant Spotlights Partner OOI
In its August 2021 newsletter, Oregon Sea Grant highlights the work of OOI’s Endurance Array Team at Oregon State University. Sea Grant Scholar Charlotte Klein interviewed the Endurance Array Principal Investigator Ed Dever, who describes some of challenges in keeping arrays operational in a challenging offshore environment.
The article can be found here, on page four.
Read MoreJupyter Notebook Produces Quality Flags for pH Data
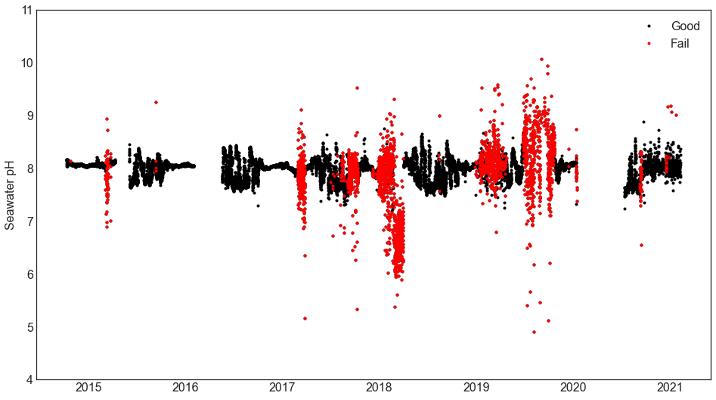
OOI uses the SAMI2-pH sensor from Sunburst Sensors, LLC to measure seawater pH throughout the different arrays. Assessing the data quality from this instrument is an involved process as there are multiple parameters produced by the instrument that are then used to calculate the seawater pH. These measurements are subject to different sources of error, and those errors can propagate through the calculations to create an erroneous seawater pH value. Based upon the vendor documentation and MATLAB code Sunburst provides to convert the raw measurements, OOI data team members have created a set of rules from those different measurements to flag the pH data as either pass, suspect or fail.
The resulting flags can be used to remove failed data from further analysis. They can also be used to help generate annotations for further Human in the Loop (HITL) QC checks of the data to help refine quality metrics for the data. OOI team member, Chris Wingard (OSU), has written up the QC process as a Python Jupyter notebook. This notebook and other example notebooks are freely available to the scientific community via the OOI GitHub site (within the OOI Data Team Python toolbox accessed from https://oceanobservatories.org/community-tools/ ).
In this notebook, Wingard shows how the quality rules can be used to remove bad pH data from a time series, and how they can be used to then create annotations. The impact of using these flags is shown with a set of before and after plots of the seawater pH as a function of temperature. The quality controlled data can then be used to estimate the seasonal cycle of pH to set climatological quality control flags.
Here an example is shown using data from a pH sensor on the Oregon Inshore Surface Mooring (CE01ISSM) near surface instrument frame (NSIF), deployed at 7 m depth (site depth is 25 m).
[media-caption path="https://oceanobservatories.org/wp-content/uploads/2021/07/EA-Highlight.png" link="#"]Figure 25: pH data from the Oregon Inshore Surface Mooring (CE01ISSM) near surface instrument frame (NSIF). Good data are shown in black, failed data in red. Note that simple range tests on the final calculated pH are often not enough to distinguish good from failed data. The automated QC processing examines intermediate measurements and fails data if intermediate measurements are outside acceptable ranges and propagated to final measurements.[/media-caption] [media-caption path="https://oceanobservatories.org/wp-content/uploads/2021/07/EA-highlight-2.png" link="#"]Figure 26: Good data together with annual cycles (red) constructed with available good data from initial deployment through 2021. Data which falls outside three standard deviations of the climatology is flagged as suspect. The climatological tests are used to flag suspect data. Simple range tests for suspect (cyan) and failed (magenta) data are also shown. The annual cycle at this site is strongly influenced by annual summer upwelling and winter storms and river plumes. The summer decrease in pH is consistent with cold, relatively acidic upwelled water high in CO2 (see e.g., Evans et al., 2011)[/media-caption]
Evans, W., B. Hales, and P. G. Strutton (2011), Seasonal cycle of surface ocean pCO2on the Oregon shelf,J. Geophys. Res., 116, C05012, doi:10.1029/2010JC006625.
Read MoreOOI Community Members Guide Pioneer Relocation
From 21-25 June, 37 members of the Ocean Observatories Initiative (OOI) community are participating in the National Science Foundation-sponsored Phase 2 Innovations Lab to identify the best location within the recently designated geographic region of the Mid-Atlantic Bight (MAB) between Cape Hatteras and Norfolk Canyon for the Pioneer Array relocation.
During the week, participants will work to identify the observatory opportunities that can be offered by the new Pioneer Array location. They will explore how the Pioneer Array sensors and platforms can be optimized to achieve science and education goals at a new site, based on environmental, logistical, and infrastructural considerations. The group will also evaluate challenges presented by deployment of Array infrastructure at a new location, and discuss the potential for partnerships and collaborations at a new site.
The MAB region offers opportunities to collect data on a wide variety of cross-disciplinary science topics including cross-shelf exchange, land-sea interactions associated with large estuarine systems, a highly productive ecosystem with major fisheries, and carbon cycle processes. This geographic region also offers opportunities to improve understanding of hurricane development, tracking and prediction, and offshore wind partnerships. The relocation of the Pioneer Array will take place in 2024.
The Ocean Observatories Initiative Facilities Board (OOIFB), in partnership with KnowInnovations, is facilitating the Phase 2 Innovations Lab. “We selected a diverse mix of Lab participants to achieve a broad range of disciplines and professional expertise, career stage (from early to senior), gender, cultural background, and life experience. By involving such a wide range of people in the conversations this week, it is our hope that the innovative quality, outputs, and outcomes of the Lab will be enriched,” said Kendra Daly, chair of the OOIFB. “And, throughout the year, we will continue to work with the community on the exciting optimization process via scientific meetings, seminars, and other means to ensure we receive broad input.”
Read MoreTackling Sea Surface Sampling Issues
The sea surface is the hardest place to work, according to Jonathan Fram, Project Manager of the Coastal Endurance Array. That’s because at the surface, waves are constantly sloshing around. At any time, a large wave can tug on mooring winch lines, creating sudden tension, which can wear down cables and even cause them to break.
Scuba divers know that surface waters are rough, but below a certain depth—about one wave orbital below the surface—the waters calm significantly. Unfortunately, a lot of great science takes place at the surface, so it’s important for sampling instruments like the Coastal Surface Piercing Profiler (CSPP) to be able to withstand the waves at and near the surface. Fortunately, OOI engineers have found ways to meet the many challenges of working in this rough environment.
“The Coastal Endurance Array Team has made changes to the CSPP to make it more robust, so that we can get the kind of continuous time series that are so valuable to scientists,” said Fram.
A CSPP spends most of its time near the sea floor, but either two or four times a day, the profiler winches itself up to the surface, taking samples as it ascends. Once it reaches the surface, the profiler sends its data back to shore and then quickly returns to the safety of the seafloor. Profilers are important ocean observatory tools because they can help capture what is happening at certain depths where stationary instruments aren’t present. “We’ve had times where you get a persistent chlorophyll bloom at a certain depth where there is zero mooring data,” explained Fram. “So the CSPP sampling is needed to make sense of what’s happening. It’s impossible to have all the instruments at all depths. The CSPP fills in this gap.”
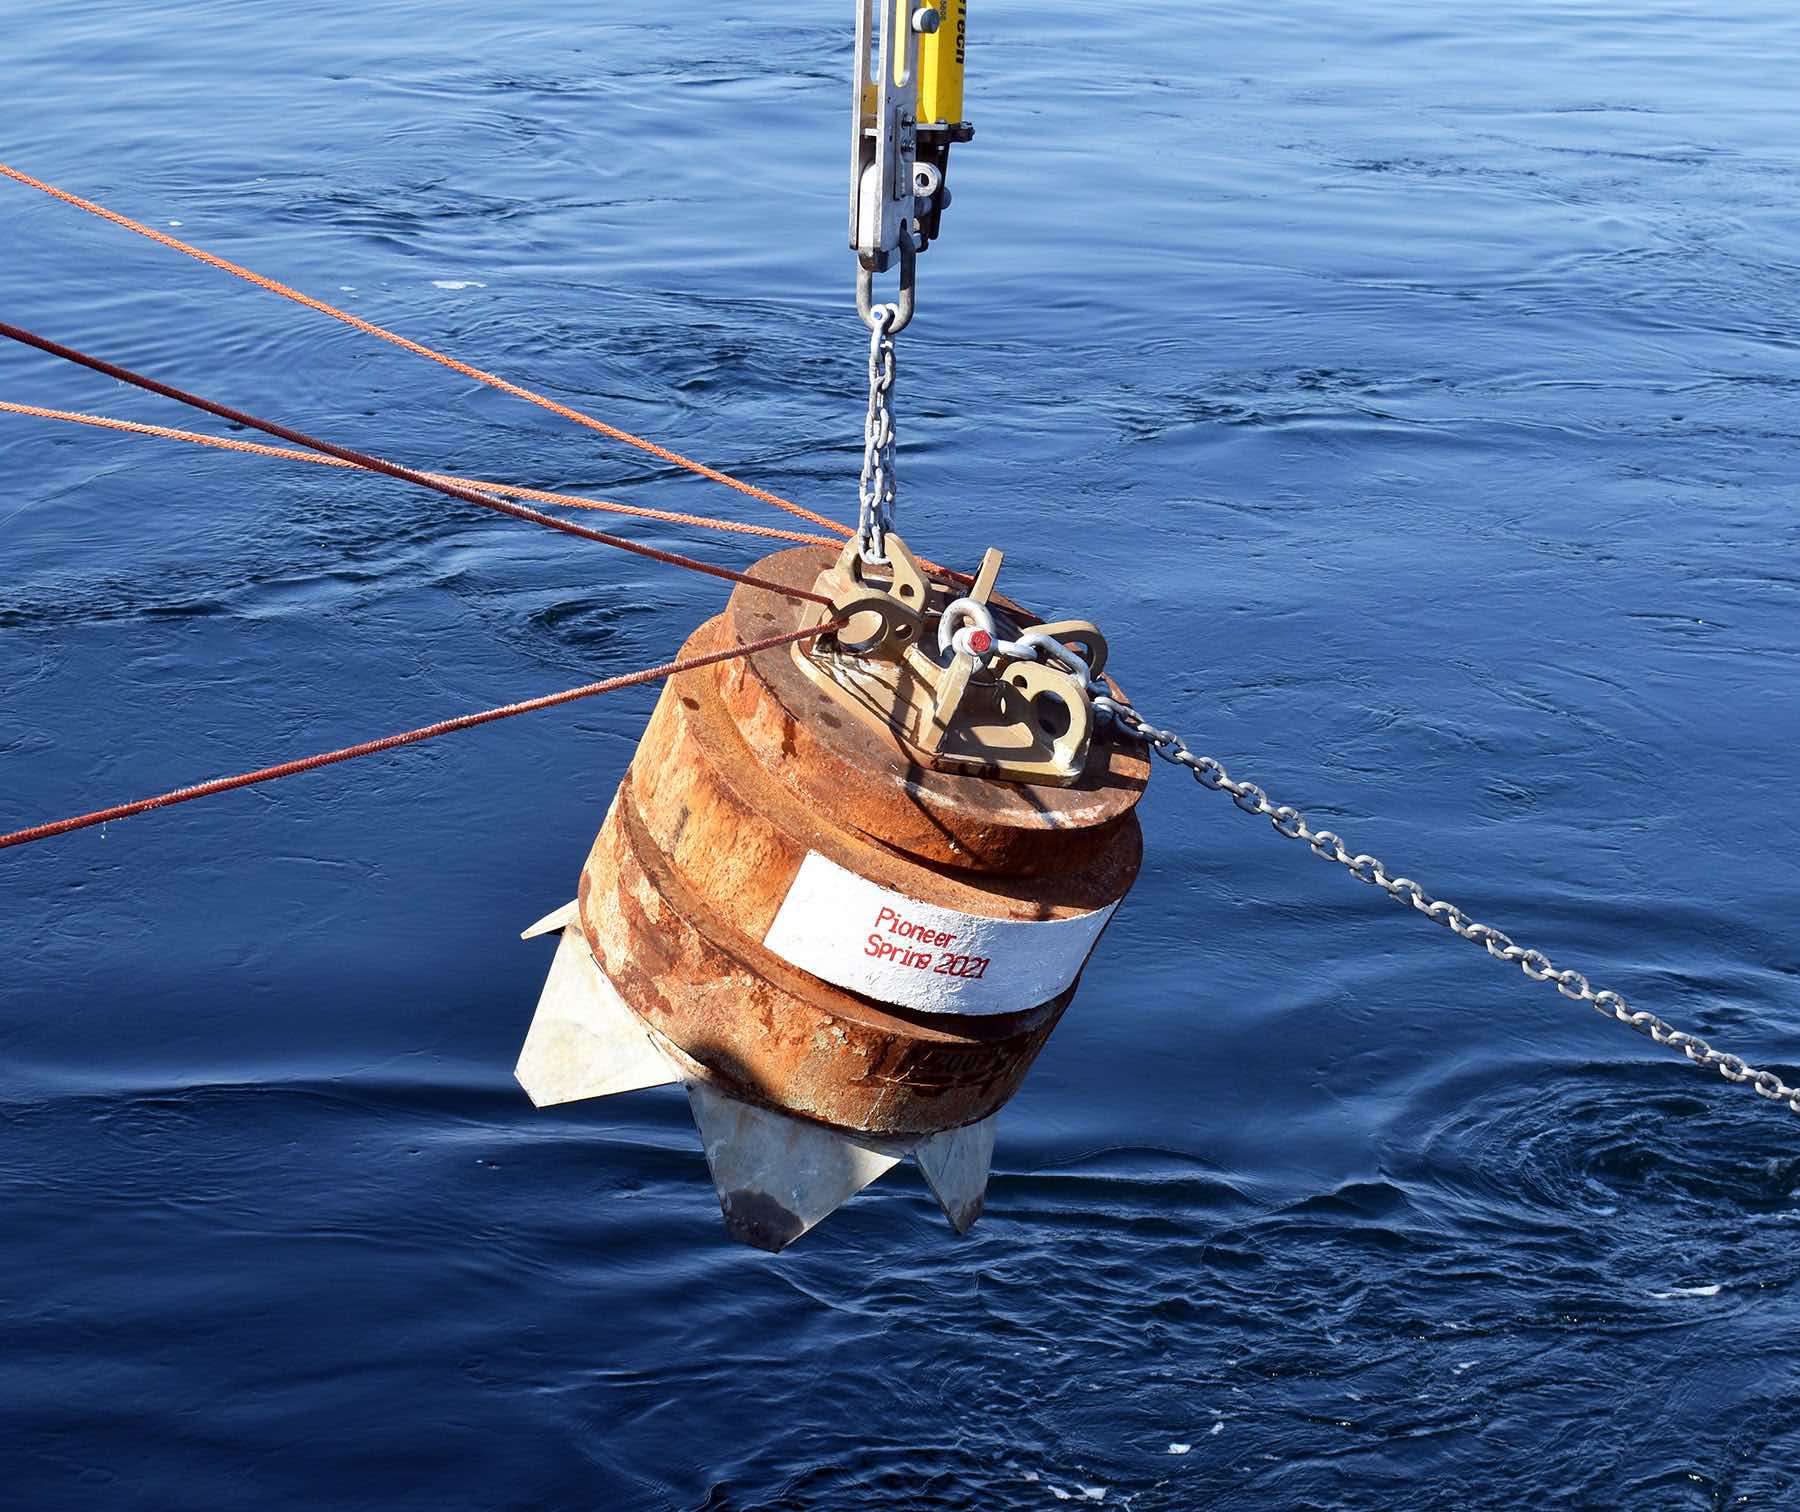
Last year, the Coastal Endurance Array team reviewed their activities looking for ways to reduce lost time at sea. One thing they discovered was that the anchor systems of the CSPPs were unreliable. To deal with this problem, the team created a new kind of anchor. The old profiler anchors had a chain between the profiler and anchor that helped dampen the waves so that the device was not tugged on when resting in between profiles. The chain, however, made it difficult to deploy the anchor in an upright position. Anchors need to be deployed upright so their recovery floats can be acoustically released. The team redesigned the anchors so they now behave like a weeble wobble toy that is weighted so it always rights itself. This new design makes it hard to deploy an anchor upside down, making the anchors more reliable.
The team also made updates to the modems that send data to shore. When the CSPP is at the surface, the winch must stay on because it keeps the antenna vertical. This time-on takes up about a quarter of the battery power. To reduce the power demand, the team switched out some of the iridium modems for cellular modems, which has allowed the CSPPs to send data more quickly. A faster modem means that the profiler spends less time at the surface, not only saving power, but reducing the risk of being damaged by a large wave. The team is currently working on upgrading to faster cellular modems that can connect further from shore.
“At the same time we are making these updates on the Oregon Shelf Mooring, we’re also implementing them on the Washington Shelf Mooring,” said Fram. “So an improvement on one platform is also leading to an improvement on another platform.”
A third innovation involves improvements to the batteries.
“When waves tug on the winch, it goes from being a power sink to a power source. That sometimes creates power spikes that can fry the connectors. So we’ve rewired the batteries to make them more robust,” explained Fram. The rewiring is expected to reduce the number of power failures and keep the CSPPs running continuously. “Since April when we first started using the rewiring scheme, we’ve had four profilers in the water with no problems for six weeks,” said Fram.
The team also is in the process of replacing batteries that power the profiler with their own design of rechargeable batteries. While OOI engineers prefer to use commercially available parts for easier repair and replacement, when parts on the market don’t fit their needs, they design their own. The new batteries will be more reliable than those they are replacing. The newly designed batteries will also be deployed on the wire-following profilers on the Coastal Pioneer Array.
“My focus is on making all of the Coastal Endurance instrumentation work,” said Fram. “When we’re able to get a full three months’ deployment through the winter, through super rough seas, that makes my day. Making improvements is what I look forward to the most.”
Read MoreEasing Sharing of Glider Data
The OOI’s Coastal and Global Array teams regularly use Teledyne-Webb Slocum Gliders to collect ocean observations within and around the array moorings. The gliders fly up and down the water column from the surface down to a maximum depth of 1000 meters, collecting data such as dissolved oxygen concentrations, temperature, salinity, and other physical parameters to measure ocean conditions.
OOI shares its glider data with the Integrated Ocean Observing System (IOOS) Glider Data Assembly Center (DAC). IOOS serves as a national repository for glider data sets, serving as a centralized location for wide distribution and use. It allows researchers to access and analyze glider data sets using common tools regardless of the glider type or organization that deployed the glider.
OOI serves data to these repositories in two ways. When the gliders are in the water, data are telemetered, providing near real-time data to these platforms. Once the gliders are recovered, data are downloaded, metadata provided, and data are resubmitted to the Glider DAC as a permanent record.
The behind-the-scene process transmitting this huge amount of data is quite complex. OOI Data Team members, Collin Dobson of the Coastal and Global Scale Nodes at Woods Hole Oceanographic Institution (WHOI) and Stuart Pearce of the Coastal Endurance Array at Oregon State University (OSU) teamed up to streamline the process and catch up on a backlog of submission of recovered data.
Pearce took the lead in getting the OOI data into the DAC. In 2018, he began writing code for a system to transmit near real-time and recovered data. Once the scripts (processing code) were operational by about mid-2019, Pearce implemented them to streamline the flow of Endurance Array glider data into the DAC. Dobson then adopted the code and applied it to the transmission of glider data from the Pioneer, Station Papa, and Irminger Sea Arrays into the repository.
As it turned out, timing was optimum. “ I finished my code at the same time that the Glider DAC allowed higher resolution recovered datasets to be uploaded,” said Pearce. “So I was able to adjust my code to accommodate the upload of any scientific variable as long as it had a CF compliant standard name to go with it.” This opened up a whole range of data that could be transmitted in a consistent fashion to the DAC. CF refers to the “Climate and Forecast” metadata conventions that provide community accepted guidance for metadata variables and sets standards for designating time ranges and locations of data collection. Dobson gave an example of the name convention for density: Sea_water_density.
“Being CF compliant ensures your data have the required metadata and makes the data so much more usable across the board,” added Dobson. “If I wanted to include oxygen as a variable, for example, I have to make sure to use the CF standard name for dissolved oxygen and report the results in CF standard units.”
The Endurance Array team was the first group to add any of the non-CTD variables into the Glider DAC. This important step forward was recognized by the glider community, and was announced at a May 2019 workshop at Rutgers with 150 conveyors of glider data in attendance. One of Pearce’s gliders was used as the example of how and what could be achieved with the new code.
To help expedite the transfer of all gliders into the DAC, Pearce made his code open access. The additional metadata will help advance the work of storm forecasters, researchers, and others interested in improving understanding ocean processes.
Read More
Expanding Reach of OOI Data
 Pioneer Array data is now available on NERACOOS’ new Mariner’s Dashboard. This is but one example of how OOI data are integrated into other data repositories to maximize their benefit and use.[/caption]
OOI shares data with partner repositories and institutions that host similar data but have different user bases. These partnerships expand the data available for forecasting models, help provide insight into current ocean conditions, and serve as important resources for many ranging from fishers and other maritime users to land-based researchers and students.
With the exception of the Station Papa Array, the OOI Coastal and Global Arrays maintain surface buoys. Instruments deployed on these buoys measure meteorological variables such as air temperature, barometric pressure, northward and eastward wind velocities, precipitation, solar radiation, and surface water properties of sea surface temperature and salinity. Other instruments on the moorings collect wave data, such as significant wave height, period, and direction. These data are then consumed by national and regional networks to improve accuracy of weather forecasting models.
The Regional Cabled Array (RCA) consists of fiber-optic cables off the Oregon coast that provide power, bandwidth, and communication to seafloor instrumentation and moorings with instrumented profiling capabilities. A diverse array of geophysical, chemical, and biological sensors, a high-definition camera, and digital still cameras on the seafloor and mooring platforms, provide real-time information on processes operating on and below the seafloor and throughout the water column, including recording of seafloor eruptions, methane plume emissions and climate change. These data are available for community use. Since 2015, the RCA has fed data into Incorporated Research Institutions for Seismology (IRIS), the primary source for data related to earthquakes and other seismic activity. In addition, data including zooplankton sonar data, are being utilized within the Pangeo ecosystem for community visualization and access and pressure data are incorporated into NOAA’s operational tsunami forecasting system.
Helping Improve Models and Forecasting
One of the recipients of OOI data is the National Data Buoy Center (NDBC), part of the National Oceanic and Atmospheric Administration’s (NOAA) National Weather Service. NDBC maintains a data repository and website, offering a range of standardized real-time and near real-time meteorological data. Data such as wind speed and direction, air and surface water temperature, and wave height and direction are made available to the broader oceanographic and meteorological community.
“Many researchers go to NDBC for their data, “said Craig Risien, a research associate with OOI’s Endurance Array and Cyberinfrastructure Teams, who helps researchers gain access to and use OOI data. “NBDC is a huge repository of data and it’s easy to access. So there’s a low barrier for researchers and students who are looking for information about wind speed, water temperature and a slew of other data. OOI contributing to this national repository significantly increases its data reach, allowing OOI data to be used by as many people as possible. “
OOI sea surface temperature data also make their way into the operational Global Real-Time Ocean Forecast System (RTOFS) at the National Centers for Environmental Prediction (NCEP), another part of NOAA’s National Weather Service. RTOFS ingests sea surface temperature and salinity data from all available buoys into the Global Telecommunications System (GTS). OOI glider data also are pushed in near real-time to the US Integrated Ocean Observing System Glider Data Assembly Center (DAC). From there, the data goes to the GTS where it can be used by the operational modeling centers such as NCEP and the European Centre for Medium-Range Weather Forecasts.
The GTS is like a giant vacuum sucking up near real-time observations from all sorts of different platforms deployed all over the world. On a typical day, the GTS ingests more than 7,600 data points from fixed buoys alone. As a result of this vast input, researchers can go to the GTS, pull available data, and assimilate that information into any model to improve its prediction accuracy.
Advancing Forecasting of Submarine Eruptions
As the first U.S. ocean observatory to span a tectonic plate, RCA’s data are an invaluable contributor to IRIS’s collection. Since 2015, the user community has downloaded >20 Terabytes of RCA seismometer data from the IRIS repository. Fourteen different sampling locations include key sites at Axial Seamount on the Juan de Fuca mid-ocean ridge spreading center, near the toe of the Cascadia Margin and Southern Hydrate Ridge. RCA data are catalogued and available on the IRIS site, using the identifier “OO.”
[caption id="attachment_21046" align="alignleft" width="300"]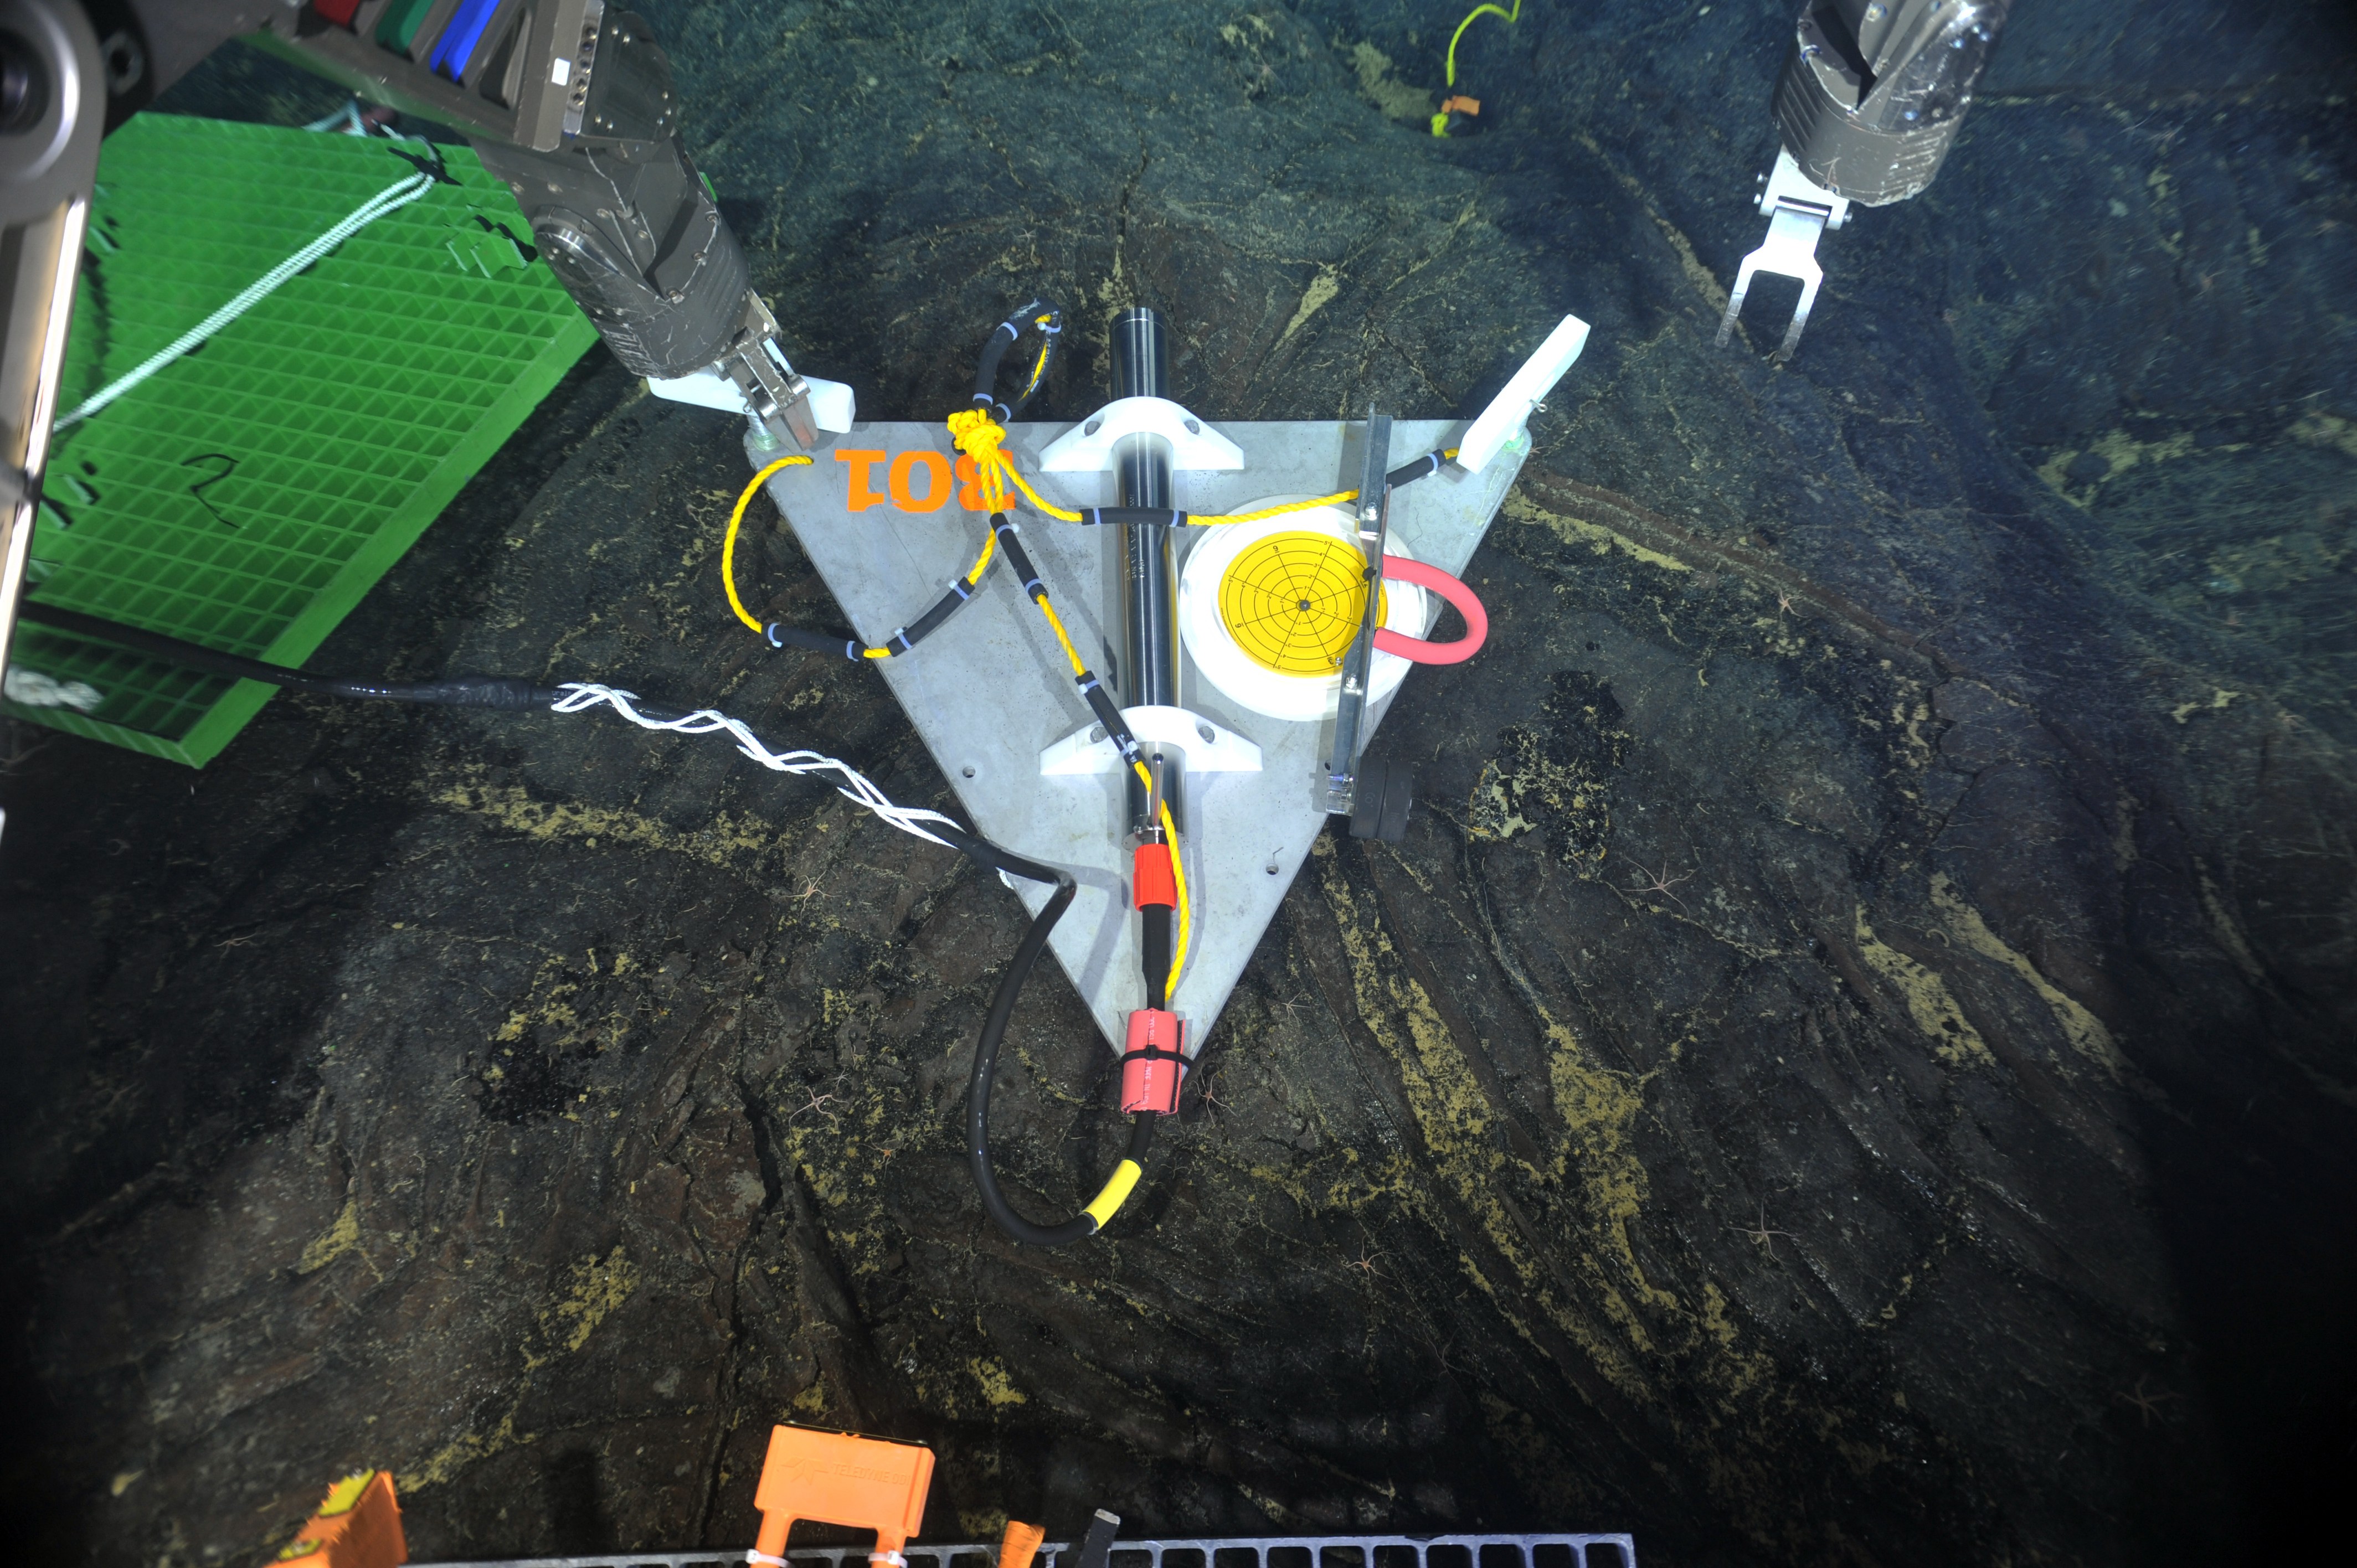 Data from short period seismometers installed at RCA’s Axial Seamount and Southern Hydrate Ridge sites are streamed live to IRIS. Credit: UW/NSF-OOI/Canadian Scientific Submersible Facility, V13.[/caption]
“RCA is a critical community resource for seismic data. Axial Seamount, for example, which erupted in 1998, April 2011, was the site of more than 8,000 earthquakes over a 24-hour period April 24, 2015 marking the start of large eruption,” explained Deb Kelley, PI of the RCA. “Being able to witness and measure seismic activity in real time is providing scientists with invaluable insights into eruption process, which along with co-registered pressure measurements is making forecasting possible of when the next eruption may occur. We are pleased to share data from this volcanically and hydrothermally active seamount so researchers the world over can use it to better understand processes happening at mid ocean ridges and advance forecasting capabilities for the first time of when a submarine eruption may occur.”
Providing Data with Regional Implications
[caption id="attachment_21047" align="alignright" width="203"]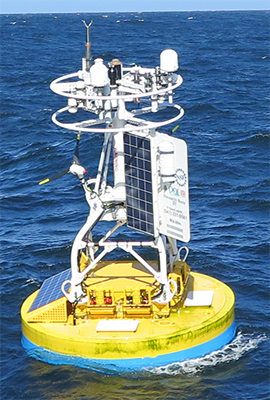 Data from Endurance Array buoy 46100 are fed into WCOFS, where they are accessible to maritime users. Credit: OSU[/caption]
OOI also provides data to regional ocean observing partners. Data from two Endurance Array buoys (46099 and 46100), for example, are fed into a four-dimensional U.S. West Coast Operational Forecast System (WCOFS), which serves the maritime user community. WCOFS generates water level, current, temperature and salinity nowcast and forecast fields four times per day. The Coastal Pioneer Array is within the future Northeastern Coast Operational Forecast System (NECOFS). Once operational, Pioneer’s observations will potentially be used for WCOFS data assimilation scenario experiments.
Coastal Endurance Array data are shared with the Northwest Association of Networked Ocean Observing Systems (NANOOS), which is part of IOOS, and the Global Ocean Acidification Observing Network (GOA-ON). Endurance data are ingested by the NANOOS Visualization System, which provides easy access to observations, forecasts, and data visualizations. Likewise, for GOA-ON, the Endurance Array provides observations useful for measuring ocean acidification.
Data from three of the Pioneer Array buoys also are part of the Mariners’ Dashboard, a new ocean information interface at the Northeastern Regional Association of Coastal Ocean Observing Systems (NERACOOS). Visitors can use the Dashboard to explore the latest conditions and forecasts from the Pioneer Inshore (44075), Central (44076), and Offshore (44077) mooring platforms, in addition to 30+ other observing platforms throughout the Northeast.
“We are working hard to distribute the OOI data widely through engagement with multiple partners, which together are helping inform science, improve weather and climate forecasts, and increase understanding of the ocean,” added Al Plueddemann, PI of the Coastal and Global Scale Nodes, which include the Pioneer, Station Papa, and Irminger Sea Arrays.
Read More
Bottom Boundary Layer O2 Fluxes During Winter on the Oregon Shelf
Adapted and condensed by OOI from Reimers et al., 2022, doi:/10.1029/2020JC016828.
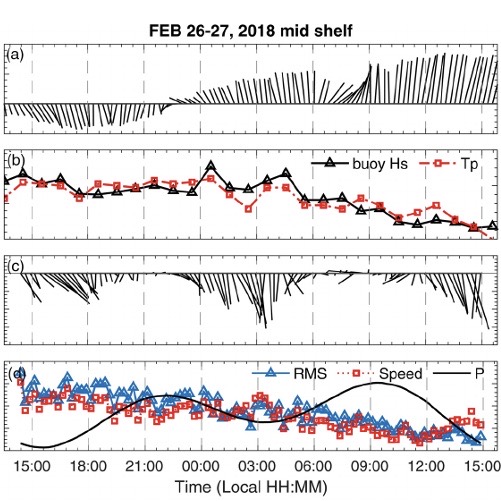
[caption id="attachment_21037" align="aligncenter" width="640"]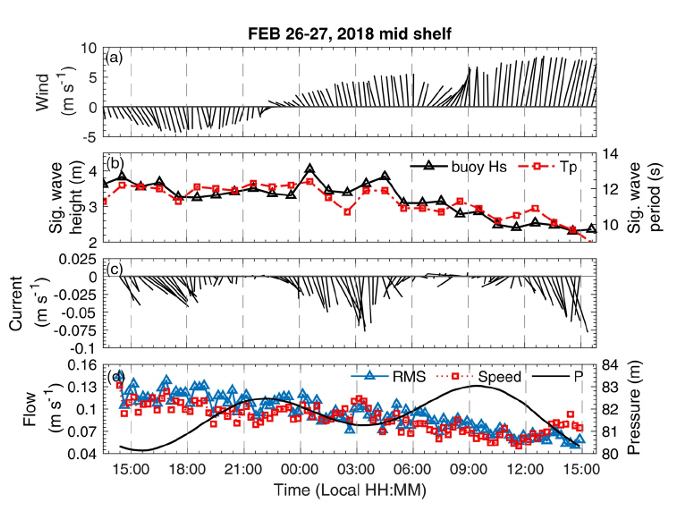 Fig. 1 Time series of physical conditions during the February 26–27, 2018 deployment (EC D1) at the mid-shelf site. (a) Wind vectors (15-min averages) measured at the OOI Shelf Surface Mooring (CE02SHSM), (b) wave properties (hourly averages) measured at the OOI Shelf Surface Mooring, (c and d) other near-bottom ADV parameters (15-min averages). Both the winds and ADV velocities are portrayed in earth coordinates (eastward is to the right along the horizontal axis and northward is positive along the vertical axis). ADV, Acoustic Doppler Velocimeter; EC D, eddy covariance deployment[/caption]
The oceanic bottom boundary layer (BBL) is the portion of the water column close to the seafloor where water motions and properties are influenced significantly by the seabed. This study (Reimers & Fogaren, 2021) reported in the Journal of Geophysical Research examines conditions in the BBL in winter on the Oregon shelf. Dynamic rates of sediment oxygen consumption (explicitly oxygen fluxes) are derived from high-frequency, near-seafloor measurements made at water depths of 30 and 80 meters. The strong back-and-forth motions of waves, which in winter form sand ripples, pump oxygen into surface sediments, and contribute to the generation of turbulence in the BBL, were found to have primed the seabed for higher oxygen uptake rates than observed previously in summer.
Since oxygen is used primarily in biological reactions that also consume organic matter, the winter rates of oxygen utilization indicate that sources of organic matter are retained in, or introduced to, the BBL throughout the year. These findings counter former descriptions of this ecosystem as one where organic matter is largely transported off the shelf during winter. This new understanding highlights the importance of adding variable rates of local seafloor oxygen consumption and organic carbon retention, with circulation and stratification conditions, into model predictions of the seasonal cycle of oxygen.
Supporting observations, which give environmental context for the benthic eddy covariance (EC) oxygen flux measurements, include data from instruments contained in OOI’s Endurance Array Benthic Experiment Package and Shelf Surface Moorings. Specifically, velocity profile time-series are drawn from records of a 300-kHz Velocity Profiler (Teledyne RDI-Workhorse Monitor), near-seabed water properties from CTD (SBE 16plusV2) and oxygen (Aanderaa-Optode 4831) sensors, winds from the surface buoy’s bulk meteorological package, and surface-wave data products from a directional wave sensor (AXYS Technologies) (see e.g., Fig 1 above).
Reimers, C. E., & Fogaren, K. E. (2021). Bottom boundary layer oxygen fluxes during winter on the Oregon shelf. Journal of Geophysical Research: Oceans, 126, e2020JC016828. https://doi.org/10.1029/2020JC016828
Read More
Mission Accomplished: Endurance 14 Cruise Meets All Objectives
After a 15-day expedition, the Endurance Array Team returned to port aboard the R/V Sikuliaq on 7 April having successfully completed the 14th turn of the Endurance Array. The team recovered and deployed seven surface moorings and completed sampling at all recovery/deployment sites. They also deployed and recovered gliders and surface profilers.
Because of the size and weight of the moorings and other equipment, the trip was conducted in two legs. The first leg was primarily off Washington and the second off Oregon. Between legs, the R/V Sikuliaq returned to Newport, Oregon to offload recovered equipment from the Washington Line and load new equipment for the Oregon Line.
The weather was rough when the R/V Sikuliaq first set off from Newport on 24 March. On the first night out, they saw 19-foot waves and 35-knot winds. The team worked around the weather on the first leg to deploy three moorings and recover four. They also recovered and deployed gliders.
The second leg of the journey brought with it much better weather, which eased the recoveries, deployments, sampling, and other activities. During this leg, the team worked mostly off Oregon. The team deployed four moorings and three profilers and recovered three moorings, three gliders, and a profiler.
Each OOI deployment brings some technical improvement. On this deployment, the Endurance moorings are outfitted with redesigned solar panels on the buoy decks. These panels will deliver more power and be more resilient to wear and tear caused by sea lions who often find the buoys an inviting place to lounge. The redesign was implemented by OOI’s Coastal and Global Scale Nodes team at Woods Hole Oceanographic Institution.
This trip also marked the Endurance Array’s team first use of a OOI’s ROV (remotely operated vehicle). The ROV was used at the Oregon shelf site to recover a coastal surface piercing profiler and its anchor. Throughout the process, the R/V Sikuliaq maneuvered skillfully to place the ship over the target. Mooring lead Alex Wick piloted the ROV through strong currents and limited visibility. It took four dives, but the profiler and its anchor were recovered. On the third dive, the ROV was used to cut the winch line so the team could recover the profiler, and the anchor was recovered on the fourth and final dive.
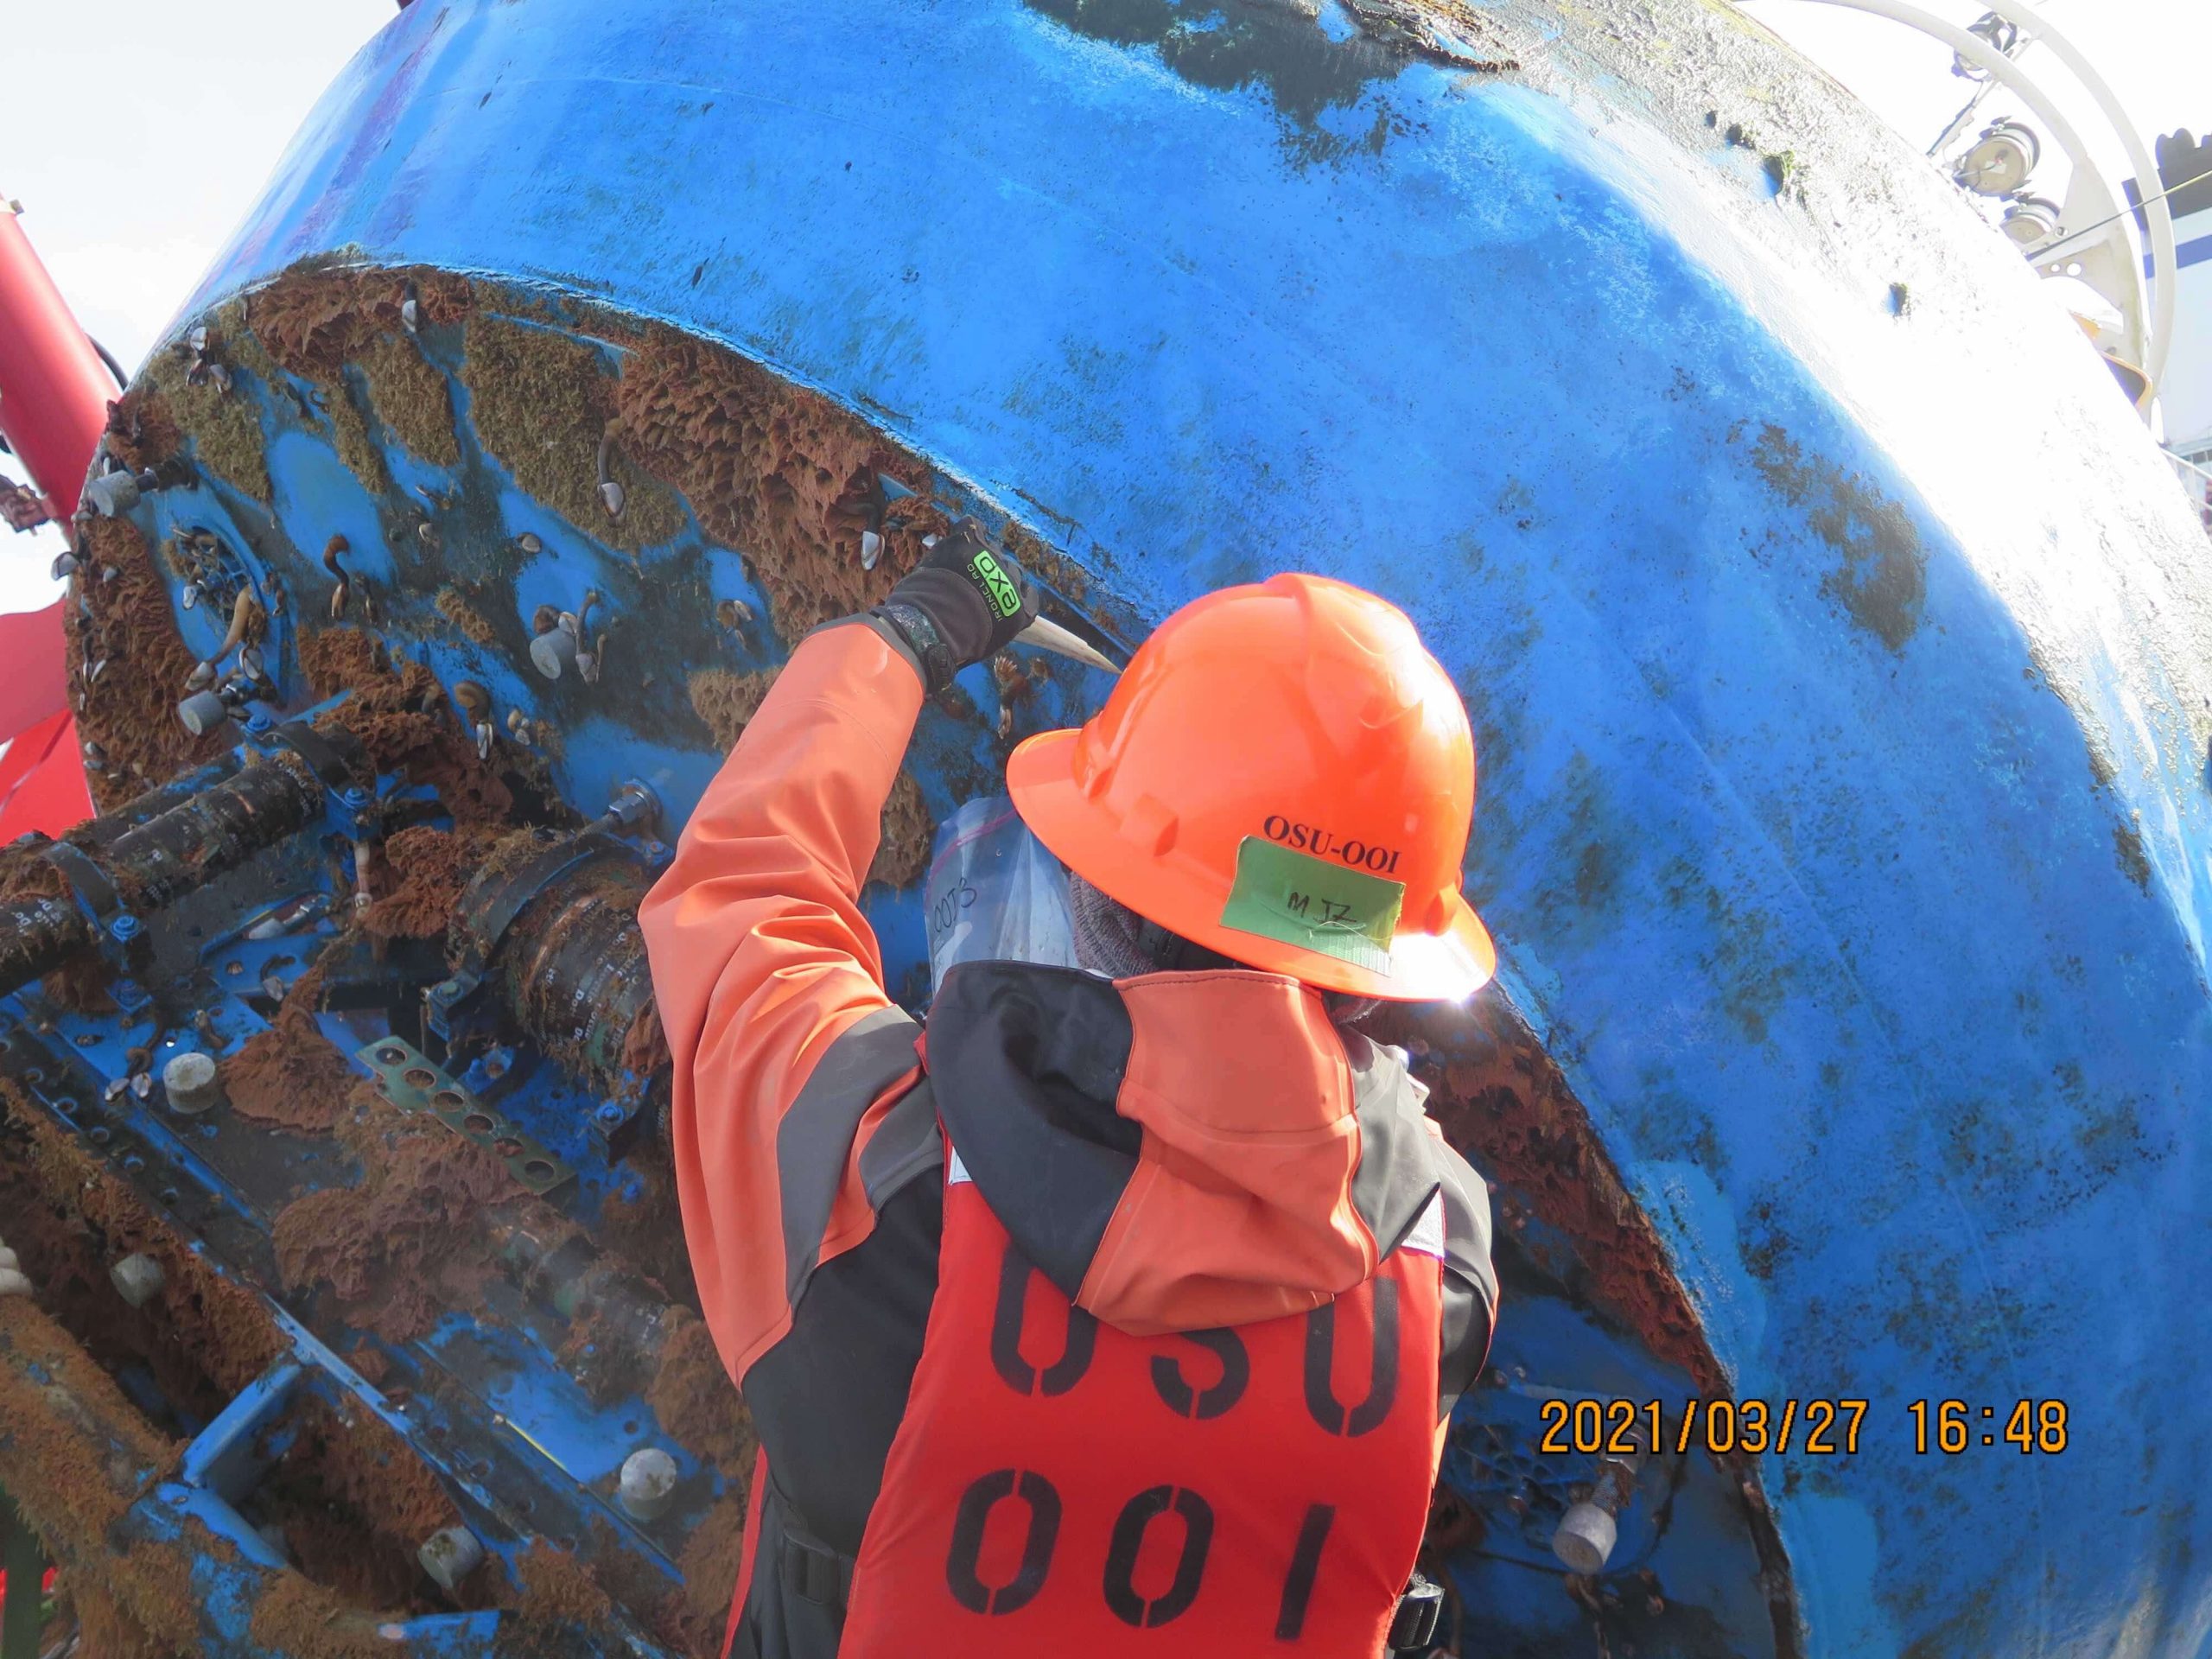
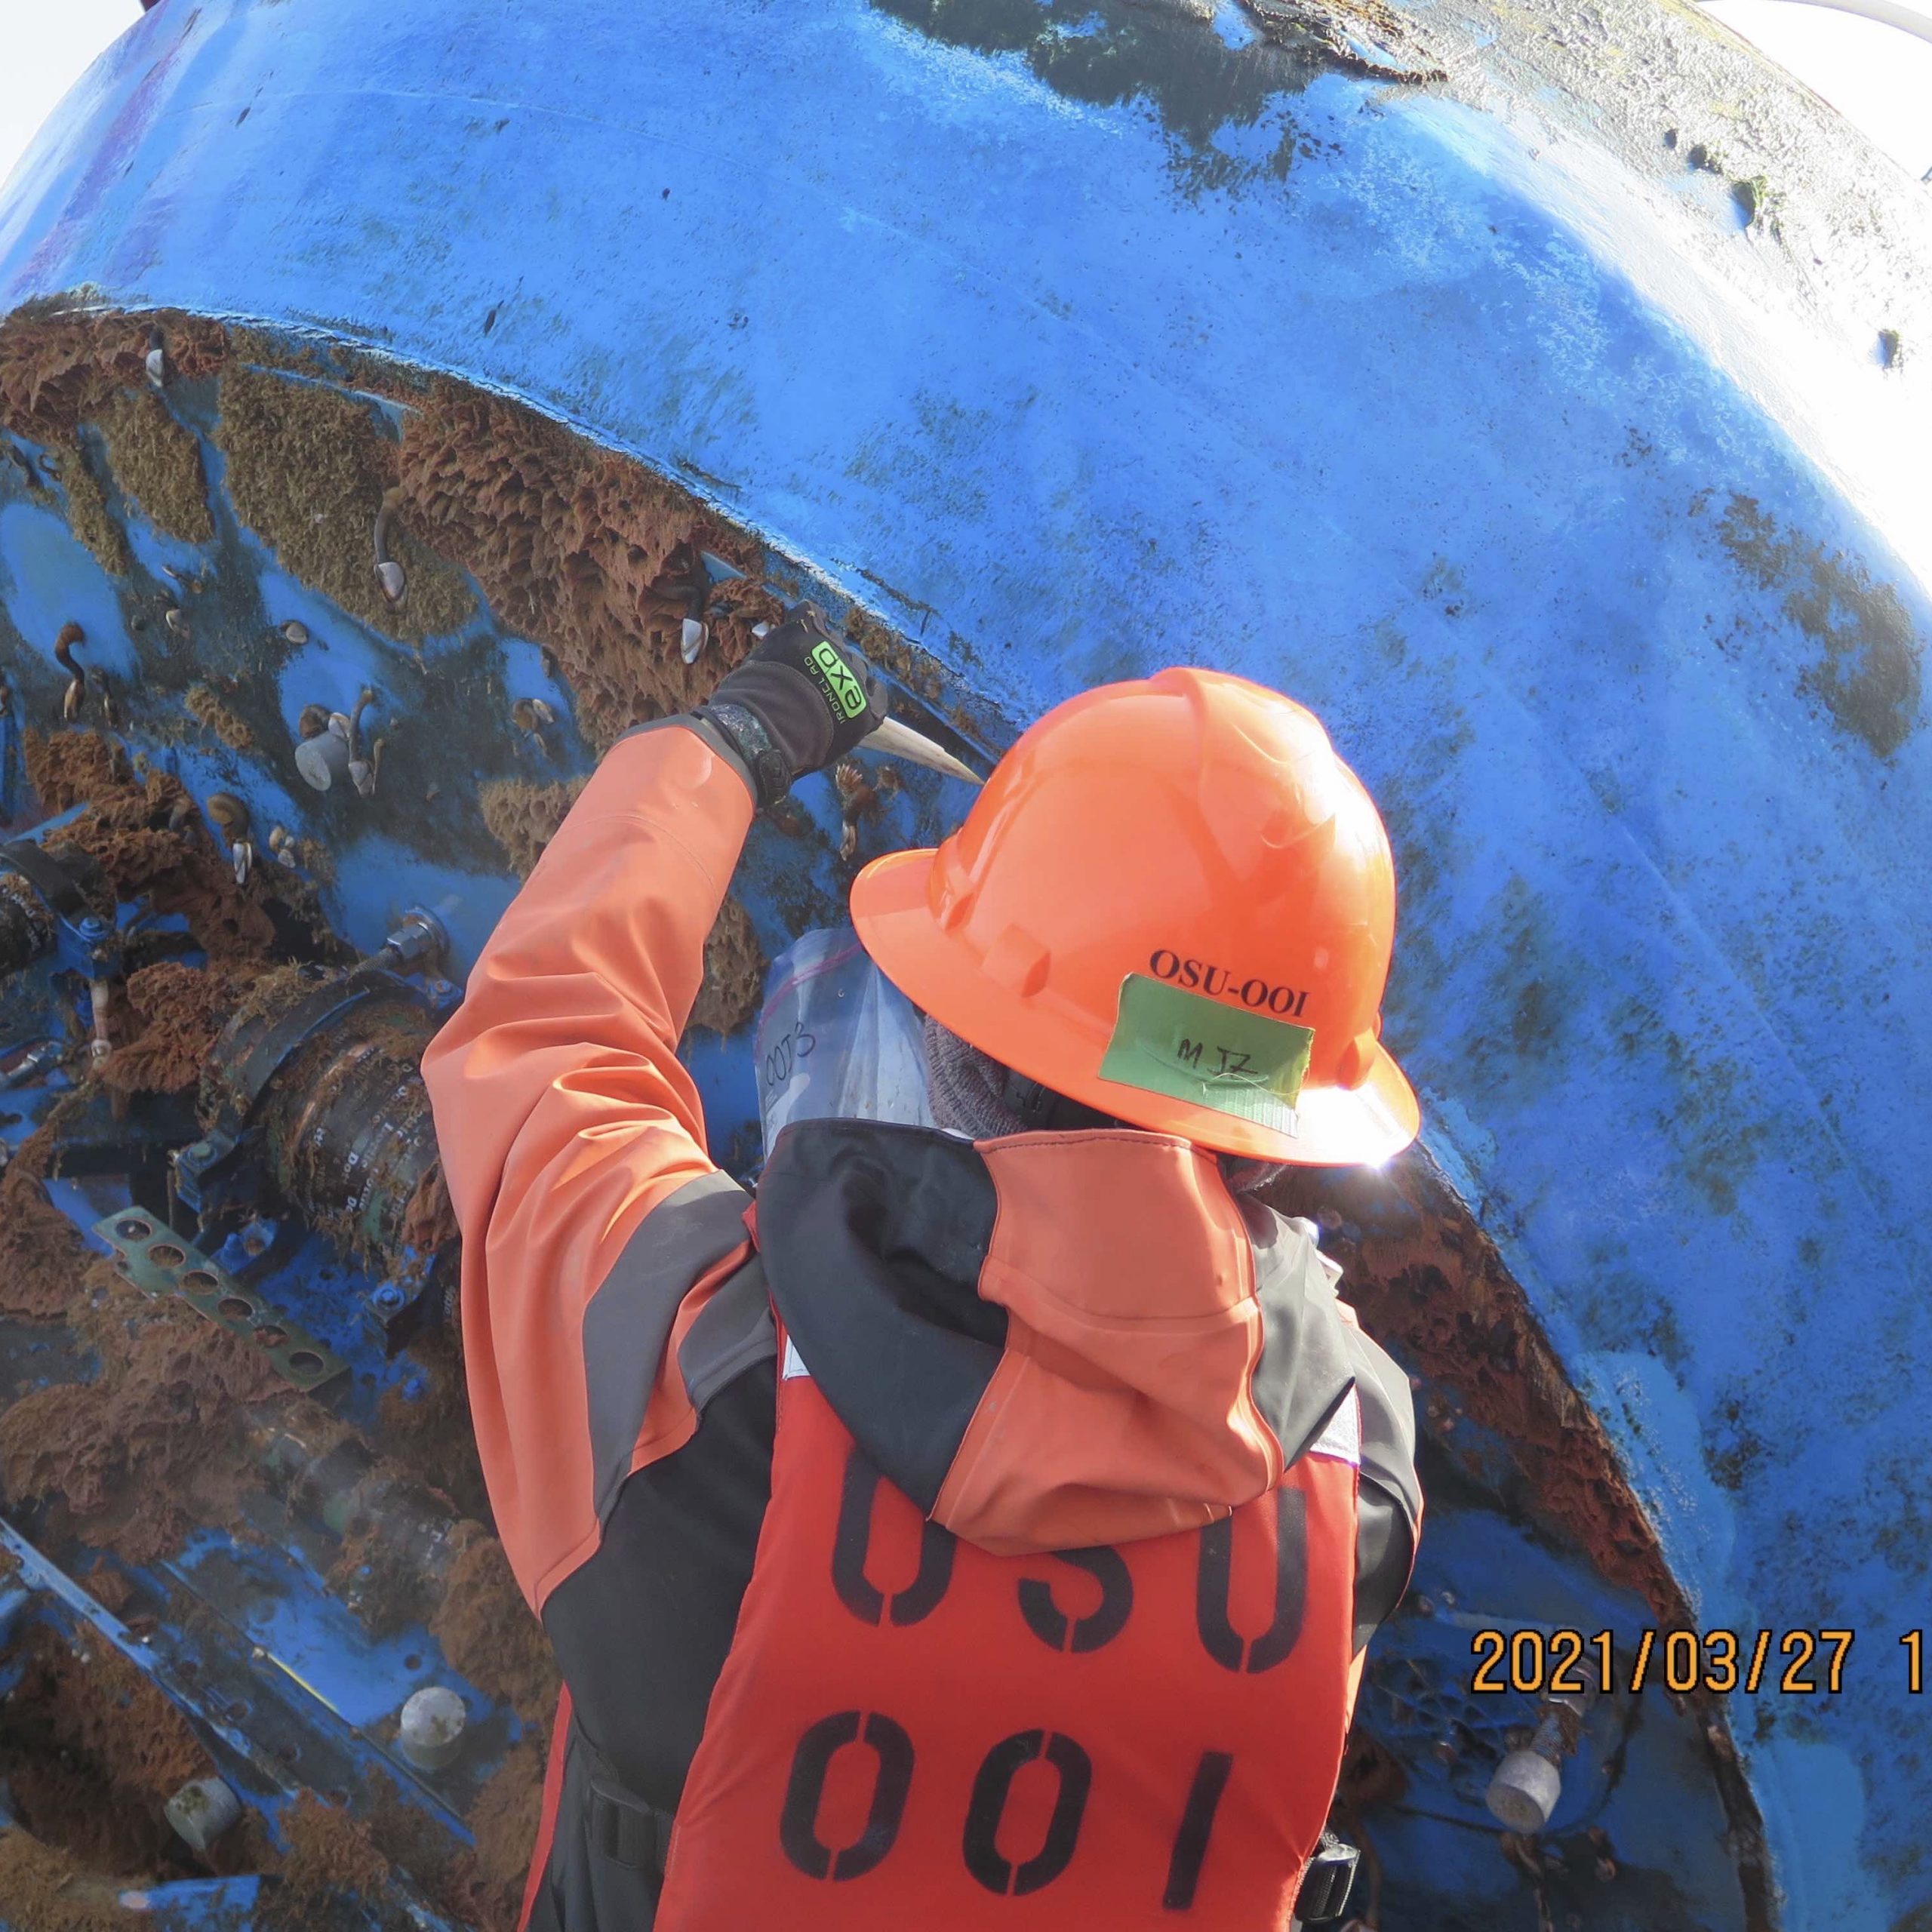
The Endurance team also collected CTD samples and biofouling samples to share with researchers at the Smithsonian Institute and Oklahoma State University. The R/V Sikuliaq returned to Newport on 7 April with the recovered equipment, which will undergo refurbishment for the next turn of the Endurance Array in September.
“Since 2017, we’ve sailed on the R/V Sikuliaq for six out of nine cruises,” said Ed Dever, the Chief Scientist of Endurance 14. “It’s a match that works well. From ship handling and on-deck assistance to mobilization of underway science sensors, lifting gear, engineering, accommodations, and food, we are deeply appreciative of the Sikuliaq’s captain, crew, and the ship herself.”
Read MoreA Bountiful Sea of Data: Making Echosounder Data More Useful
[media-caption path="https://oceanobservatories.org/wp-content/uploads/2021/03/Screen-Shot-2021-03-30-at-5.51.41-PM.png" link="#"]Researchers used echosounder data from the Oregon Offshore site of the Coastal Endurance Array to develop a new methodology that makes it easier to extract dominant patterns and trends.[/media-caption]The ocean is like a underwater cocktail party. Imagine, as a researcher, trying to follow a story someone is telling while other loud conversations are in the background of a recording. This phenomenon, known as the “Cocktail Party Problem,” has been studied since the 1950s (Cherry, 1953; McDermott, 2009). Oceanographers face this challenge in sorting through ocean acoustics data, with its mixture of echoes from acoustic signals sent out to probe the ocean.
Oceanographer Wu-Jung Lee and data scientist Valentina Staneva, at the University of Washington, teamed up to tackle the challenge in a multidisciplinary approach to analyze the vast amounts of data generated by echosounders on Ocean Observatories Initiative (OOI) arrays. Their findings were published in The Journal of the Acoustical Society of America, where they proposed a new methodology that uses machine learning to parse out noisy outliers from rich echosounder datasets and to summarize large volumes of data in a compact and efficient way.
This new methodology will help researchers use data from long time series and extract dominant patterns and trends in sonar echoes to allow for better interpretation of what is happening in the water column.
The ocean is highly dynamic and complex at the Oregon Offshore site of the OOI Coastal Endurance Array, where echosounder data from a cabled sonar were used in this paper. At this site, zooplankton migrate on a diurnal basis from a few hundred meters to the surface, wind-stress curl and offshore eddies interact with the coastal circulation, and a subsurface undercurrent moves poleward. The echosounder data offer opportunities to better understand the animals’ response to immediate environmental conditions and long-term trends. During the total eclipse of the Sun in August 2017, for example, echosounders captured the zooplankton’s reaction to the suddenly dimmed sunlight by moving upwards as if it was dusk time for them to swim toward the surface to feed (Barth et al, 2018).
Open access of echosounder datasets from the OOI arrays offers researchers the potential to study trends that occur over extended stretches of time or space. But commonly these rich datasets are underused because they require significant processing to parse out what is important from what is not.
Echosounders work by sending out pulses of sound waves that bounce off objects. Based on how long it takes for the reflected echo to come back to the sensor, researchers can determine the distance of the object. That data can be visualized as an echogram, an image similar to an ultrasound image of an unborn baby.
But unlike an ultrasound of a baby, when an undersea acoustic sensor records a signal, it may be a combination of signals from different sources. For example, the signal might be echoes bouncing off zooplankton or schools of fish.
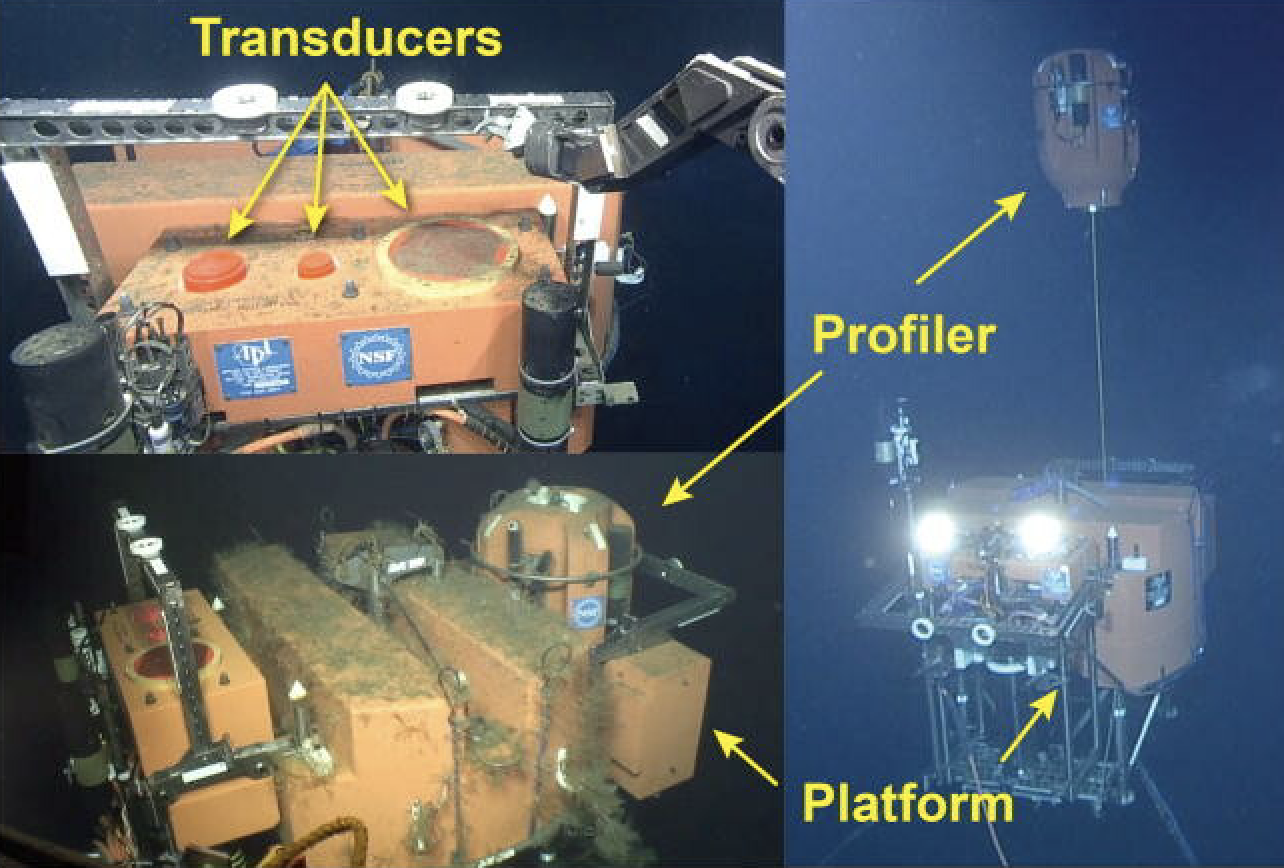
[caption id="attachment_20566" align="alignleft" width="350"]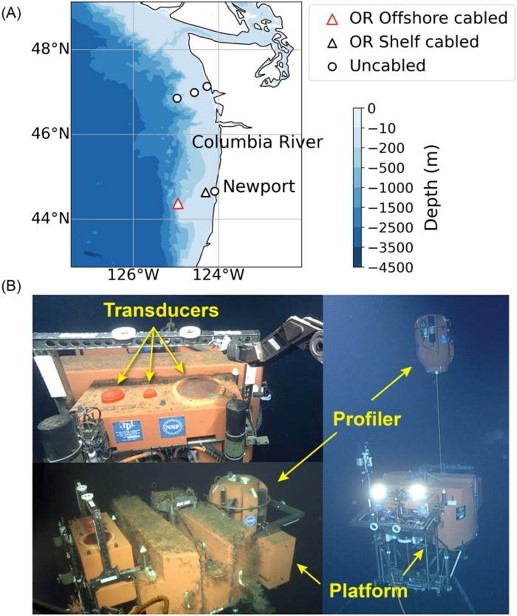 (A) Data used in this work were collected by a three-frequency echosounder installed on a Regional Cabled Array Shallow Profiler mooring hosting an underwater platform (200 m water depth) and profiler science pod located at the Oregon Offshore site of the OOI Coastal Endurance Array (red triangle). The symbols indicate the locations of all OOI echosounders installed along the coast of Oregon and Washington. (B) The transducers are integrated into the mooring platform (from left to right: 120, 200, and 38 kHz). The platform also hosts an instrumented profiler that traverses the water column above the echosounder from ~ 200 m to ~ 5m beneath the ocean’s surface. (Image credit: UW/NSF-OOI/WHOI-V15).[/caption]
“When the scatterers are of different size, they will reflect the sound at different frequencies with different strengths,” said Lee. “So, by looking at how strong an echo is at different frequencies, you will get an idea of the range of sizes that you are seeing in your echogram.”
Current echogram analysis commonly requires human judgement and physics-based models to separate the sources and obtain useful summary statistics. But for large volumes of data that span months or even years, that analysis can be too much for a person or small group of researchers to handle. Lee and Staneva’s new methodology utilizes machine learning algorithms to do this inspection automatically.
“Instead of having millions of pixels that you don’t know how to interpret, machine learning reduces the dataset to a few patterns that are easier to analyze,” said Staneva.
Machine learning ensures that the analysis will be data-driven and standardized, thus reducing the human bias and replicability challenges inherently present in manual approaches.
“That’s the really powerful part of this type of methodology,” said Lee. “To be able to go from the data-driven direction and say, what can we learn from this dataset if we do not know what may have happened in a particular location or time period.”
Lee and Staneva hope that by making the echosounder data and analytical methods open access, it will improve the democratization of data and make it more usable for everybody, even those who do not live by the ocean.
In the future, they plan to continue working together and use their new methodology to analyze the over 1000 days of echosounder data from the OOI Endurance Coastal and Regional Cabled Array region.
References
Lee, W-J and Staneva, V (2021).Compact representation of temporal processes in echosounder time series via matrix decomposition. Special Issue on Machine Learning in Acoustics. The Journal of the Acoustical Society of America.
Barth JA, Fram JP, et al. (2018). Warm Blobs, Low-Oxygen Events, and an Eclipse: The Ocean Observatories Initiative Endurance Array Captures Them All.Oceanography, Vol 31.
McDermott, J (2009). The Cocktail Party Problem.Current Biology, Vol 19, Issue 22.
Cherry EC (1953). Some Experiments on the Recognition of Speech, with One and Two Ears.The Journal of the Acoustical Society of America. Vol. 25, No.5.
Read More
Spring Expeditions: Keeping OOI Arrays Fully Operational
OOI teams were in the water on opposite coasts in late March to service the Pioneer and Endurance Arrays. The teams will “turn” the moorings (recover old and deploy new) to keep the arrays continually collecting and reporting data back to shore. This is the 14th turn of the Endurance Array; the 16th for the Pioneer Array.
The Endurance 14 Team set sail from Newport Oregon aboard the R/V Sikuliaq on 24 March for a 15-day expedition. The Pioneer 16 Team departed from Woods Hole, MA, a few days later on 29 March aboard the R/V Armstrong for a 21-day mission. Both expeditions will require two legs because of the need to transport a huge amount of equipment. The equipment for the Pioneer Array weighs more than 129 tons. The Endurance equipment tops the scale at 95 tons.
Departures for both teams occurred after arranging for reduced occupancy on site and social distancing during preparation, followed by 14 days of quarantine to meet COVID-19 restrictions. And while onboard, COVID has necessitated other changes ranging from smaller science parties to scheduled meal times to allow for social distancing.
“It is very impressive that the OOI team has been able to continue to service these arrays in spite of the challenges presented by COVID,” said Al Plueddemann, Chief Scientist of the Pioneer 16 Expedition. “The ocean is a tough environment in which to keep equipment operational, even in normal times. This year, in particular, has required both our shore-based staff and those onboard to be adaptable, flexible, and innovative to get the job done.”
[media-caption path="https://oceanobservatories.org/wp-content/uploads/2021/03/burnin_Travis.jpg" link="#"]The full cycle of preparation for an OOI mooring service cruise takes many months. The “burn-in” period for Pioneer-16, during which equipment is assembled and tested, began in January 2021 with snow on the ground outside of the LOSOS building on the WHOI campus. Credit:Rebecca Travis © WHOI.[/media-caption]In addition to the mooring and deployment recoveries, both teams are deploying and recovering gliders that collect additional data within the water column and the area between the moorings. They also are conducting CTD casts and water sampling at the mooring sites, and doing meteorological comparisons between ship and buoys. The Pioneer Team will be operating autonomous underwater vehicles (AUVs), while the Endurance Team will have its inaugural use of OOI’s own remotely operated vehicle (ROV) to recover anchors at the Oregon shelf site.
“In normal times, we would invite external students and scientists along to conduct ancillary experiments on the cruise,” said Edward Dever, Chief Scientist for Endurance 14. “But given the limited science party allowed onboard due to COVID-19, the OOI team will be conducting some of this additional work to ensure the continuity of these experiments.”
For Endurance 14, this work includes collection of organisms that grow on panels attached to Endurance buoys for invasive species research, collection of settling organisms on devices attached to Multi-Function Nodes, which power near bottom data instruments, and test deployments of tagged fish acoustic monitors on near surface instrument frames on three moorings.
Likewise, the Pioneer 16 Team is helping ensure ongoing science investigations installing and operating unattended underway sampling for the Northeast U.S. Shelf Long-Term Ecological Research (LTER) project and conducting CTD casts at LTER sites during the cruise. They will also conduct communication tests at the Offshore mooring site in support of the Keck-funded 3-D Acoustic Telescope project.
Science teams of 9-10 people on each cruise are sharing the multitude of tasks needed for the moored array service.
[media-caption path="https://oceanobservatories.org/wp-content/uploads//2021/03/Screen-Shot-2021-04-01-at-9.19.20-AM.png" link="#"]OOI’s remotely operated vehicle will be used for the first-time during Endurance 14. Credit: Seaview Systems.[/media-caption]
Read More