
Posts Tagged ‘Data’
Expanding Reach of OOI Data
 Pioneer Array data is now available on NERACOOS’ new Mariner’s Dashboard. This is but one example of how OOI data are integrated into other data repositories to maximize their benefit and use.[/caption]
OOI shares data with partner repositories and institutions that host similar data but have different user bases. These partnerships expand the data available for forecasting models, help provide insight into current ocean conditions, and serve as important resources for many ranging from fishers and other maritime users to land-based researchers and students.
With the exception of the Station Papa Array, the OOI Coastal and Global Arrays maintain surface buoys. Instruments deployed on these buoys measure meteorological variables such as air temperature, barometric pressure, northward and eastward wind velocities, precipitation, solar radiation, and surface water properties of sea surface temperature and salinity. Other instruments on the moorings collect wave data, such as significant wave height, period, and direction. These data are then consumed by national and regional networks to improve accuracy of weather forecasting models.
The Regional Cabled Array (RCA) consists of fiber-optic cables off the Oregon coast that provide power, bandwidth, and communication to seafloor instrumentation and moorings with instrumented profiling capabilities. A diverse array of geophysical, chemical, and biological sensors, a high-definition camera, and digital still cameras on the seafloor and mooring platforms, provide real-time information on processes operating on and below the seafloor and throughout the water column, including recording of seafloor eruptions, methane plume emissions and climate change. These data are available for community use. Since 2015, the RCA has fed data into Incorporated Research Institutions for Seismology (IRIS), the primary source for data related to earthquakes and other seismic activity. In addition, data including zooplankton sonar data, are being utilized within the Pangeo ecosystem for community visualization and access and pressure data are incorporated into NOAA’s operational tsunami forecasting system.
Helping Improve Models and Forecasting
One of the recipients of OOI data is the National Data Buoy Center (NDBC), part of the National Oceanic and Atmospheric Administration’s (NOAA) National Weather Service. NDBC maintains a data repository and website, offering a range of standardized real-time and near real-time meteorological data. Data such as wind speed and direction, air and surface water temperature, and wave height and direction are made available to the broader oceanographic and meteorological community.
“Many researchers go to NDBC for their data, “said Craig Risien, a research associate with OOI’s Endurance Array and Cyberinfrastructure Teams, who helps researchers gain access to and use OOI data. “NBDC is a huge repository of data and it’s easy to access. So there’s a low barrier for researchers and students who are looking for information about wind speed, water temperature and a slew of other data. OOI contributing to this national repository significantly increases its data reach, allowing OOI data to be used by as many people as possible. “
OOI sea surface temperature data also make their way into the operational Global Real-Time Ocean Forecast System (RTOFS) at the National Centers for Environmental Prediction (NCEP), another part of NOAA’s National Weather Service. RTOFS ingests sea surface temperature and salinity data from all available buoys into the Global Telecommunications System (GTS). OOI glider data also are pushed in near real-time to the US Integrated Ocean Observing System Glider Data Assembly Center (DAC). From there, the data goes to the GTS where it can be used by the operational modeling centers such as NCEP and the European Centre for Medium-Range Weather Forecasts.
The GTS is like a giant vacuum sucking up near real-time observations from all sorts of different platforms deployed all over the world. On a typical day, the GTS ingests more than 7,600 data points from fixed buoys alone. As a result of this vast input, researchers can go to the GTS, pull available data, and assimilate that information into any model to improve its prediction accuracy.
Advancing Forecasting of Submarine Eruptions
As the first U.S. ocean observatory to span a tectonic plate, RCA’s data are an invaluable contributor to IRIS’s collection. Since 2015, the user community has downloaded >20 Terabytes of RCA seismometer data from the IRIS repository. Fourteen different sampling locations include key sites at Axial Seamount on the Juan de Fuca mid-ocean ridge spreading center, near the toe of the Cascadia Margin and Southern Hydrate Ridge. RCA data are catalogued and available on the IRIS site, using the identifier “OO.”
[caption id="attachment_21046" align="alignleft" width="300"]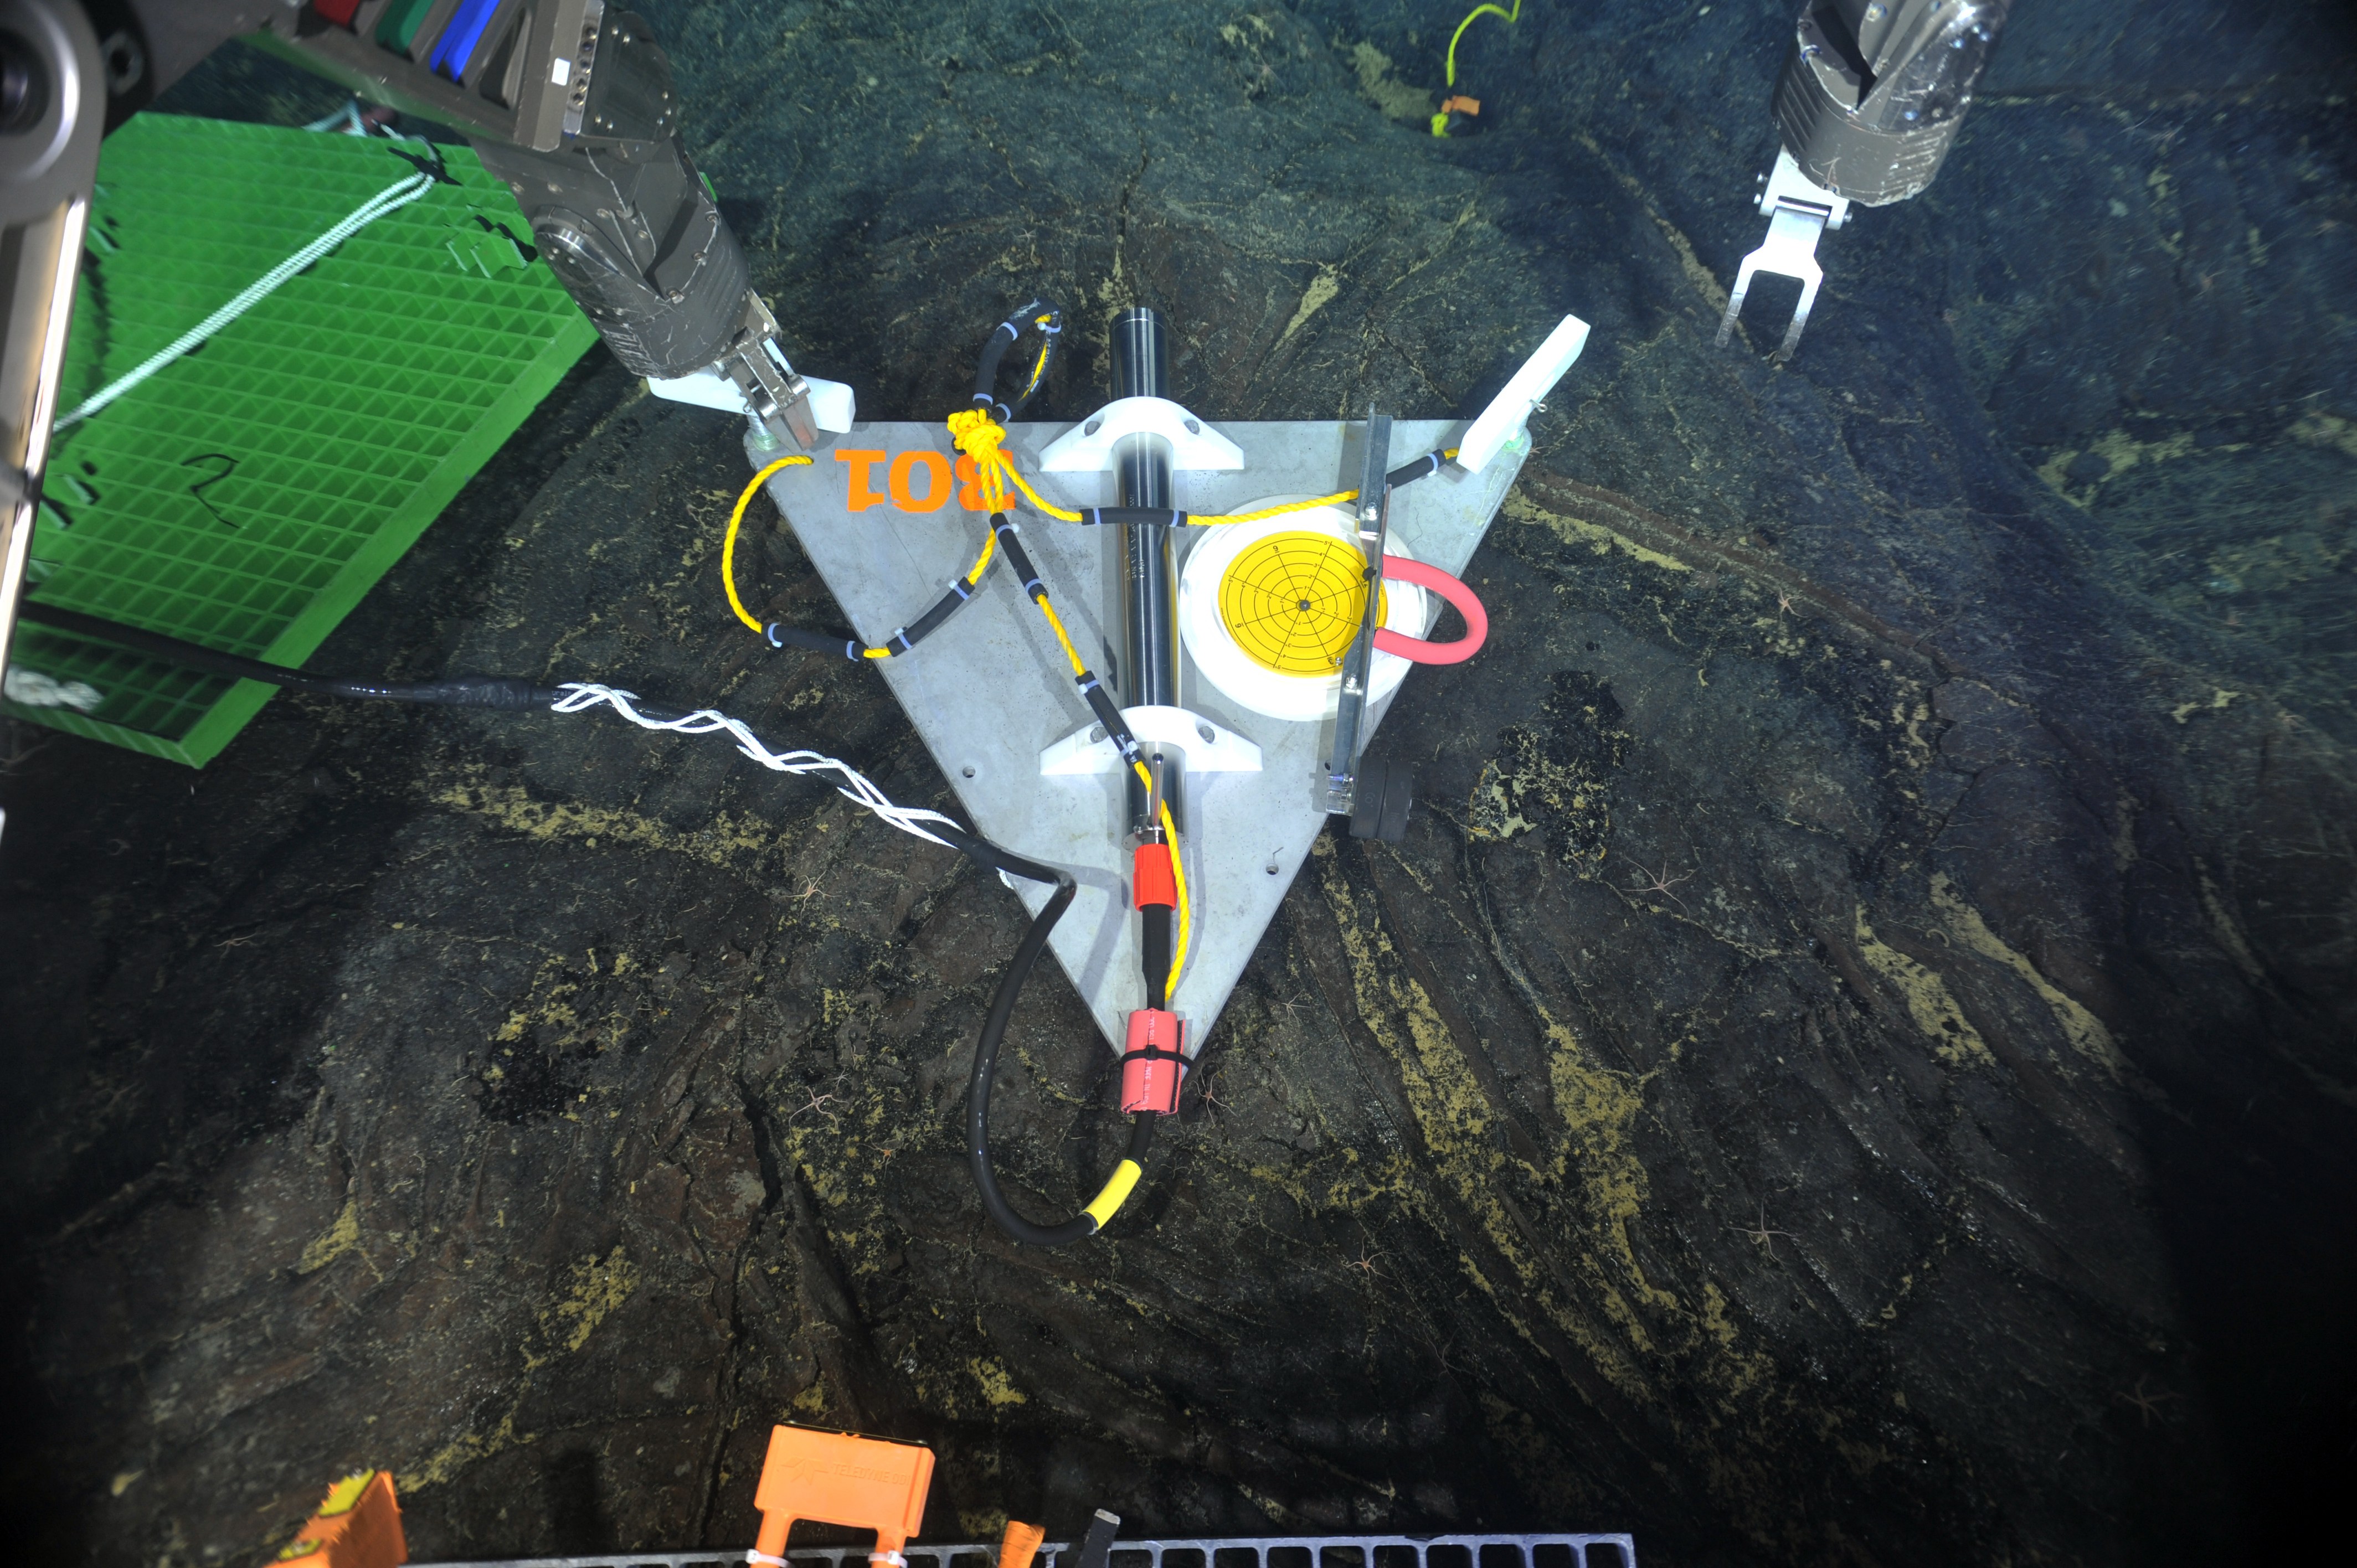 Data from short period seismometers installed at RCA’s Axial Seamount and Southern Hydrate Ridge sites are streamed live to IRIS. Credit: UW/NSF-OOI/Canadian Scientific Submersible Facility, V13.[/caption]
“RCA is a critical community resource for seismic data. Axial Seamount, for example, which erupted in 1998, April 2011, was the site of more than 8,000 earthquakes over a 24-hour period April 24, 2015 marking the start of large eruption,” explained Deb Kelley, PI of the RCA. “Being able to witness and measure seismic activity in real time is providing scientists with invaluable insights into eruption process, which along with co-registered pressure measurements is making forecasting possible of when the next eruption may occur. We are pleased to share data from this volcanically and hydrothermally active seamount so researchers the world over can use it to better understand processes happening at mid ocean ridges and advance forecasting capabilities for the first time of when a submarine eruption may occur.”
Providing Data with Regional Implications
[caption id="attachment_21047" align="alignright" width="203"]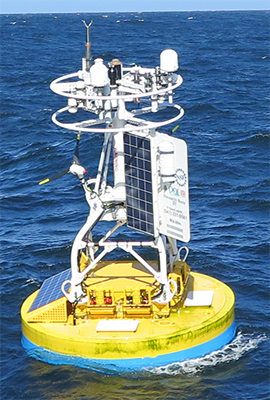 Data from Endurance Array buoy 46100 are fed into WCOFS, where they are accessible to maritime users. Credit: OSU[/caption]
OOI also provides data to regional ocean observing partners. Data from two Endurance Array buoys (46099 and 46100), for example, are fed into a four-dimensional U.S. West Coast Operational Forecast System (WCOFS), which serves the maritime user community. WCOFS generates water level, current, temperature and salinity nowcast and forecast fields four times per day. The Coastal Pioneer Array is within the future Northeastern Coast Operational Forecast System (NECOFS). Once operational, Pioneer’s observations will potentially be used for WCOFS data assimilation scenario experiments.
Coastal Endurance Array data are shared with the Northwest Association of Networked Ocean Observing Systems (NANOOS), which is part of IOOS, and the Global Ocean Acidification Observing Network (GOA-ON). Endurance data are ingested by the NANOOS Visualization System, which provides easy access to observations, forecasts, and data visualizations. Likewise, for GOA-ON, the Endurance Array provides observations useful for measuring ocean acidification.
Data from three of the Pioneer Array buoys also are part of the Mariners’ Dashboard, a new ocean information interface at the Northeastern Regional Association of Coastal Ocean Observing Systems (NERACOOS). Visitors can use the Dashboard to explore the latest conditions and forecasts from the Pioneer Inshore (44075), Central (44076), and Offshore (44077) mooring platforms, in addition to 30+ other observing platforms throughout the Northeast.
“We are working hard to distribute the OOI data widely through engagement with multiple partners, which together are helping inform science, improve weather and climate forecasts, and increase understanding of the ocean,” added Al Plueddemann, PI of the Coastal and Global Scale Nodes, which include the Pioneer, Station Papa, and Irminger Sea Arrays.
Read More
Pioneer Data Now on New Mariners’ Dashboard
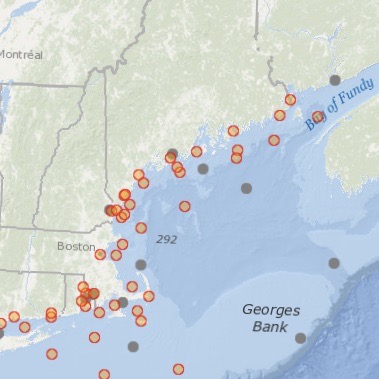
Data from three of the Ocean Observing Initiative’s (OOI) Pioneer Array buoys are now part of the Mariners’ Dashboard, a new ocean information interface launched by our partners at NERACOOS (Northeastern Regional Association of Coastal Ocean Observing Systems). Visitors can use the Dashboard to explore the latest conditions and forecasts from the Pioneer Inshore, Central, and Offshore mooring platforms, in addition to 30+ other observing platforms throughout the Northeast.
The Mariner Dashboard delivers high-quality, timely data from a growing network of buoys and sensors into the hands of mariners heading to sea. The data provided by the Pioneer moorings are particularly valuable because there are few other observing platforms in the highly traveled and productive shelf break region.
Observations provided range from air pressure and temperature, sea surface temperature, wave height, direction, velocity, and duration to salinity. Check out the Pioneer Array’s contributions to the wealth of information on the new Mariners’ Dashboard here:
[caption id="attachment_20963" align="alignleft" width="113"]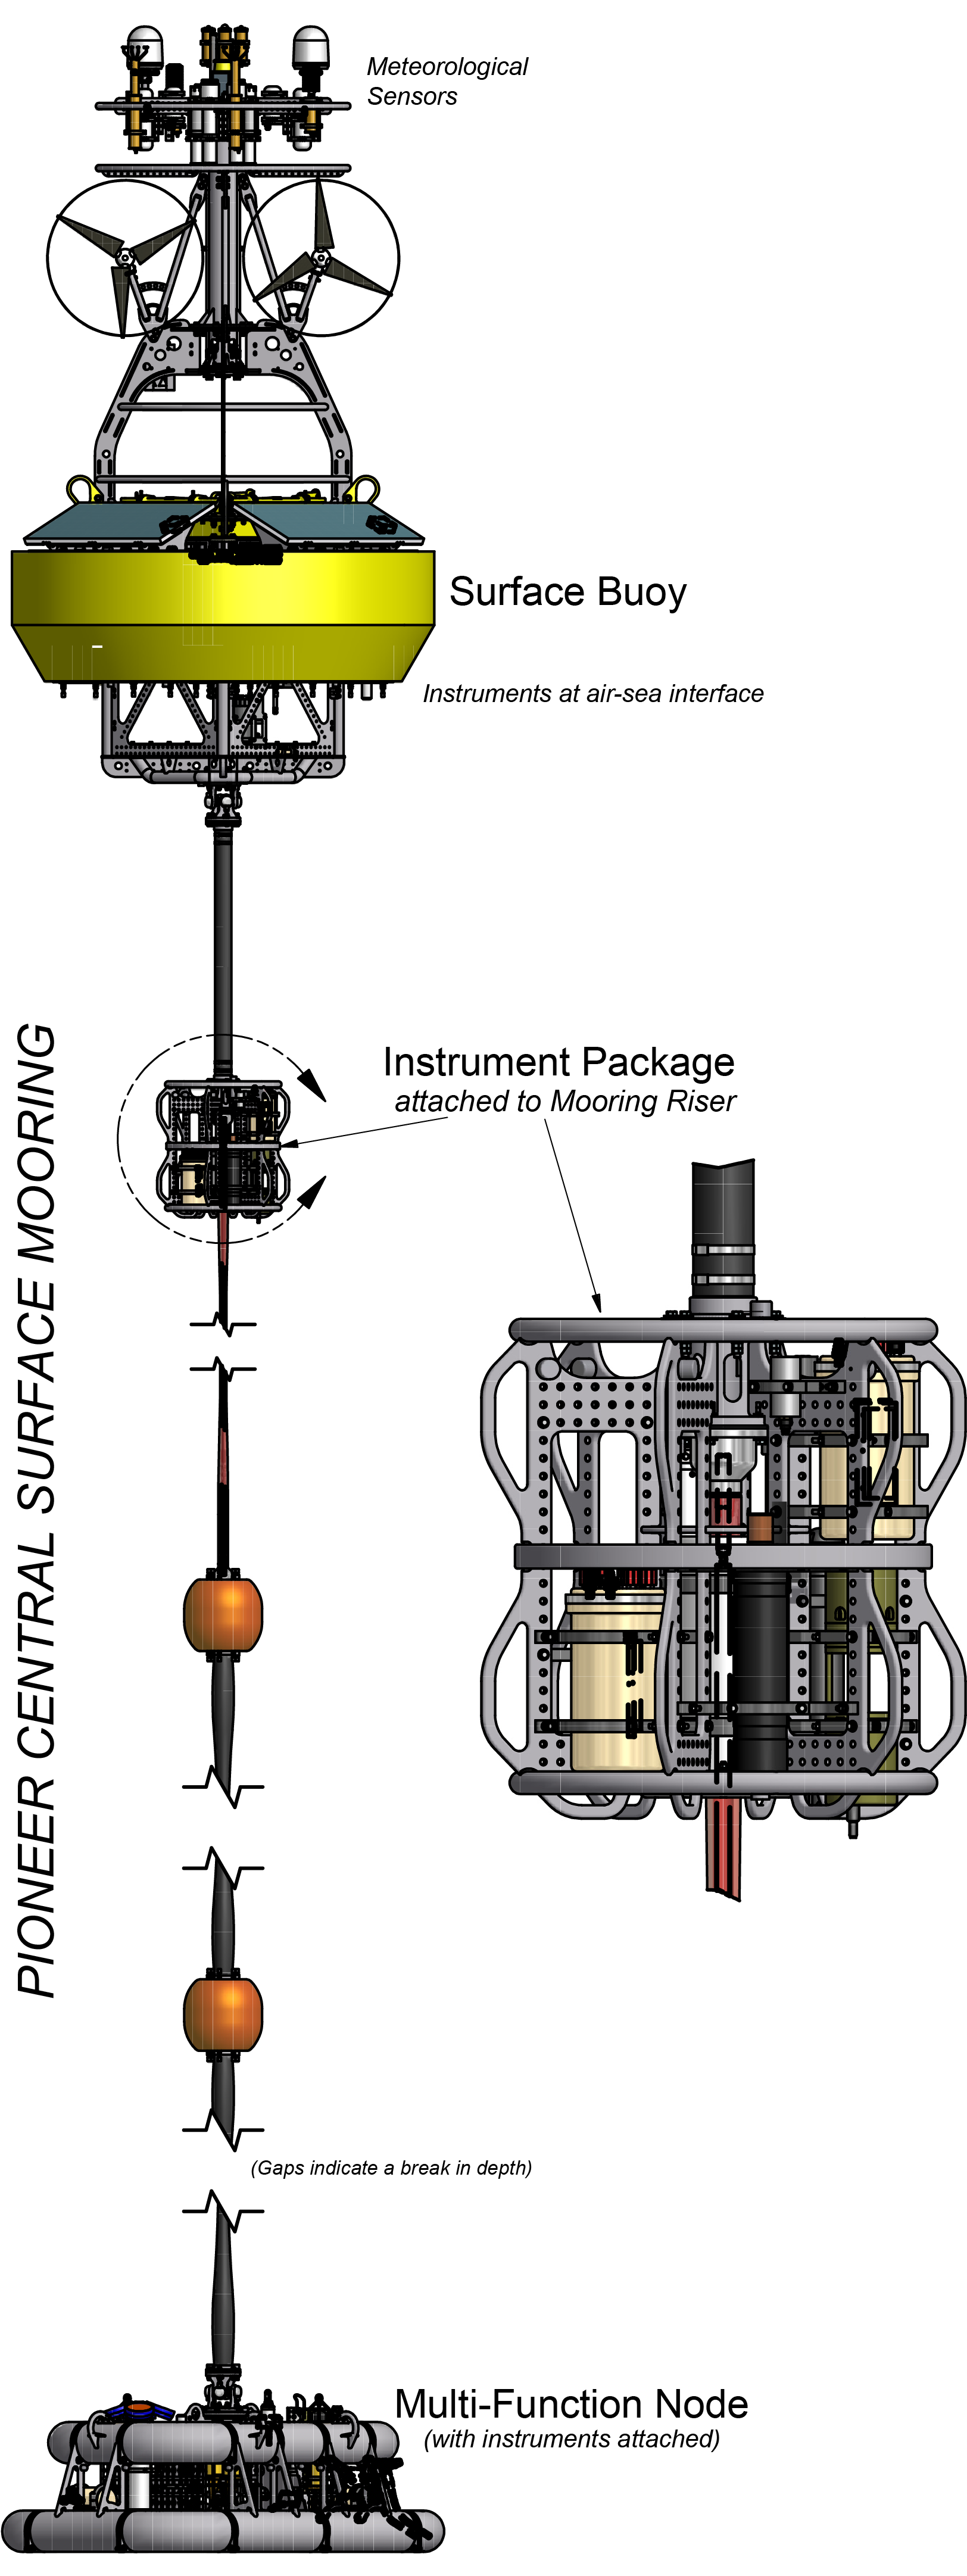 Components used to collect and transmit ocean observations to shore.[/caption]
Pioneer offshore https://mariners.neracoos.org/platform/44077
Pioneer central: https://mariners.neracoos.org/platform/44076
Pioneer inshore: https://mariners.neracoos.org/platform/44075
“We are pleased to see the Pioneer Array data being made more widely available through the Mariners’ Dashboard to help provide information about current ocean conditions,” said Al Plueddemann, head of the Ocean Observatories Initiative Coastal and Global Surface Nodes team, which includes the Pioneer Array. “This is just one example of how OOI data, which are freely available to anyone with an Internet connection, are being put to good use.”
Read More
Demo of Data Explorer 1.1 Video
Data Explorer continues to be refined in response to data users’ suggestions. Upcoming updates and refinements are previewed in this 55-minute video. The new, improved site will launch 5 May 2021. Look for it!
[embed]https://youtu.be/WhXgQ5qe78E[/embed] Read More
Opportunity to Preview Data Explorer 1.1
OOI’s new data access and visualization tool, Data Explorer, has been operational for about six months now. During that time, OOI’s Development Team has been revising it to incorporate input from community users.
We’d like to give the OOI Community an opportunity to preview this next iteration and give us your thoughts. Please join OOI Data Lead Jeff Glatstein and members of the Data Explorer Development Team on 9 April 2021 at 2 pm Eastern. Register here. We will briefly show participants the revised tool and receive any feedback you may have. Our goal is to continually improve this tool to better meet your needs.
Look forward to seeing you in early April.
Read MoreNew Discrete Water Sampling Spreadsheets Available
To provide context and comparison for data collected by OOI instrumentation, OOI collects and disseminates data collected by shipboard underway sensors and from water samples from CTD casts. Shipboard underway data can be accessed by using username and password ‘guest’ on the OOI Alfresco Document Management System, organized by cruise. Each cruise folder contains a Ship Data folder in the format provided by the ship operators and a Water Sampling subfolder. The Water Sampling subfolder includes scanned and digitized versions of the CTD logs, as well as, discrete water sample analyses in the formats provided by the labs which conducted the analyses.
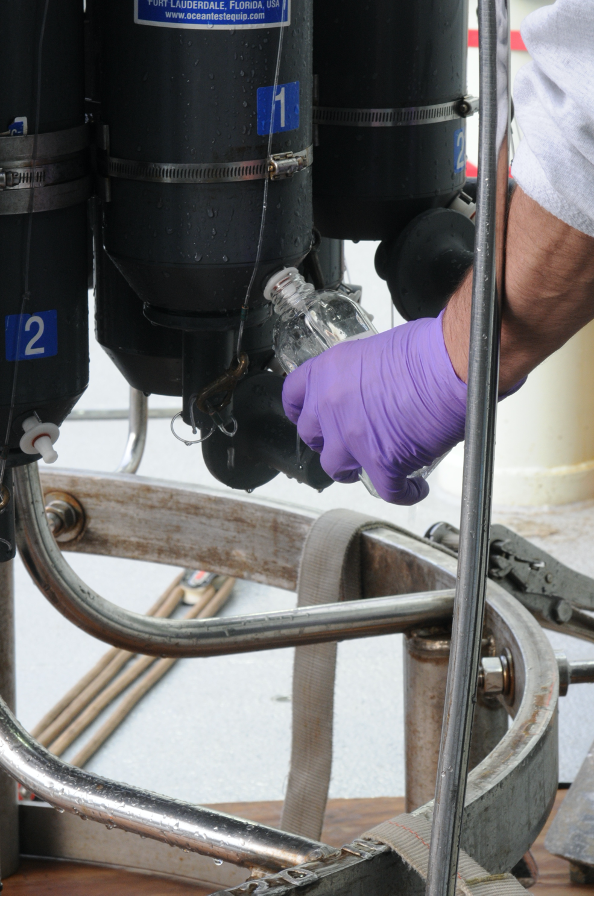
[caption id="attachment_20259" align="alignleft" width="199"] Collecting water samples from the CTD rosette on the Pioneer 8 cruise aboard the R/V Neil Armstrong. ©WHOI.[/caption]
To make these data more easily accessible to the science community, we have developed a common template to provide a full set of discrete water sample data from a cruise. These “Discrete_Sample_Summary” spreadsheets include the details for each Niskin bottle fired on a CTD cast, the CTD instrument rosette data from the time of bottle closure, and the water sample data and quality flags based on World Ocean Circulation Experiment (WOCE) standards.
These CSV files with common data formats can easily be read and manipulated in MATLAB, Python, or other computing programs and languages. Because water analysis data are received at different times from different labs, these spreadsheets are updated as data become available. An accompanying README file contains version history, general notes, and a description of the quality flags. The original spreadsheets from labs, which may contain additional data and methodology, will also be posted.
An example of how to read and use this discrete sample data can be found in this Jupyter notebook. Discrete_Sample_Summary spreadsheets have been posted for the Regional Cabled Array cruises 6-10, the Coastal Endurance Array cruises 1-13, and the Global Irminger Sea Array cruises 1-6. We will continue to work on completing spreadsheets for past cruises as well as cruises going forward.
[caption id="attachment_20261" align="aligncenter" width="640"]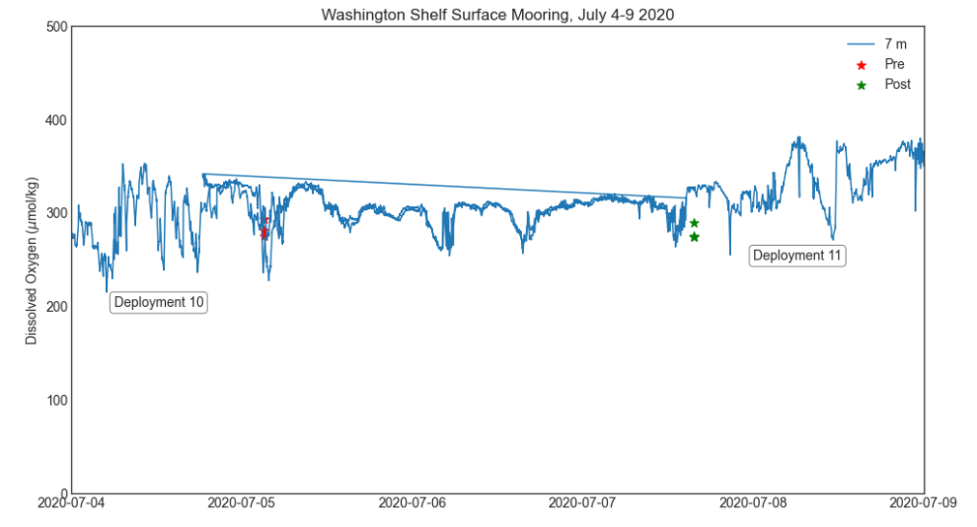 Comparison of dissolved oxygen data on the Washington Shelf Surface Mooring with water sampling data from Endurance Cruise 13. Data from Deployment 10 and Deployment 11 are plotted together, and overlap during 5-7 July.[/caption]
Read More
Comparison of dissolved oxygen data on the Washington Shelf Surface Mooring with water sampling data from Endurance Cruise 13. Data from Deployment 10 and Deployment 11 are plotted together, and overlap during 5-7 July.[/caption]
Read More NSF Webinar on Center for Advancement & Synthesis of Open Environmental Data & Sciences Competition

On February 23, 2021 at 3:00 PM EST, NSF will host a one-hour webinar to provide information concerning the competition for a Center for Advancement & Synthesis of Open Environmental Data & Sciences (NSF 21-549). The National Science Foundation’s (NSF) Divisions of Biological Infrastructure (DBI), Environmental Biology (DEB), and the Office for Advanced Cyberinfrastructure (OAC) are hosting the webinar. Following a brief presentation, program directors will be available to answer questions from participants.
Open biological and other environmental data are produced by NSF investments in research and infrastructure such as the National Ecological Observatory Network (NEON), the Ocean Observatories Initiative (OOI), the Long-Term Ecological Research (LTER) network, and the Integrated Digitized Biocollections (iDigBio), as well as by many other public and private initiatives in the U.S. and worldwide. These efforts afford opportunities for collaborative investigations that will advance our predictive understanding of life on Earth; publicly available data are burgeoning. Access to and creative use of these data can democratize science and diversify the STEM workforce as never before by making the same data available to and usable by everyone, from collaborative teams of experts to individual students, researchers, educators and policy makers.
In response, NSF seeks to establish a Center fueled by open and freely available biological and other environmental data to catalyze novel scientific questions in environmental biology through the use of data-intensive approaches, team science and research networks, and training in the accession, management, analysis, visualization, and synthesis of large data sets. The Center will provide vision for speeding discovery through the increased use of large, publicly accessible datasets to address biological research questions through collaborations with scientists in other related disciplines.
Register in advance for this webinar:
https://nsf.zoomgov.com/webinar/register/WN_YvILcBaDRSWB6fCtbR6cAg
Or an H.323/SIP room system:
H.323: 161.199.138.10 (US West) or 161.199.136.10 (US East)
Meeting ID: 161 025 1954
Passcode: 179784
SIP: 1610251954@sip.zoomgov.com
Passcode: 179784
After registering, you will receive a confirmation email containing information about joining the webinar.
Contact: Hannah Perry hanperry@nsf.gov
Read More
HelpDesk Moves to Discourse

Questions submitted to OOI’s HelpDesk will now be shared and answered on OOI’s community forum on Discourse. This move was initiated in January 2021 as a way to make such queries more transparent, with the hope that the answers would help inform the broader OOI community and possibly initiate a dialogue among OOI data users themselves.
“HelpDesk questions range in complexity, depending upon the experience of OOI data users. By posting basic questions about accessing data to detailed queries about particular data, we hope to provide a resource for users at all experience levels,” said Jeff Glatstein, Senior Manager of Cyberinfrastructure and OOI Data Delivery Lead. Members of the OOI Data Team, comprised of representatives from all of the OOI arrays, answer questions relevant to data collected by the arrays. The platform offers the team a way to quickly engage with questioners and vice versa.
The team expects that some of the questions submitted will spark discussion amongst the data users themselves. “Having the questions presented on an open forum like Discourse provides an opportunity for OOI data users to share their knowledge and lend insight into specific data-related questions,” added Glatstein.
In addition to the HelpDesk, Discourse contains an FAQ section, and discussion sections for sharing of data tools, innovations, and findings, known data issues, and other areas where users’ exchange of information can be helpful. The implementation of Discourse was recommended by the OOI Facility Board as a means to encourage exchange between members of the OOI community. OOI’s forum is modeled after the Pangeo Discourse, which is a successful community of scientists and software developers working together to improve scientific research.
All OOI data users and potential OOI data users are encouraged to try out, then bookmark, Discourse. By sharing knowledge, questions and answers, OOI can join the ranks of helping to advance scientific research through engaged dialogue and collaboration. See you online!
Read More
See the Data Explorer in Action!
In case you missed it, here is an opportunity to see a live demo of the new Data Explorer tool. OOI Data Deliver Lead Jeff Glatstein provides a quick look at how the Data Explorer was developed. Craig Risien of the Coastal Endurance Array Team follows with a live demonstration of the tool’s capabilities using Endurance Array data to create a data view. Axiom Developer Brian Stone concludes the demo by answering questions and digging deeper into the many features of this outstanding new tool.
Watch now!
https://youtu.be/BBxdii0M-nA
Read More
New Data Explorer Live! Demo 21 October
As of today, accessing, visualizing, and integrating OOI data into research and classrooms is a whole lot easier. The Ocean Observatories Initiative launched its new data exploration tool – OOI Data Explorer version 1.0 on 5 October. Data Explorer allows users to search and download cabled, uncabled, and recovered data, compare datasets across regions and disciplines, generate and share custom data views, and download full data sets using ERDDAP.
The OOI Data Team worked with Axiom Data Science to develop a data exploration system that is both powerful and user friendly. Version 1.0 has already been beta tested over the past three months by a subset of OOI scientific data users. This group’s feedback has improved Data Explorer, making it ready for broader distribution and use.
A live demonstration of Data Explorer is scheduled for 21 October at 2 pm EDT. This timeframe will allow users to try their hands using Data Explorer and come to the demonstration ready with specific questions about accessing data or suggestions on functions that could further enhance the user experience. To reserve a spot at the live demo, please register here.
“Data Explorer version 1.0 is the culmination of a process of listening to OOI data users and responding by implementing easier, more efficient, and useful means to deliver OOI data to them,” explained Jeffrey Glatstein, head of OOI’s Cyberinfrastructure, who guided a team of data and visualization experts in developing the tool. “It is an excellent tool that has been refined over the test period, and which we will continue to refine it in response to users’ suggestions. While continued improvements will be made and more data continually added, Data Explorer version 1.0 offers a great new way to find, access, and use OOI data.”
To ensure that all OOI data users maintain access to data, OOI’s current data portal will remain accessible and functional until the foreseeable future. Once all data have been exported to Data Explorer, tested, and vetted, only then will a complete switch be made to this new innovative tool.
The developers caution that Data Explorer version 1.0 may still have a few bugs, and users are asked to report them so the tool can be improved.
Added Glatstein, “Data Explorer is really a community-driven tool and it will be exciting to see how we can refine and improve it to meet the needs of our community.”
Read MoreOSU Assumes Cyberinfrastructure Responsibility for OOI
![]()
Woods Hole Oceanographic Institution (WHOI) and Oregon State University (OSU) jointly announced that OSU will assume responsibilities for the systems management of the cyberinfrastructure that makes data transmission for the Ocean Observatories Initiative (OOI) possible through September of 2023. OSU was awarded this role after a systematic and thorough selection process. Rutgers, the State University of New Jersey, has provided OOI’s Cyberinfrastructure systems management since 2014, and will leave the OOI Program in 2021 following a transition period with OSU. The OOI consists of five instrumented observatories in the Atlantic and Pacific Oceans outfitted with more than 900 instruments that continually collect and deliver data to shore via a cyberinfrastructure, which makes the data available to anyone with an Internet connection. The demands on the cyberinfrastructure are great, as it stores 73 billion rows of data, and has provided 36 terabytes of data in response to 189 million user requests since 2014. With the data requests and delivery demands increasing each year, the OOI has the capability to provide data that allows inquiries into episodic ecosystem events in real-time, as well as investigations using long-term time series data. The OOI is made possible through a funded five-year cooperative agreement to WHOI from the National Science Foundation. The OSU award is for $6 million over a three-year period.
“We are delighted that OSU has the capabilities and expertise to take on this hugely important task,” says John Trowbridge, Principal Investigator of the Program Management Office of the OOI at WHOI. “The OOI has become a dependable source of real-time ocean data, helping scientists answer pressing questions about the changing ocean. Educators use real-time ocean data to teach students about the fundamentals of oceanography, the global carbon cycle, climate variability, and other important topics. The team at OSU will help advance this work and ensure that OOI data are served reliably to an ever-growing audience.
“We are also extremely grateful to the Rutgers team for the excellent foundation they established over the past six years that will allow a seamless transition to the OSU cyberinfrastructure team. Rutgers was an important partner that helped establish OOI as a reliable data provider,” adds Trowbridge.
“OSU brings the perfect mix of hardware, software, and ocean data experts to ensure that we are able to store and serve up this gargantuan amount of important ocean data,” adds Anthony Koppers, Principal Investigator for the OSU Cyberinfrastructure Systems Team. “We have the key personnel and systems in place that will allow us to seamlessly take on the challenge of storing and serving OOI data, strategically planning for future data demands and implementing cybersecurity. We also will be working hand-in-hand with the OOI’s Data Management Team to ensure the data meets the highest quality standards.”
OSU’s cyberinfrastructure will handle telemetered, recovered, and streaming data. Telemetered data are delivered to the cyberinfrastructure from moorings and gliders using remote access such as satellites. Recovered data are complete datasets that are retrieved and uploaded to the cyberinfrastructure once an ocean observing platform is recovered from the field. Streaming data are delivered in real time directly from instruments in the field.
Read More