
Posts Tagged ‘Irminger Sea Array’
Expanding Reach of OOI Data
 Pioneer Array data is now available on NERACOOS’ new Mariner’s Dashboard. This is but one example of how OOI data are integrated into other data repositories to maximize their benefit and use.[/caption]
OOI shares data with partner repositories and institutions that host similar data but have different user bases. These partnerships expand the data available for forecasting models, help provide insight into current ocean conditions, and serve as important resources for many ranging from fishers and other maritime users to land-based researchers and students.
With the exception of the Station Papa Array, the OOI Coastal and Global Arrays maintain surface buoys. Instruments deployed on these buoys measure meteorological variables such as air temperature, barometric pressure, northward and eastward wind velocities, precipitation, solar radiation, and surface water properties of sea surface temperature and salinity. Other instruments on the moorings collect wave data, such as significant wave height, period, and direction. These data are then consumed by national and regional networks to improve accuracy of weather forecasting models.
The Regional Cabled Array (RCA) consists of fiber-optic cables off the Oregon coast that provide power, bandwidth, and communication to seafloor instrumentation and moorings with instrumented profiling capabilities. A diverse array of geophysical, chemical, and biological sensors, a high-definition camera, and digital still cameras on the seafloor and mooring platforms, provide real-time information on processes operating on and below the seafloor and throughout the water column, including recording of seafloor eruptions, methane plume emissions and climate change. These data are available for community use. Since 2015, the RCA has fed data into Incorporated Research Institutions for Seismology (IRIS), the primary source for data related to earthquakes and other seismic activity. In addition, data including zooplankton sonar data, are being utilized within the Pangeo ecosystem for community visualization and access and pressure data are incorporated into NOAA’s operational tsunami forecasting system.
Helping Improve Models and Forecasting
One of the recipients of OOI data is the National Data Buoy Center (NDBC), part of the National Oceanic and Atmospheric Administration’s (NOAA) National Weather Service. NDBC maintains a data repository and website, offering a range of standardized real-time and near real-time meteorological data. Data such as wind speed and direction, air and surface water temperature, and wave height and direction are made available to the broader oceanographic and meteorological community.
“Many researchers go to NDBC for their data, “said Craig Risien, a research associate with OOI’s Endurance Array and Cyberinfrastructure Teams, who helps researchers gain access to and use OOI data. “NBDC is a huge repository of data and it’s easy to access. So there’s a low barrier for researchers and students who are looking for information about wind speed, water temperature and a slew of other data. OOI contributing to this national repository significantly increases its data reach, allowing OOI data to be used by as many people as possible. “
OOI sea surface temperature data also make their way into the operational Global Real-Time Ocean Forecast System (RTOFS) at the National Centers for Environmental Prediction (NCEP), another part of NOAA’s National Weather Service. RTOFS ingests sea surface temperature and salinity data from all available buoys into the Global Telecommunications System (GTS). OOI glider data also are pushed in near real-time to the US Integrated Ocean Observing System Glider Data Assembly Center (DAC). From there, the data goes to the GTS where it can be used by the operational modeling centers such as NCEP and the European Centre for Medium-Range Weather Forecasts.
The GTS is like a giant vacuum sucking up near real-time observations from all sorts of different platforms deployed all over the world. On a typical day, the GTS ingests more than 7,600 data points from fixed buoys alone. As a result of this vast input, researchers can go to the GTS, pull available data, and assimilate that information into any model to improve its prediction accuracy.
Advancing Forecasting of Submarine Eruptions
As the first U.S. ocean observatory to span a tectonic plate, RCA’s data are an invaluable contributor to IRIS’s collection. Since 2015, the user community has downloaded >20 Terabytes of RCA seismometer data from the IRIS repository. Fourteen different sampling locations include key sites at Axial Seamount on the Juan de Fuca mid-ocean ridge spreading center, near the toe of the Cascadia Margin and Southern Hydrate Ridge. RCA data are catalogued and available on the IRIS site, using the identifier “OO.”
[caption id="attachment_21046" align="alignleft" width="300"]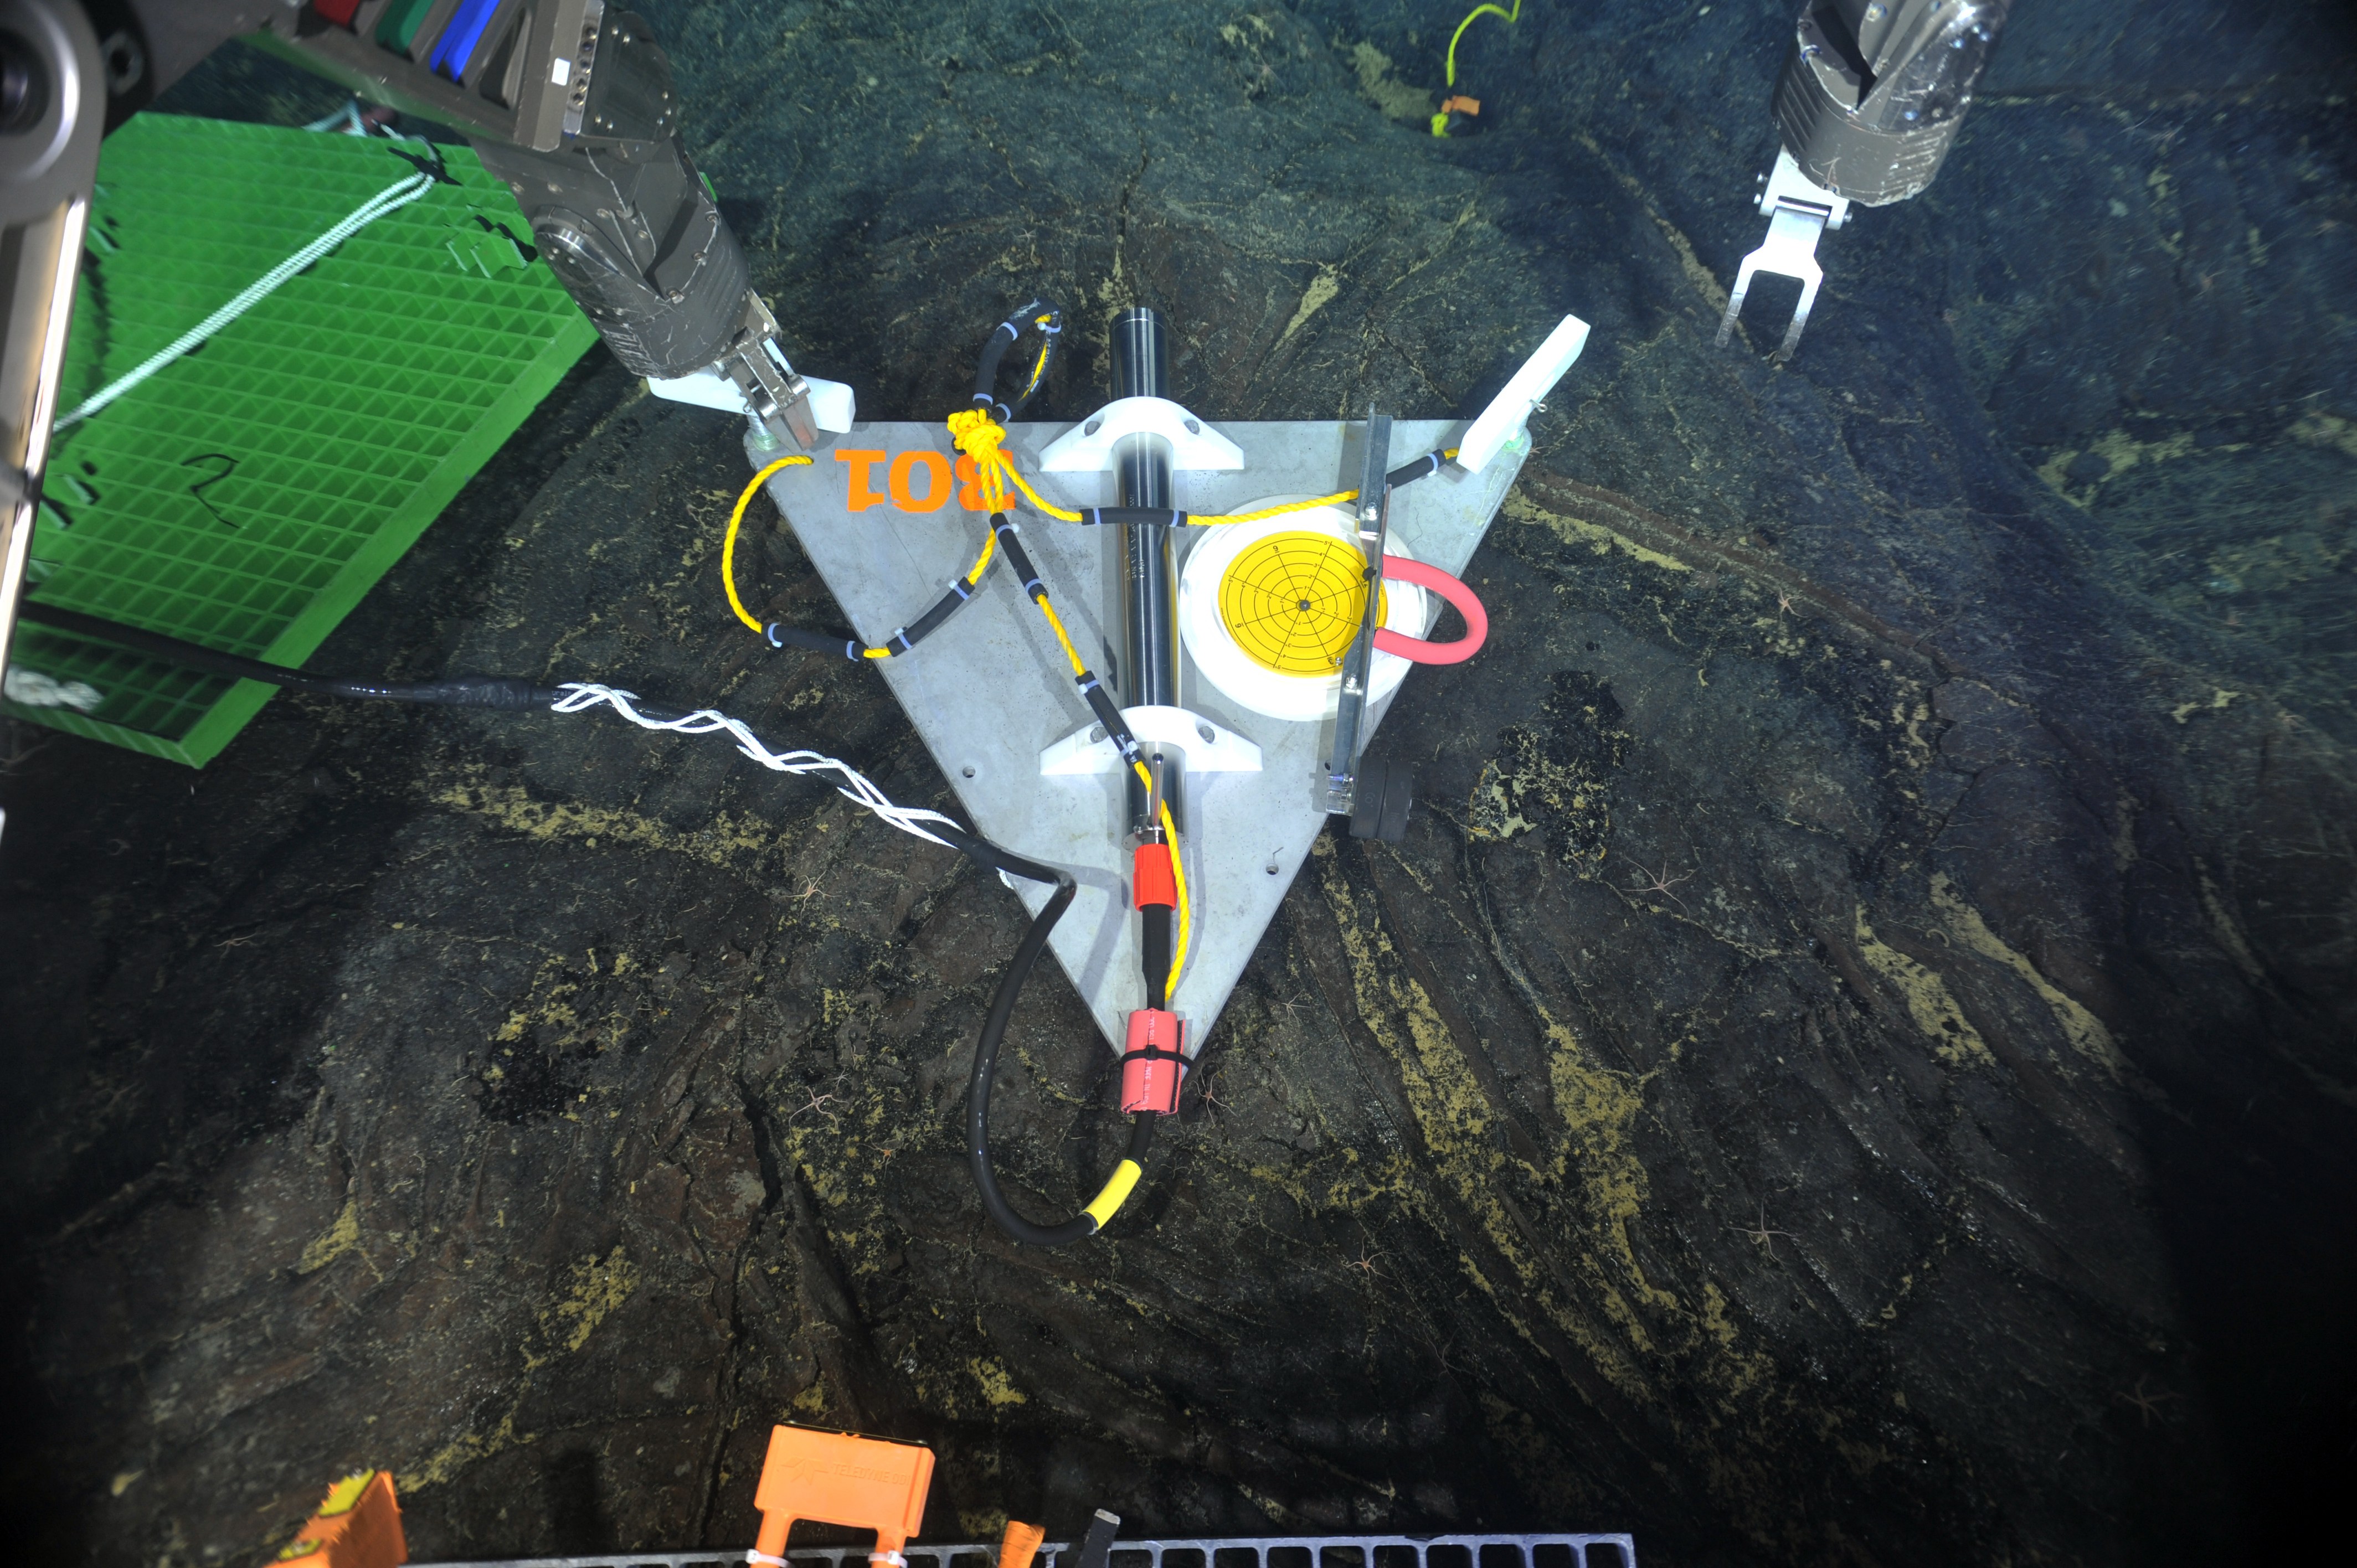 Data from short period seismometers installed at RCA’s Axial Seamount and Southern Hydrate Ridge sites are streamed live to IRIS. Credit: UW/NSF-OOI/Canadian Scientific Submersible Facility, V13.[/caption]
“RCA is a critical community resource for seismic data. Axial Seamount, for example, which erupted in 1998, April 2011, was the site of more than 8,000 earthquakes over a 24-hour period April 24, 2015 marking the start of large eruption,” explained Deb Kelley, PI of the RCA. “Being able to witness and measure seismic activity in real time is providing scientists with invaluable insights into eruption process, which along with co-registered pressure measurements is making forecasting possible of when the next eruption may occur. We are pleased to share data from this volcanically and hydrothermally active seamount so researchers the world over can use it to better understand processes happening at mid ocean ridges and advance forecasting capabilities for the first time of when a submarine eruption may occur.”
Providing Data with Regional Implications
[caption id="attachment_21047" align="alignright" width="203"]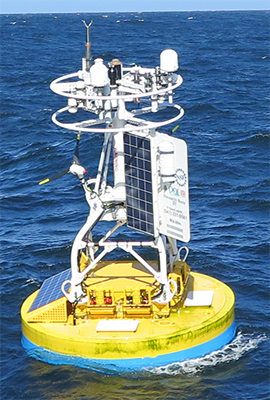 Data from Endurance Array buoy 46100 are fed into WCOFS, where they are accessible to maritime users. Credit: OSU[/caption]
OOI also provides data to regional ocean observing partners. Data from two Endurance Array buoys (46099 and 46100), for example, are fed into a four-dimensional U.S. West Coast Operational Forecast System (WCOFS), which serves the maritime user community. WCOFS generates water level, current, temperature and salinity nowcast and forecast fields four times per day. The Coastal Pioneer Array is within the future Northeastern Coast Operational Forecast System (NECOFS). Once operational, Pioneer’s observations will potentially be used for WCOFS data assimilation scenario experiments.
Coastal Endurance Array data are shared with the Northwest Association of Networked Ocean Observing Systems (NANOOS), which is part of IOOS, and the Global Ocean Acidification Observing Network (GOA-ON). Endurance data are ingested by the NANOOS Visualization System, which provides easy access to observations, forecasts, and data visualizations. Likewise, for GOA-ON, the Endurance Array provides observations useful for measuring ocean acidification.
Data from three of the Pioneer Array buoys also are part of the Mariners’ Dashboard, a new ocean information interface at the Northeastern Regional Association of Coastal Ocean Observing Systems (NERACOOS). Visitors can use the Dashboard to explore the latest conditions and forecasts from the Pioneer Inshore (44075), Central (44076), and Offshore (44077) mooring platforms, in addition to 30+ other observing platforms throughout the Northeast.
“We are working hard to distribute the OOI data widely through engagement with multiple partners, which together are helping inform science, improve weather and climate forecasts, and increase understanding of the ocean,” added Al Plueddemann, PI of the Coastal and Global Scale Nodes, which include the Pioneer, Station Papa, and Irminger Sea Arrays.
Read More
OOI Irminger Sea Data Helping Fill Critical Gap in Climate Models
Researchers at Woods Hole Oceanographic Institution (WHOI) were recently awarded a $500,000 grant from the National Oceanic and Atmospheric Administration’s (NOAA) Climate Observations and Monitoring (COM) program to develop machine learning tools to improve estimates of air-sea heat exchange in the Arctic Ocean and adjacent seas. These tools are expected to fill critical gaps in climate models, which currently show large disparities when simulating the rate of polar ice melt.
Recent advances in remote sensing technologies have provided researchers with the data they need to better understand the forces behind Arctic ice melt and the implications of that heat exchange between the ocean and the atmosphere. These real-world measurements will allow researchers to develop algorithms that will validate and improve satellite-based modeling of the Arctic and subarctic regions.
Due to the difficulty of accessing the Arctic Ocean—especially during the stormy winter months—and the complexity of measuring air-sea heat exchanges, there has previously not been enough quality data to incorporate ice melt and seasonal changes into climate models. This challenge was overcome by recent advances in long-term remote data collection at high latitudes. For the first time in 2019, an Ocean Observatories Initiative (OOI) surface buoy in the Irminger Sea collected over a year’s worth of sensor data, including icy and windy winter conditions. Located in an important area of ocean circulation, the data collected from the OOI surface buoy provides critical verification for satellite-based models.
Lisan Yu, a WHOI senior scientist and the project’s principal investigator, said a machine learning-based framework will improve the accuracy of ocean-surface forcing estimates used to model the global climate. She said it will also improve the accuracy of ice and weather forecasts in a region that is rapidly opening up to commercial exploration. WHOI Senior Scientist Al Plueddemann, who also serves as a co-principal investigator for OOI and project lead for its Coastal and Global Nodes, is a collaborator on this project.
Read the full release here.
Read MorePartnerships Expand Use of OOI Data
The OOI’s primary mission is to make its data widely available to multiple users. One way it achieves this, on a broad scale, is by establishing partnerships with other organizations that also distribute ocean observing data. For example, OOI currently partners with the Integrated Ocean Observing System (IOOS), which provides integrated ocean information in near real-time and tools and forecasts to apply the data, the National Data Buoy Center (NDBC), which maintains a network of data collecting buoys and coastal stations as part of the National Weather Service, the Global Ocean Acidification Observing Network (GOA-ON), which uses international data to document the status and progress of ocean acidification, and Incorporated Research Institutions for Seismology (IRIS), a consortium of over 120 US universities dedicated to the operation of science facilities for the acquisition, management, and distribution of seismological data.
NANOOS: Making data relevant for decision-making
NANOOS, the Northwest Association of Networked Ocean Observing Systems, which is part of IOOS, has been operational since 2003, establishing trusting, collaborative relationships with those who use and collect ocean data in the Pacific Northwest. NANOOS has been an exemplary partner in ingesting and using OOI data. Part of its success lies in advance planning. NANOOS, for example, had determined that OOI assets, in addition to achieving the scientific goals for which they were designed, could fill a data void in IOOS assets running north and south in an area between La Push, WA, and the Columbia River, well before the OOI assets came online.
[media-caption type="image" class="external" path="https://oceanobservatories.org/wp-content/uploads/2020/09/Screen-Shot-2020-09-22-at-2.25.24-PM.png" alt="Endurance Array" link="#"]OOI’s Coastal Endurance Array provides data from the north and south in an important upwelling area in the northeastern Pacific. Gliders also traverse this region, with glider data available through both the IOOS Glider Data Assembly Center and the NANOOS Visualization System. Credit: Center for Environmental Visualization, University of Washington.[/media-caption]According to Jan Newton, NANOOS executive director at the University of Washington, “One of the reasons NANOOS is so effective is that our guiding principle is to be cooperative and not compete. If the public is looking for coastal data, for example, we want to make sure they can access it and use it, rather than having them trying to sort through whether it is a product of IOOS or OOI. We operate with the philosophy of maximizing the discoverability and service of the data and OOI has been a great partner in our mission. We’ve been really happy about how this partnership has played out.”
[media-caption type="image" class="external" path="https://oceanobservatories.org/wp-content/uploads/2020/09/Regional-Cable-Array-revised-.jpg" alt="Revised RCA" link="#"]OOI’s Regional Cabled Array also contributes data in the NANOOS region from its Slope Base and the Southern Hydrate Ridge nodes. Credit: Center for Environmental Visualization, University of Washington.[/media-caption]NANOOS has made a huge effort on its data visualization capabilities, so people can not only find data, but look at it in a relative way to use it for forecasting, modeling, and solving real-world problems. OOI data are integral in helping support some of these visualization and modeling efforts, which commonly play a role in situations facing a wide cross-section of society.
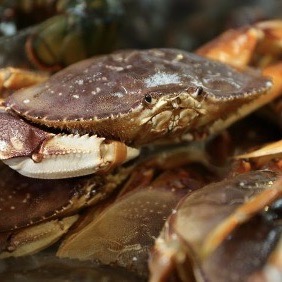
An example of this applicability played out in improved understanding of hypoxia (oxygen-deficient conditions) off the coast of Oregon, which had resulted in mass mortality events of hypoxia-intolerant species of invertebrates and fish, in particular, Dungeness crabs. Allowing access through NANOOS to near real-time oxygen data from OOI assets has allowed the managers and fishers to come up with some plausible solutions to maintaining this valuable resource. The Dungeness crab fishery is the most valuable single-species fishery on the U.S. West Coast, with landed values up to $250 million per year, and plays an enormous cultural role in the lives of tribal communities in the region, as well.
[media-caption type="image" class="external" path="https://oceanobservatories.org/wp-content/uploads/2020/09/Dungeness-Crab.jpg" alt="Dungeness Crab" link="#"]OOI oxygen data have helped resource managers and fishers maintain the valuable Dungeness crab fishery, which is the most valuable single-species fishery on the U.S. West Coast.[/media-caption]Researcher Samantha Siedlecki, University of Connecticut, reports that in late June of 2018, for example, fishers in the region were pulling up dead crabs in pots without knowing the cause. Scientists accessed near real-time OOI observations through the NANOOS data portal and found that the Washington Inshore Surface Mooring of the Coastal Endurance Array (EA) had measured hypoxia from June 7th onwards. So, the data confirmed real-life conditions and explained the crab mortalities.
This is important because such occurrences are helping to confirm models and enhance forecasting to better manage these events by providing guidance to fishers and resource managers. In this instance, the forecast indicates what regions will likely require reduced time for crabs to remain “soaking,” caged in the environment during hypoxia events, to ensure crabs are captured alive, and also aid in spatial management of the fishery itself. OOI data will play a role in continual improvements in forecasting in this region and the fishery by providing data during winter months, ensuring historical data are available and quality controlled for use in forecasting, and continuing to serve data in near real-time.
Adds Newton, “I can’t tell you how many OOI and other PIs come up and tell me how they love that their data are having a connection to real world problems and solutions. It makes their research go farther with greater impact by being part of this NANOOS network.”
Explains Craig Risien, Coastal Endurance Array senior technician at Oregon State University, “OOI is collecting an incredible wealth of data, offering a treasure chest of material to write papers, write proposals, include in posters, and now it is being used in practical ways for finding scientific solutions to environmental problems. Every time we look at the data, there’s a new story to tell. We always find something new, something interesting, and encourage everyone to have a look and experience the same usefulness and excitement about OOI data.”
Sharing OOI data
The OOI is in talks with the IOOS regions serving the Northeast Atlantic and the Mid-Atlantic to see how OOI data might enhance their networks, as well. The OOI also has been providing data to the National Data Buoy Center since 2016, supplementing the data collected by NDBC’s 90 buoys and 60 Coastal Marine Automated Network stations, which collectively provide critical data on unfolding weather conditions. And, the OOI has been providing data to Global Ocean Acidification Observing Network (GOA-ON), since mid-2019, ground-truthing on site conditions in real to near real-time, which is critical to understanding conditions contributing to ocean acidification and improving modeling capabilities to determine when it might occur. OOI’s Regional Cabled Array has been providing seismological, pressure and hydrophone data to Incorporated Research Institutions for Seismology (IRIS) since 2014, providing a wealth of data from Axial Seamount and on the Cascadia Margin. For example, on April 24, 2015 a seismic crisis initiated at the summit of Axial Seamount with >8,000 earthquakes occurring in 24 hrs, marking the start of the eruption. Starting at 08:01 that same day, the network recorded ~ 37,000 impulsive events delineating underwater explosions, many of which were associated with the formation of a 127 meter thick lava flow on the northern rift.
Data examples
If you would like to test drive some of the OOI data in NANOOS, NDBC, and GOA-ON, here are some examples below:
IOOS
· OOI data in the NANOOS Visualization System (NVS)
NDBC
· Coastal Endurance Array data (Stations 46097, 46098, 46099, 46100)
· Coastal Pioneer Array data (Stations 44075, 44076, 44077)
· Global Irminger Array data (Station 44078)
GOA-ON
· Coastal Endurance Array data
IRIS
· Regional Cabled Array (While searching within IRIS for OOI data, use the two-letter IRIS network designator “OO.”)
Read More
A Collaborative Month in the Irminger Sea
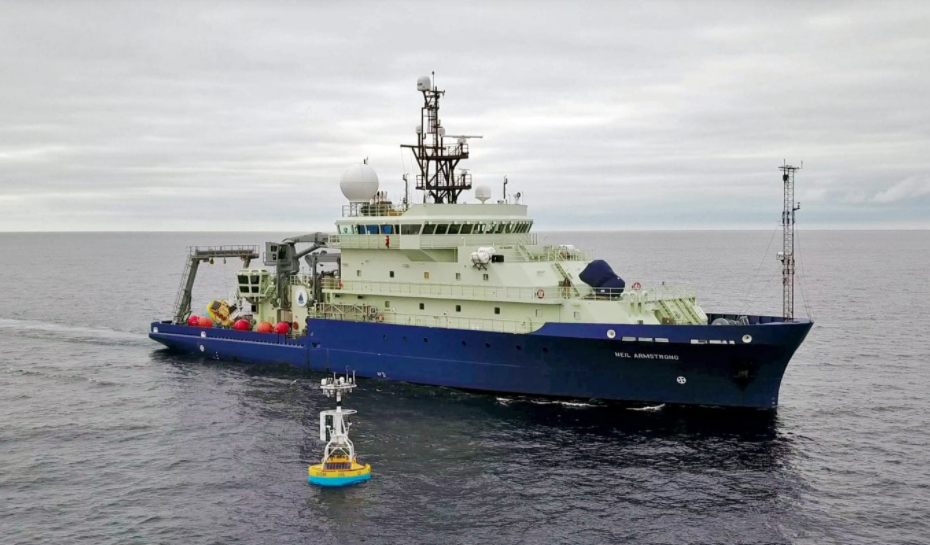
A team of 10 Woods Hole Oceanographic Institution scientists, who spent the month of August aboard the RV Neil Armstrong, arrived at home port in Woods Hole on 4 September, having successfully skirted Hurricane Laura as she headed in their direction. The bumpy ride home capped the successful deployment of all OOI Irminger Sea Array moorings in sometimes turbulent seas.
While onsite at the array, the team successfully met all of its mission objectives by recovering and deploying four moorings and deploying two gliders. One glider transits the individual moorings, which are spaced approximately 20 km apart, while the second glider samples the upper 200-meters of the ocean above the centrally located hybrid profiler mooring, which measures the remainder of the 2800-m water column. A third glider was recovered soon after deployment because it had a microleak. The team also conducted CTD casts at each of the moorings, which measure onsite temperature, salinity, and oxygen conditions and validate data being collected and sent to shore by the array.
“The Irminger Sea array presents both unique opportunities and challenges for reporting ocean data,“ explained Sebastien Bigorre, who served as chief scientist on the Irminger Seven expedition. “It is located in a remote area of the North Atlantic with high wind and large surface waves, which present operational challenges. The area is also of great interest for scientists and society because of the intense exchange of energy and gases between the atmosphere and the ocean. The ocean there captures heat and carbon dioxide from the atmosphere, thus it is an important component of the climate system. It is also a region of high biological productivity, making it an important fishery. Recent studies have shown that the data collected at the Irminger array are essential to correctly describe the ocean circulation of the North Atlantic.”
It is an eight-day transit from Woods Hole to the Irminger Sea Array and another eight-day transit to return to home port. To maximize the use of ship time, the Irminger Sea Array Team shared ship space and mission time with scientists from OSNAP (Overturning of the Subpolar North Atlantic Program). OSNAP is seeking to provide a continuous record of the horizontal transport of heat, mass, and freshwater in the subpolar North Atlantic, and is complemented by the much longer-term records of water-column properties and air-sea transfer of momentum, heat, and moisture that are provided by the OOI Irminger Sea Array. Once on site, the expedition started with deployment of OOI moorings and gliders, switched its focus to recovery and re-deployment of OSNAP moorings, before finishing with the recovery of the previous year OOI Irminger Sea moorings.
“Our partnership with OSNAP is an example of how we try to maximize our resources for scientific research, from cruise planning, to operations at sea. During transits, we test and triple check our equipment to ensure that comes deployment day, everything goes as smooth as possible. On site, we coordinate operations to accommodate for weather conditions or to optimize shared equipment or personnel. When there is a lull in scientific activities, we plan for the ship’s instrumentation to collect data that is relevant to our scientific objectives, so every hour of the cruise is used to its full potential,” added Bigorre.
The following images show the many tasks undertaken during the month-long expedition:
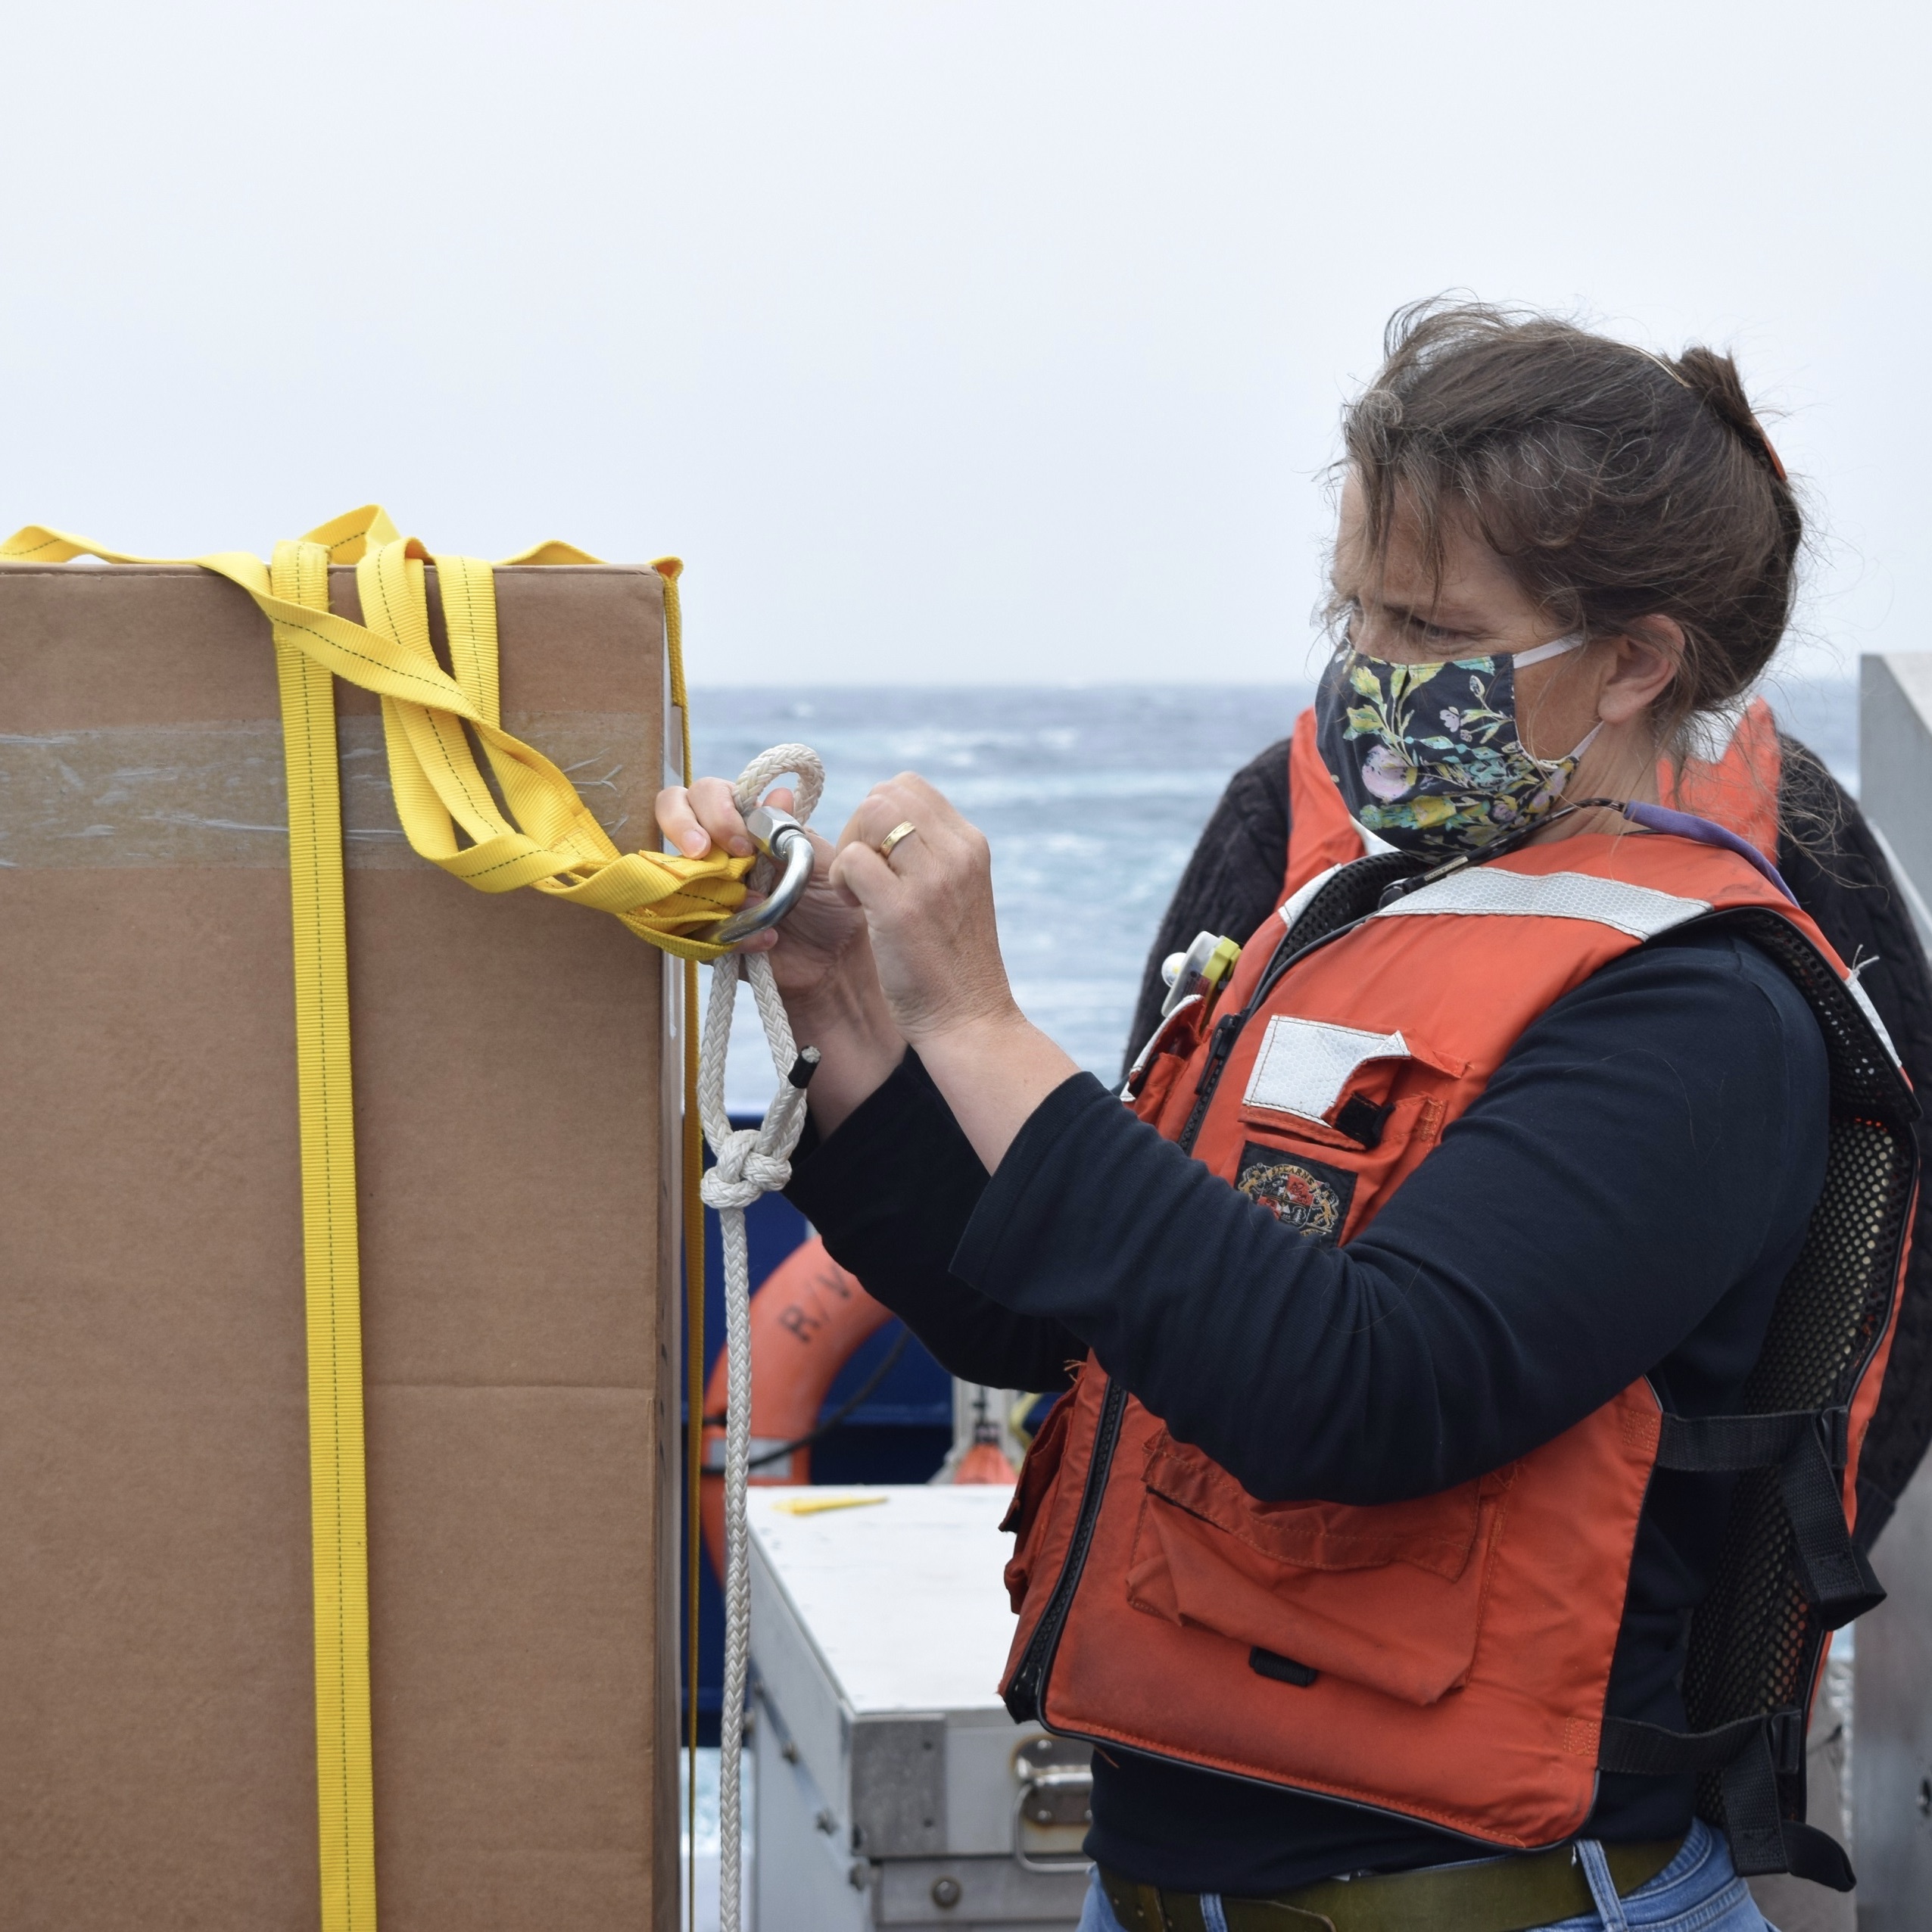
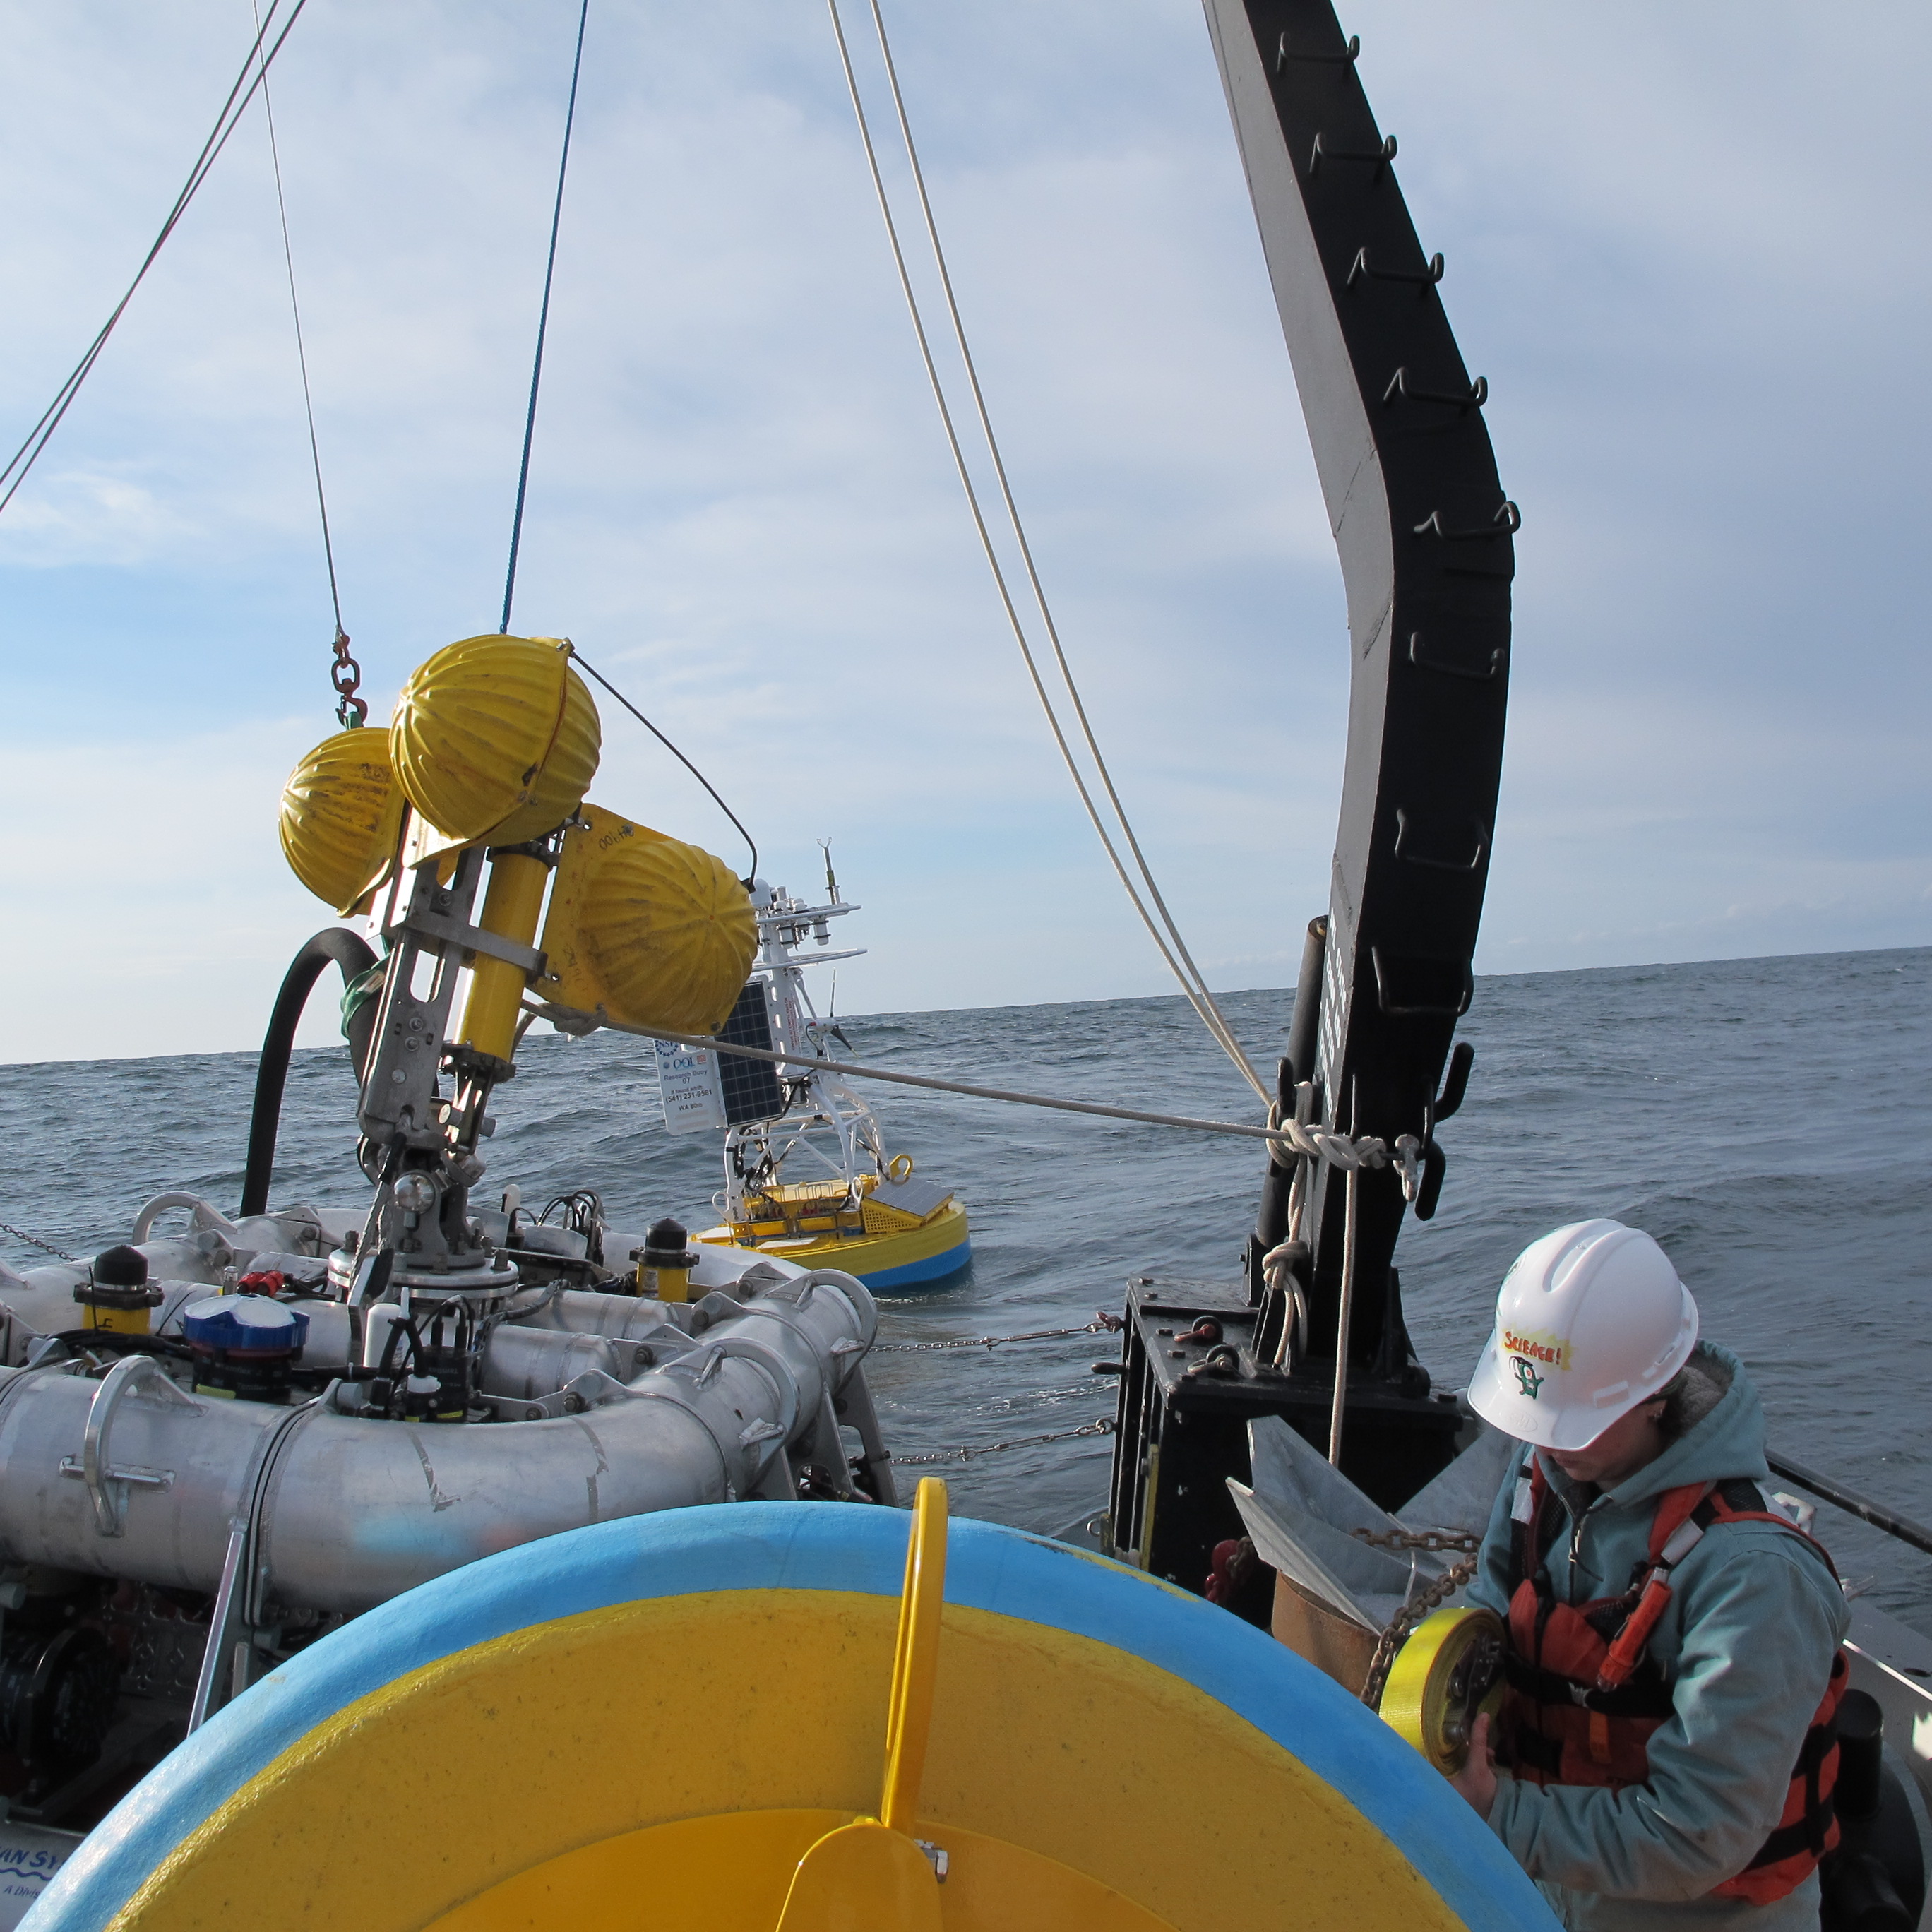
[media-caption type="image" class="external" path="https://oceanobservatories.org/wp-content/uploads/2020/09/IMG_4208-scaled.jpg" alt="Irminger 7 masks" link="#"]OOI Irminger Sea cruise participants James Kuo (foreground), Jennifer Batryn, and Collin Dobson demonstrate proper social distancing and PPE use on the deck of the R/V Neil Armstrong during departure from the Woods Hole Oceanographic Institution (WHOI) dock Sunday 9 August. Photo credit: Rebecca Travis©Woods Hole Oceanographic Institution.[/media-caption] [media-caption type="image" class="external" path="https://oceanobservatories.org/wp-content/uploads/2020/09/IMG_4215-scaled.jpg" alt="Armstrong awaiting departure" link="#"]The R/V Neil Armstrong is loaded with crew and equipment and ready to depart for the month-long expedition to the Irminger Sea Array. Photo credit: Rebecca Travis©Woods Hole Oceanographic Institution.[/media-caption] [media-caption type="image" class="external" path="https://oceanobservatories.org/wp-content/uploads/2020/09/Screen-Shot-2020-09-14-at-4.56.05-PM.png" alt="Drone overhead" link="#"]A place for everything, everything in its place. Aerial view of the R/V Neil Armstrong deck with equipment loaded for the OOI Irminger Sea Array service cruise. Photo credit: James Kuo©Woods Hole Oceanographic Institution.[/media-caption] [media-caption type="image" class="external" path="https://oceanobservatories.org/wp-content/uploads/2020/09/Glider-with-mask-scaled.jpg" alt="Glider with mask" link="#"]Even the gliders took precautions for the Irminger Sea Expedition! (The tape was removed before deployment). Photo credit: Diana Wickman©Woods Hole Oceanographic Institution .[/media-caption] [media-caption type="image" class="external" path="https://oceanobservatories.org/wp-content/uploads/2020/09/IMG_2081-scaled.jpg" alt="Off stern" link="#"]Global Surface Mooring loaded on the R/V Neil Armstrong deck. It replaced a mooring recovered at the site. Photo credit: James Kuo©Woods Hole Oceanographic Institution.[/media-caption] [media-caption type="image" class="external" path="https://oceanobservatories.org/wp-content/uploads/2020/09/IR7_Dobson_lab-scaled.jpg" alt="Collin in lab" link="#"]Engineer Collin Dobson performs function checks on OOI gliders in the lab of the R/V Neil Armstrong during the transit out to the OOI Irminger Sea array. Photo credit: Jennifer Batryn©Woods Hole Oceanographic Institution.[/media-caption] [media-caption type="image" class="external" path="https://oceanobservatories.org/wp-content/uploads/2020/09/IR7_glider_prep-scaled.jpg" alt="Glider prep" link="#"]Two OOI gliders sit in the lab of the R/V Neil Armstrong during the transit out to the Irminger Sea array. The location of the glider oxygen sensors (blue housings forward of the tail fin) was modified so the sensor is exposed to the air when the glider surfaces. Photo credit:Jennifer Batryn©Woods Hole Oceanographic Institution.[/media-caption] [media-caption type="image" class="external" path="https://oceanobservatories.org/wp-content/uploads/2020/09/20200817_101902.cam3_.jpg" alt="Buoy camera" link="#"]Eyes at sea. This image was captured during the Irminger Global Surface Mooring deployment 17 August 2020 by a camera on the buoy shortly after the buoy was lowered into the water. The camera normally helps operators monitor ice buildup and storm conditions, but on that day it turned its lens on the action aboard the R/V Neil Armstrong. Photo credit: Buoy camera©Woods Hole Oceanographic Institution.[/media-caption] [media-caption type="image" class="external" path="https://oceanobservatories.org/wp-content/uploads/2020/09/SUMOsplice_NicoLlanos_20200811.jpg" alt="Nico splicing" link="#"]Nico Llanos splices lines together, in preparation for the OOI Global Surface Mooring deployment. The surface mooring will be deployed in almost 3,000 m (1.8 mile) of water off of Greenland. Together, the nylon and Colmega add up to almost one mile of rope line, and provide the bottom part of the mooring above its anchor. Photo credit: Heather Furey©Woods Hole Oceanographic Institution .[/media-caption] [media-caption type="image" class="external" path="https://oceanobservatories.org/wp-content/uploads/2020/09/whiteboard_AR46_20200811-1-scaled.jpg" alt="Whiteboard" link="#"]Just like on land, a whiteboard serves as a notice of ongoing and completed activities aboard the R/V Neil Armstrong during the Summer 2020 Irminger Sea month-long expedition. Photo credit: Heather Furey©Woods Hole Oceanographic Institution .[/media-caption] [media-caption type="image" class="external" path="https://oceanobservatories.org/wp-content/uploads/2020/09/IR7_Argo_float.jpeg" alt="Argo float" link="#"]Research Specialist Heather Furey prepares an Argo float for deployment off the stern of the R/V Neil Armstrong. The yellow straps are used to deploy the float while it is still in the box. The cardboard biodegrades in the water and releases the float. Photo credit: Jennifer Batryn©Woods Hole Oceanographic Institution.[/media-caption] [media-caption type="image" class="external" path="https://oceanobservatories.org/wp-content/uploads/2020/09/DSC_0403-scaled.jpg" alt="James Kuo" link="#"]OOI Engineer James Kuo checks the inductive communications on the Irminger Sea Flanking Mooring B during deployment. Most of the instruments on this subsurface mooring transmit data to the mooring controller inductively. The data is then sent acoustically to OOI Gliders which transmit the data to shore via satellite. Photo Credit: Jennifer Batryn©Woods Hole Oceanographic Institution.[/media-caption] [media-caption type="image" class="external" path="https://oceanobservatories.org/wp-content/uploads/2020/09/DSC_0908-1-scaled.jpg" alt="McClane Profiler" link="#"]The OOI team at the Irminger Sea Array deploying the Profiler Mooring. The yellow McLane Moored Profiler with a suite of science instruments is carefully lowered into the water. It will measure water properties including temperature, salinity, fluorescence, dissolved oxygen and water velocity. Photo credit: Jennifer Batryn©Woods Hole Oceanographic Institution.[/media-caption] [media-caption type="image" class="external" path="https://oceanobservatories.org/wp-content/uploads/2020/09/DSC_0012-scaled.jpg" alt="Profiler off stern" link="#"]The OOI Irminger Sea Hybrid Profiler Mooring is deployed top-first and trails behind the ship. Once the ship is at the desired location, the anchor is slid off the back deck, making quite a splash as it falls to the seafloor, pulling the mooring into place. Photo credit: Jennifer Batryn©Woods Hole Oceanographic Institution.[/media-caption] [media-caption type="image" class="external" path="https://oceanobservatories.org/wp-content/uploads/2020/09/Irminger-Sea-Posting--scaled.jpg" alt="Group shot" link="#"]The OOI and OSNAP science team poses on the back deck of the R/V Neil Armstrong on 27 August. 2020, after completing operations at the Irminger Sea Array. Using the last hours of good weather, equipment was secured before the eight-day voyage back to Woods Hole. Photo: Michael Sessa©Woods Hole Oceanographic Institution.[/media-caption] [media-caption type="image" class="external" path="https://oceanobservatories.org/wp-content/uploads/2020/09/northernlights_dobson-scaled.jpeg" alt="Northern lights" link="#"]One of the advantages of going to the OOI Irminger Sea Array is the opportunity to see the northern lights (Aurora borealis).This photo was taken as the team transited home through the Labrador Sea. What a great reward for all of the hard work put in to have a successful cruise! Photo credit: Collin Dobson©Woods Hole Oceanographic Institution.[/media-caption] Read MoreIrminger Sea Intermediate Water Formation and Transport
Adapted and condensed by OOI from Le Bras et al., 2020, doi:/10.1029/2019GL085989.
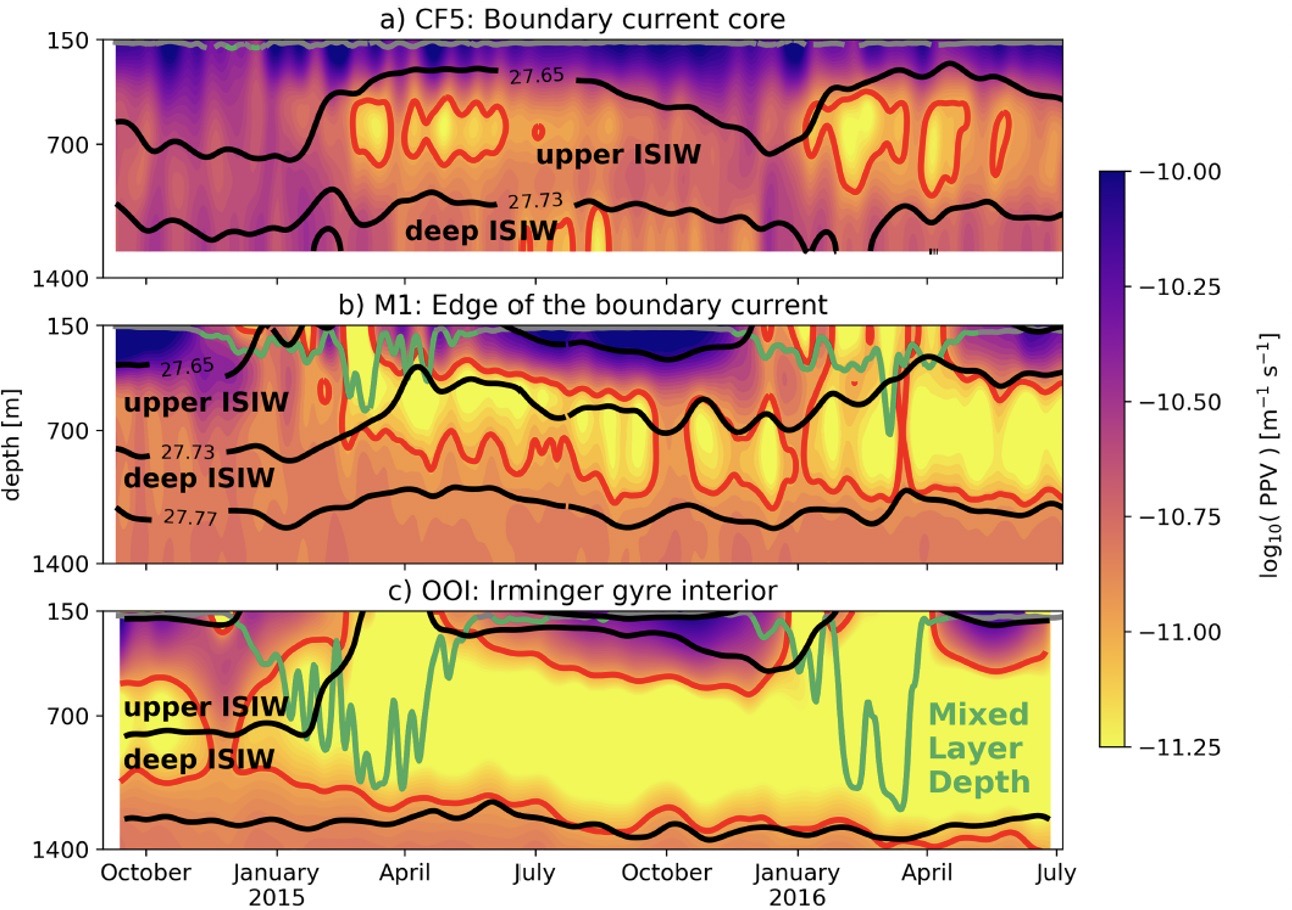
[caption id="attachment_18947" align="aligncenter" width="640"] Figure 19. Planetary potential vorticity (PPV) at (a) OSNAP mooring CF5, within the Irminger Sea boundary current core (b) OSNAP mooring M1, at the edge of the boundary current and (c) OOI flanking mooring (FLMA) and Surface Mooring within the Irminger Sea gyre. From Le Bras et al. (2020).[/caption]
A two-year record from moorings in the Irminger Sea allowed researchers (Le Bras et al., 2020) to investigate both deep convection and transport of water masses associated with the Atlantic overturning circulation. Using mooring data from the OOI Irminger Sea Array and the Overturning in the Subpolar North Atlantic (OSNAP) array, the authors were able to identify two types of Irminger Sea Intermediate Water (ISIW) formed by deep convection. Upper ISIW is found near the edge of the Irminger Sea western boundary current, whereas Deep ISIW is formed in the basin interior. Water masses were diagnosed using temperature-salinity properties and the planetary potential vorticity (PPV). Figure 19 shows PPV for three different locations, in the boundary current, at its edge, and in the Irminger Sea gyre. Black lines in the figure indicate the isopycnals that bound upper and deep ISIW as defined by the authors, the red contours enclose water with low PPV (indicative of convection) and the green lines indicate the mixed layer depth.
Seasonal pulses of low PPV water in the boundary current occurring below the mixed layer (Figure 19a) suggest subduction from a non-local source offshore. In contrast, low PPV water in the gyre interior is accompanied by a deep winter mixed layer and appears related to local convection. Further analysis by the authors indicates that waters formed by convection in the interior gyre are entrained into the boundary current within a few months of formation. Importantly, it appears that eddy dynamics are responsible for this transport of ventilated water from the interior to the boundary, and that the upper ISIW in the boundary current is a significant component of the Atlantic overturning circulation.
Read MoreScience Team Heads to Blustery Irminger Sea
Ten scientists from Woods Hole Oceanographic Institution (WHOI) will board the R/V Neil Armstrong on 8 August 2020 for about a month-long expedition to OOI’s Irminger Sea Array. The journey includes an eight-day transit to reach the array, where they will recover and replace ocean observing equipment that has ridden out arduous conditions in a region known for intense winter wind events (peak speeds of 50-55 knots).
[media-caption path ="https://oceanobservatories.org/wp-content/uploads/2020/08/Irminger-Deck-Plan-small-scaled.jpg" link="#" title="Iminger Deck] Aerial view of the R/VNeil Armstrong deck with equipment loaded for an OOI Irminger Sea Array service cruise. Credit: Drone footage by James Kuo © Woods Hole Oceanographic Institution[/media-caption]Iceland is separated from the east coast of Greenland by the Denmark Strait, roughly a distance of some 250 miles. The Irminger Sea is south of the strait, stretching from Iceland down to the latitude of Cape Farewell at Greenland’s southern tip. This region is important to the Atlantic Ocean circulation and sensitive to global climate change.
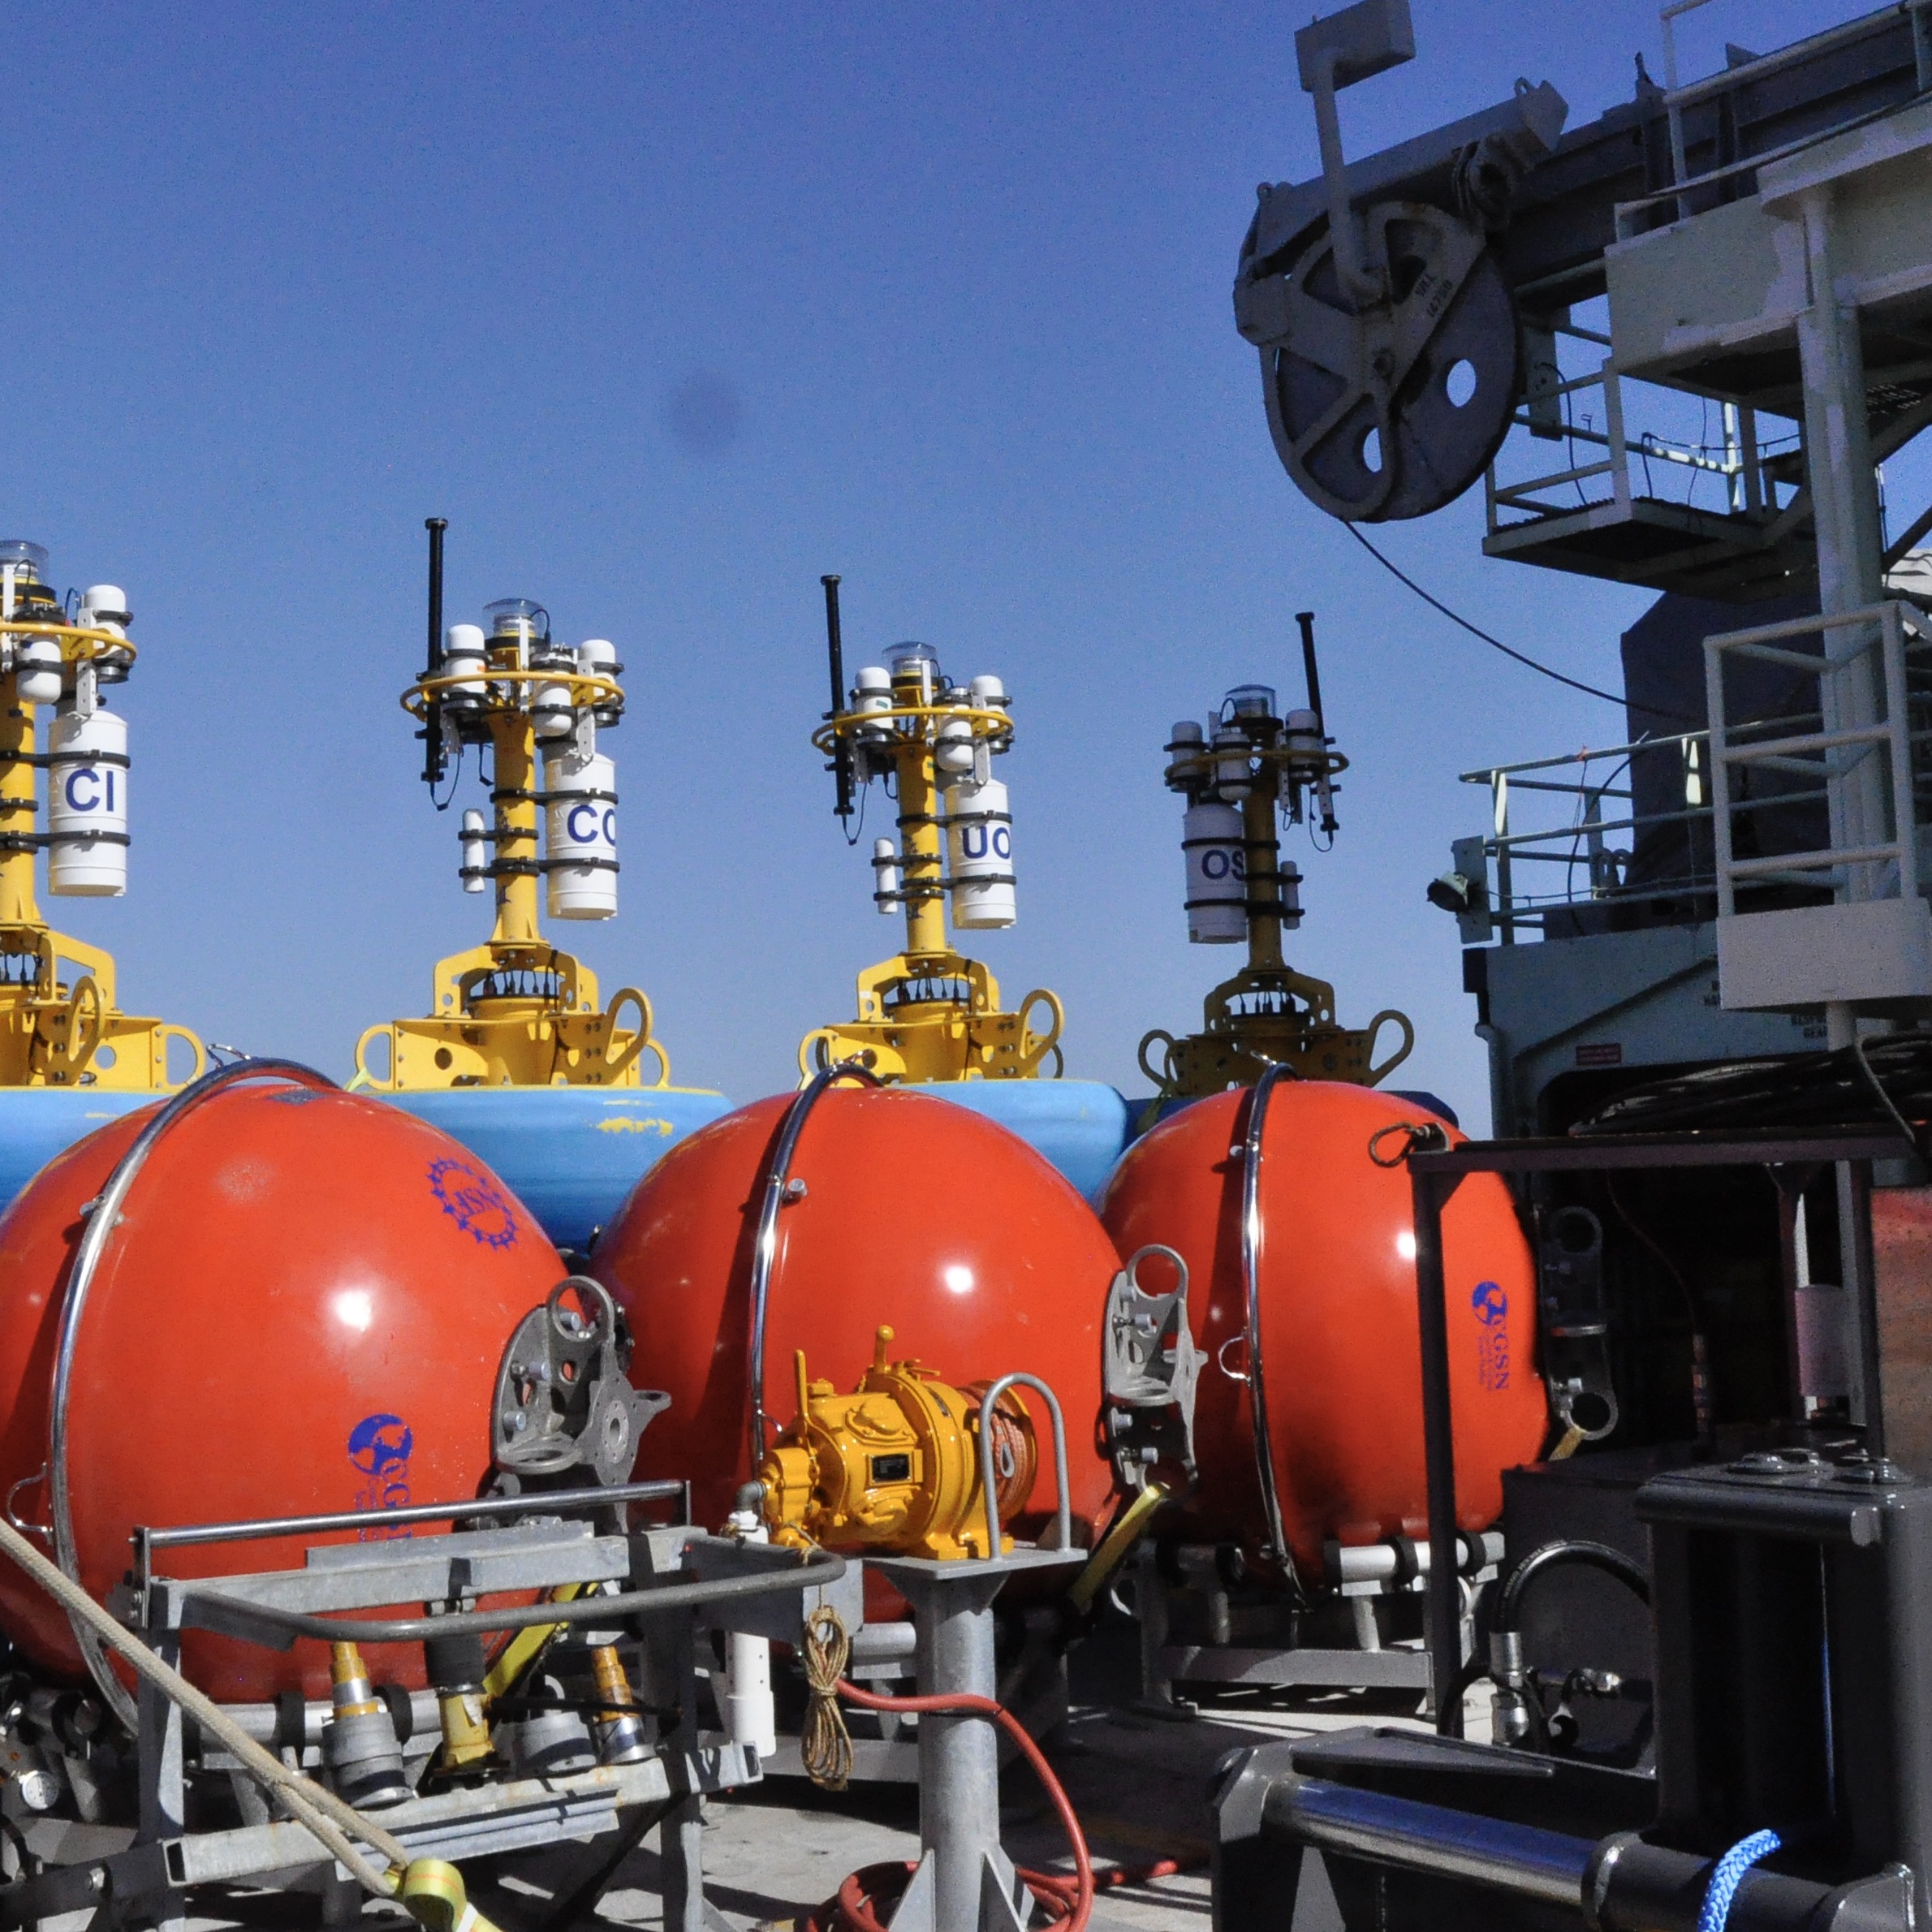
Supported by wind power and solar cells, the Irminger Sea Array consists of moorings that serve as home for sensors that measure air-sea fluxes of heat, moisture and momentum, and physical, biological and chemical properties throughout the water column. The observations of the moorings are enhanced by open-ocean gliders that sample within and around the triangular array. The subsurface mooring data is also collected by the gliders via acoustic modem. The gliders then relay the collected data, glider sampling and mooring data, to shore via satellite telemetry each time they surface. Gliders also sample the upper water column near the Apex Profiler Mooring to complement the moored profiler data and extend coverage to the air-sea interface.
This month-long expedition is the seventh time the OOI team has traveled to the array, specifically to replace and repair equipment that is vital to maintaining a continuous flow of data from this important site.
“This is a difficult region to sustain surface observations, yet such observations are critical to improving our understanding of air-sea exchanges and deep convection that drives the Atlantic overturning circulation” said Al Plueddemann, project scientist for the OOI Coastal and Global Scale Nodes (CGSN).
WHOI Research Scientist Sebastien Bigorre will serve as the chief scientist for the expedition.
COVID Complications
The scientific party went into a 14-day quarantine on 21 July to ensure that everyone could safely board the ship. They were tested for COVID-19 prior to quarantine and will be tested again prior to departure. Masks and social distancing will be practiced onboard until another two-week period of health is achieved. At that point, mask wearing may be loosened as the scientific team and crew members will, in effect, be their own social bubble as they live, work, and share the space of the 238 foot-long vessel.
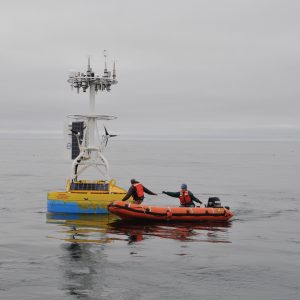
[media-caption path="https://oceanobservatories.org/wp-content/uploads/2020/08/DSC_0016_allison-scaled.jpeg" link="#" title="crew deploys a near surface instrument frame to the array"]During a past expedition to the Irminger Sea Array, the crew deploys a near surface instrument frame to the array. Credit: Alison Heater © Woods Hole Oceanographic Institution[/media-caption]Explained Derek Buffitt, program manager for the Coastal and Global Scale Nodes, operated from Woods Hole Oceanographic Institution, which includes oversight of the Irminger Sea Array, “COVID-19 created plenty of new logistical challenges for an expedition of this length and distance. We had to address contingencies such as what to do if someone presented COVID symptoms while at sea. WHOI’s marine operations office, working with agents and government representatives, confirmed health and safety protocols within the foreign ports along the planned vessel track. This was to ensure our personnel could receive the care needed in an emergency and in a timely manner.”
Such contingencies were necessary steps, in addition to many months of preparation, to ensure the equipment to be deployed is ready, tested, and packaged for transporting to the ship.
Watch this space, and social media, as we follow along on this important expedition.
Read More2020 Frontiers in Ocean Sciences Symposium
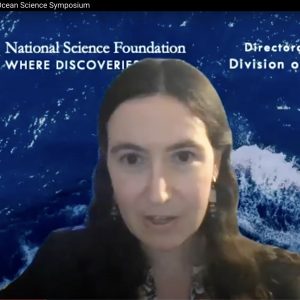
Assistant Professor Hilary I. Palevsky, Boston College, Department of Earth and Environment, was a presenter at the National Science Foundation’s Geosciences Directorate Division of Ocean Sciences 2020 Frontiers in Ocean Sciences Symposium, which was held virtually on 18 June 2020. In her presentation, New Insights into the Ocean Carbon Cycle for Novel Platforms and Partnerships, Palevsky told of ways she has used and plans to use OOI data from the Irminger Sea Array to advance understanding of the global biological pump. Watch her presentation, beginning at 56:54.
Read MoreUNOLS Extends Guidance to Suspend Cruises through 1 July 2020
The University-National Oceanographic Laboratory System (UNOLS), which coordinates oceanographic ships’ schedules, recommended on 17 March 2020 that cruise activities be paused for 30 days due to the COVID-19 pandemic. On 30 March UNOLS extended its guidance to suspend research cruises to July 1 2020. This action is designed to protect the health and safety of the crews and scientific parties.
The planned spring operation and maintenance (O&M) cruise to the Endurance Array in March was affected by the original 30-day guidance. The upcoming O&M cruises for the Pioneer, Irminger, and Papa Arrays aboard R/V Neil Armstrong and R/V Sikuliaq are impacted by this latest guidance.
The OOI is working with UNOLS and ship operators to find potential opportunities to complete the scheduled cruises and conduct needed maintenance on the arrays. In the meantime, there’s been no interruption in OOI data. OOI data continue to be collected and made available for use by the scientific and educational communities.
Read MoreFifteen Findings in 15 minutes
“Just like lightning,” in one-minute presentations, 15 scientists shared amazing ways they are using OOI data in scientific investigations and in the classroom. This round of lightning talks capped the Ocean Observatories Initiative Facility Board’s (OOIFB) Town Hall at the 2020 Ocean Sciences Meeting on 20 February, demonstrating the multiple and creative ways OOI data are being used to answer key science questions in a changing environment.
The presentations ranged from how students are using real-life and real-time OOI data to advance their understanding of scientific principles to how researchers are using OOI data to identify the presence of marine life by sound to how modelers are making OOI data more accessible and useable.
“We were simply thrilled by the depth, breadth, and range of applications of OOI data shown during this lightning round,” Kendra Daly, chair of the OOIFB. “We were pleased so many presenters were willing to accept the challenge. This enthusiastic response clearly shows that OOI data are being used to help answer important science questions.”
Brief summaries of the talks are presented below.
Advancing science
Isabela Le Bras, Scripps Institution of Oceanography, reported on a recent article in Geophysical Research Letters, where she and her colleagues describe how they used data from the Irminger Sea Array moorings (2014–2016) to identify two water masses formed by convection and showing that they have different rates of export in the western boundary current. Upper Irminger Sea Intermediate Water appears to form near the boundary current and is exported rapidly within three months of its formation. Deep Irminger Sea Intermediate Water forms in the basin interior and is exported on longer time scales. The subduction of these waters into the boundary current is consistent with an eddy transport mechanism. The eddy transport process is more effective for the waters cooled near the boundary current, implying that cooling near boundary currents may be more important for the climate than has been appreciated to date.
Since 2017, Clare Reimers and Kristen Fogaren, Oregon State University, have been working to assess seasonal variability in benthic oxygen consumption and the contribution of benthic respiration to the development of hypoxic conditions in the northern California Current, using time series data from the OOI Endurance Array. Reimers and Fogaren measured benthic oxygen consumption rates using in situ eddy covariation techniques and ex situ core incubations, during a series of ten cruises that allowed sampling near the Endurance Oregon Shelf and Inshore stations, in all seasons. During these cruises, the researchers used real-time data provided by the Endurance Array to optimize the settings for their eddy covariance deployments. They are now examining property-relationships in discrete bottom water samples collected during the cruises and using data from OOI assets to help separate influences of mixing and biochemical processes in the water column and sediments. The researchers are also synthesizing benthic flux measurements and placing these rates in the context of cross-shelf glider measurements and benthic node time series.
Adrienne Silver, University of Massachusetts Dartmouth provided details about how she is using Pioneer Array data to learn more about the influence of warm core rings on Shelf break circulation. Results from a 40-year Warm Core Ring census show a regime shift in warm core ring formation at 2000, with the number of rings doubling from an average of 18 rings per year (during 1980-1999) to 33 rings per year (during 2000-2019). This regime shift creates a large increase in the amount of warm salty water being transported northward toward the shelf from the Gulf Stream. The preferred pathway of these rings, or the Ring Corridor seem to indicate their proximity to the shelf break and the Pioneer array during their lifetime. The goal of Silver’s project is to understand how these warm core rings affect the shelf break exchange while traveling along the shelf. A large focus of the study will be on the salinity intrusion events which might be sourced from these warm core rings.
Liz Ferguson, CEO and founder of Ocean Science Analytics, is using data from OOI’s Coastal Endurance and Regional Cabled Arrays to determine the variables that are most useful for assessing the ecosystem of this region and obtaining baseline information on marine mammal acoustic presence for use in monitoring. Using long term physical and biological data provided by these arrays, Ferguson is assessing long-standing shifts in the ecology of this coastal and offshore environment by associating physical oceanographic variables with the vocal presence of marine mammals using the broadband hydrophone data. Temporal changes in the occurrence of marine mammal species such as killer whales, sperm whales and dolphins can be used as an indicator of ecosystem shifts over time. She is analyzing passive acoustic data provided by the OOI arrays to determine the presence of vocally active marine mammal species, identify their spatial and temporal use of these sites, and combining this information with the physical oceanographic variables to assess the ecological characteristics associated with marine mammal occurrence.
Sam Urmy of the Monterey Bay Aquarium Research Institute (MBARI) also is using OOI acoustical data in his research. Using an upward-looking echosounder and a high-frequency hydrophone at MBARI’s Monterey Accelerated Research System, Urmy showed how small animals in the epipelagic and mesopelagic altered their behavior in response to predators. These responses included abrupt dives during bouts of foraging by dolphins, changes in depth to avoid predatory fish schools, and dramatic alterations to daily vertical migratory behavior. Continual observations of the mesopelagic with active and passive acoustics are revealing several dynamic predator-prey interactions in an ecosystem that is typically thought of as relatively slow and static.
Veronica Tamsitt of the University of New South Wales used the OOI’s Southern Ocean mooring and the Southern Ocean Flux Site (SOFS, in the Southeast Indian) to study the Sub Antarctic Mode water (SAMW) formation. Tamsitt’s and her colleagues findings were reported in the Journal of Climate in March 2020. Using data from the two mooring locations, the researchers were able to compare and contrast characteristics and variability of air-sea heat fluxes, mixed-layer depths, and SAMW formation. The researchers found that inter mixed-layer depth anomalies tended to be intermittent at the two moorings, where anomalously deep mixed layers were associated with anomalous advection of cold air from the south, and conversely shallow mixed layers correspond to warm air from the north. Both the winter heat flux and mixed-layer depth anomalies, however, showed a complex spatial pattern, with both positive and negative anomalies in both the Indian and Pacific basins that Tasmitt and colleagues relate to the leading modes of climate variability in the Southern Ocean.
Editor’s note: The Southern Ocean Array was decommissioned in January 2020. Its data, however, are still available for use by researchers, students, and the public.
Bringing OOI data into the classroom
Sage Lichtenwalner, Department of Marine and Coastal Sciences at Rutgers, The State University of New Jersey reported on the progress of the Ocean Data Labs Project. This project is a Rutgers-led effort to build a “Community of Practice” to tap into the firehose of OOI ocean data to support undergraduate education. To date, the project has hosted four “development” workshops that introduced participants to the OOI, conducted data processing with Python notebooks, and shared effective teaching strategies, in addition to a series of introductory workshops and webinars. As part of the development workshops, 56 university, college, and community college faculty designed 19 new “Data Explorations,” featuring web-based interactive “widgets” that allow students to interact with pre-selected data from the OOI. The project also sponsors a series of webinars, a fellowship program, and is compiling a library of resources (including coding notebooks, datasets, and case studies in teaching) to help the community.
Cheryl Greengrove, University of Washington Tacoma, summarized an article in the March issue of Oceanography that she and colleagues from across the United States wrote detailing ways to integrate OOI data into the undergraduate curriculum. The wealth of freely-accessible data provided by OOI platforms, many of which can be viewed in real or near-real time, provides an opportunity to bring these authentic data into undergraduate classrooms. The TOS article highlights existing educational resources derived from OOI data that are ready for other educators to incorporate into their own classrooms, as well as presents opportunities for new resources to be developed by the community. Examples of undergraduate introductory oceanography OOI data-based lessons using existing interactive online data widgets with curated OOI data on primary productivity, salinity, and tectonics and seamounts are presented, as well as ways to use OOI data to engage students in undergraduate research. The authors provide a synthesis of existing tools and resources as a practical how-to guide to support new resource development and invite other educators to develop and implement new educational resources based on OOI data.
Matthew Iacchei, Hawaiʻi Pacific University, presented how he has been integrating OOI data explorations to supplement his upper division oceanography lecture and labs with real data from around the world. Last semester, he had students explore patterns of dissolved oxygen and impacts of anoxia at the coastal endurance array in Oregon and compare that data to dissolved oxygen data the students collected in Kāneʻohe Bay, Hawaiʻi. This semester, students are working through two exercises with OOI data as part of their primary productivity lab (perfect, as it is now online!). Students will compare vertical profiles from Hawaiʻi with seasonal variations across the world, and will compare latitudinal drivers of primary production using data from a time-series from the Southern Ocean Array.
Strengthening OOI data usability
Wu-Jung Lee, a senior oceanographer at the Applied Physics Laboratory, University of Washington, is using data collected by the OOI to develop new methodologies for analyzing long-term ocean sonar time series. In a project funded by the National Science Foundation, she and her colleagues show that unsupervised matrix decomposition techniques are effective in discovering dominant patterns from large volumes of data, which can be used to describe changes in the sonar observation. Their preliminary analysis also show that the summaries provided by these methods facilitate direct comparison and interpretation with other ocean environmental parameters concurrently recorded by the OOI. A parallel effort that spun out of this project is an open-source software package echopype, which was created to enable interoperable and scalable processing of biological information from ocean sonar data.
As part of the Rutgers Ocean Modeling Group, in conjunction with University of California Santa Cruz, John Wilkin and Elias Hunter are delivering a high-resolution data assimilative ocean model analysis of the environs of the Pioneer Coastal Array, including a systematic evaluation of the information content of different elements of the observing network. The project uses the Regional Ocean Modeling System with 4-Dimensional Variational data assimilation. To produce a comprehensive multi-year (2014-2018) analysis required them to assimilate all available Pioneer CTD data, with quality checks, in a rolling sequence of data assimilation analysis intervals. They used three days of data in each analysis, which required queries to with a time range constraint and relevant platform (i.e. glider, profiler, fixed sensor), migrating all Pioneer CTD data (wire following profilers, gliders, fixed sensors, plus ADCP velocity) to an ERDDAP server. The simple graphing capabilities in ERDDAP allow quick browsing of the data to trace quality control or availability issues, and ERDDAP provides a robust back-end to other web services to create more sophisticated graphical views, or time series analysis. Using the ERDDAP Slide Sorter tool, they operate a quick look Control Panel to monitor the data availability and quality.
Mitchell Scott and colleagues Aaron Marburg and Bhuvan Malladihalli Shashidhara at the University of Washington, are studying how to segment macrofauna from the background environment using OOI data from the Regional Cabled Axial Seamount Array. Their long-term goal is to use an automated approach to study species variation over time, and against other environmental factors. Their initial step focuses specifically on scale worms, which are very camouflaged, making them difficult to detect. To address this, the researchers initially used a deep learning model, called U-Net, to detect and localize the scale worm locations within an image. To address the high rate of false positives using this model, they added an additional classifier (a VGG-16 model) to verify the presence of scaleworms. This combined, applied approach proved feasible for scale worm detection and localization. Yet because the environment of the Axial Seamount is so dynamic due to the growth and decay of chimneys at the site and resulting changes in bacteria and macrofauna present, they found the performance of the model decreased over time.
Weifeng (Gordon) Zhang of Woods Hole Oceanographic Institution has been using Pioneer Array data to understand the physical processes occurring at the Mid-Atlantic Bight shelf break, including the intrusion of Gulf Stream warm-core ring water onto the shelf and the ring-induced subduction of the biologically productive shelf water into the slope sea. His findings were reported in a Geophysical Research Letters paper where data from the Pioneer Array moorings and gliders demonstrated the anomalous intrusion of the warm and salty ring water onto the shelf and revealed the subsurface structure of the intrusion. Zhang also shared findings reported in the Journal of Geophysical Research: Oceans where data from the Pioneer Array showed a distinct pattern of relatively cold and fresh shelf water going underneath the intruding ring water. These results show the subduction of the shelf water into the slope sea and a pathway of shelf water exiting the shelf. In both instances, Zhang and his colleagues used computer modeling to study the dynamics of these water masses. These two studies together suggest that shelf break processes are complex and require more studies in the region.
Hilary Palevsky of Boston College presented results from an ongoing project funded by the National Science Foundation’s Chemical Oceanography program, using biogeochemical data from the OOI Irminger Sea Array. Analysis of dissolved oxygen data on OOI Irminger Sea gliders and moorings from 2014-2016 showed the importance of biogeochemical data collected over the full seasonal cycle and throughout the entire water column, due to the influence of subsurface respiration and deep winter convection on biological carbon sequestration. The OOI Irminger Sea array is the first source of such full-depth year-round data in the subpolar North Atlantic. To quantitatively evaluate the annual rate of carbon sequestration by the biological pump and the role of deep winter convection, Palevsky and colleague David Nicholson of the Woods Hole Oceanographic Institution collaborated with OOI to improve the calibration of oxygen data at the Irminger Sea array by modifying the configuration of glider oxygen sensors to enable calibration in air each time the glider surfaces, which improves the accuracy and utility of the data collected both from gliders and from moorings. Palevsky presented preliminary results demonstrating successful glider air calibration at the Irminger array in 2018-2019 as well as work by student Lucy Wanzer, Wellesley College, demonstrating the importance of well-calibrated oxygen time series data to determine interannual variability in rates of subsurface respiration and deep winter ventilation in the Irminger Sea.
Read More
Endurance Cruise Delayed by COVID-19
The spring 2020 OOI Endurance Operations and Management (O&M) turn cruise has been delayed for at least 30 days due to travel and personnel restrictions imposed to stem the spread of the virus COVID-19.
The 16-day cruise was set to depart on 31 March from Newport, Oregon aboard the R/V Sikuliaq to service the array off the Oregon and Washington coasts. The R/V Sikuliaq is part of the US academic research fleet managed by UNOLS (the University-National Oceanographic Laboratory System). UNOLS imposed a 30-day suspension in fleet operations on 13 March to help ensure the safety of the ship’s crew and science party and to mitigate the risk of virus spread. Rescheduling of activities will commence once the situation stabilizes and UNOLS sees a path forward to re-start research vessel operations safely.
Upcoming O&M cruises for the Pioneer, Irminger, and Papa Arrays also are scheduled aboard UNOLS vessels (R/V Neil Armstrong and R/V Sikuliaq). These cruises fall outside of the UNOLS current 30-day suspension so cruise preparation continues.
We do not anticipate that cruise schedule changes will affect the collection nor dissemination of OOI data, which will continue to be available for users here.
Read More