
Posts Tagged ‘Pioneer Array’
Pioneer Data Complements Fisher-Collected Data to Explain Ocean Processes and Fish Distributions
Since 2014, fishers in southern Rhode Island and scientists from Woods Hole Oceanographic Institution (WHOI) have been working collaboratively to share data and learn from one another. For the past seven years, fishers have been collecting oceanographic data through the Commercial Fisheries Research Foundation’s (CFRF) Shelf Research Fleet and WHOI has shared data collected by the Pioneer Array.
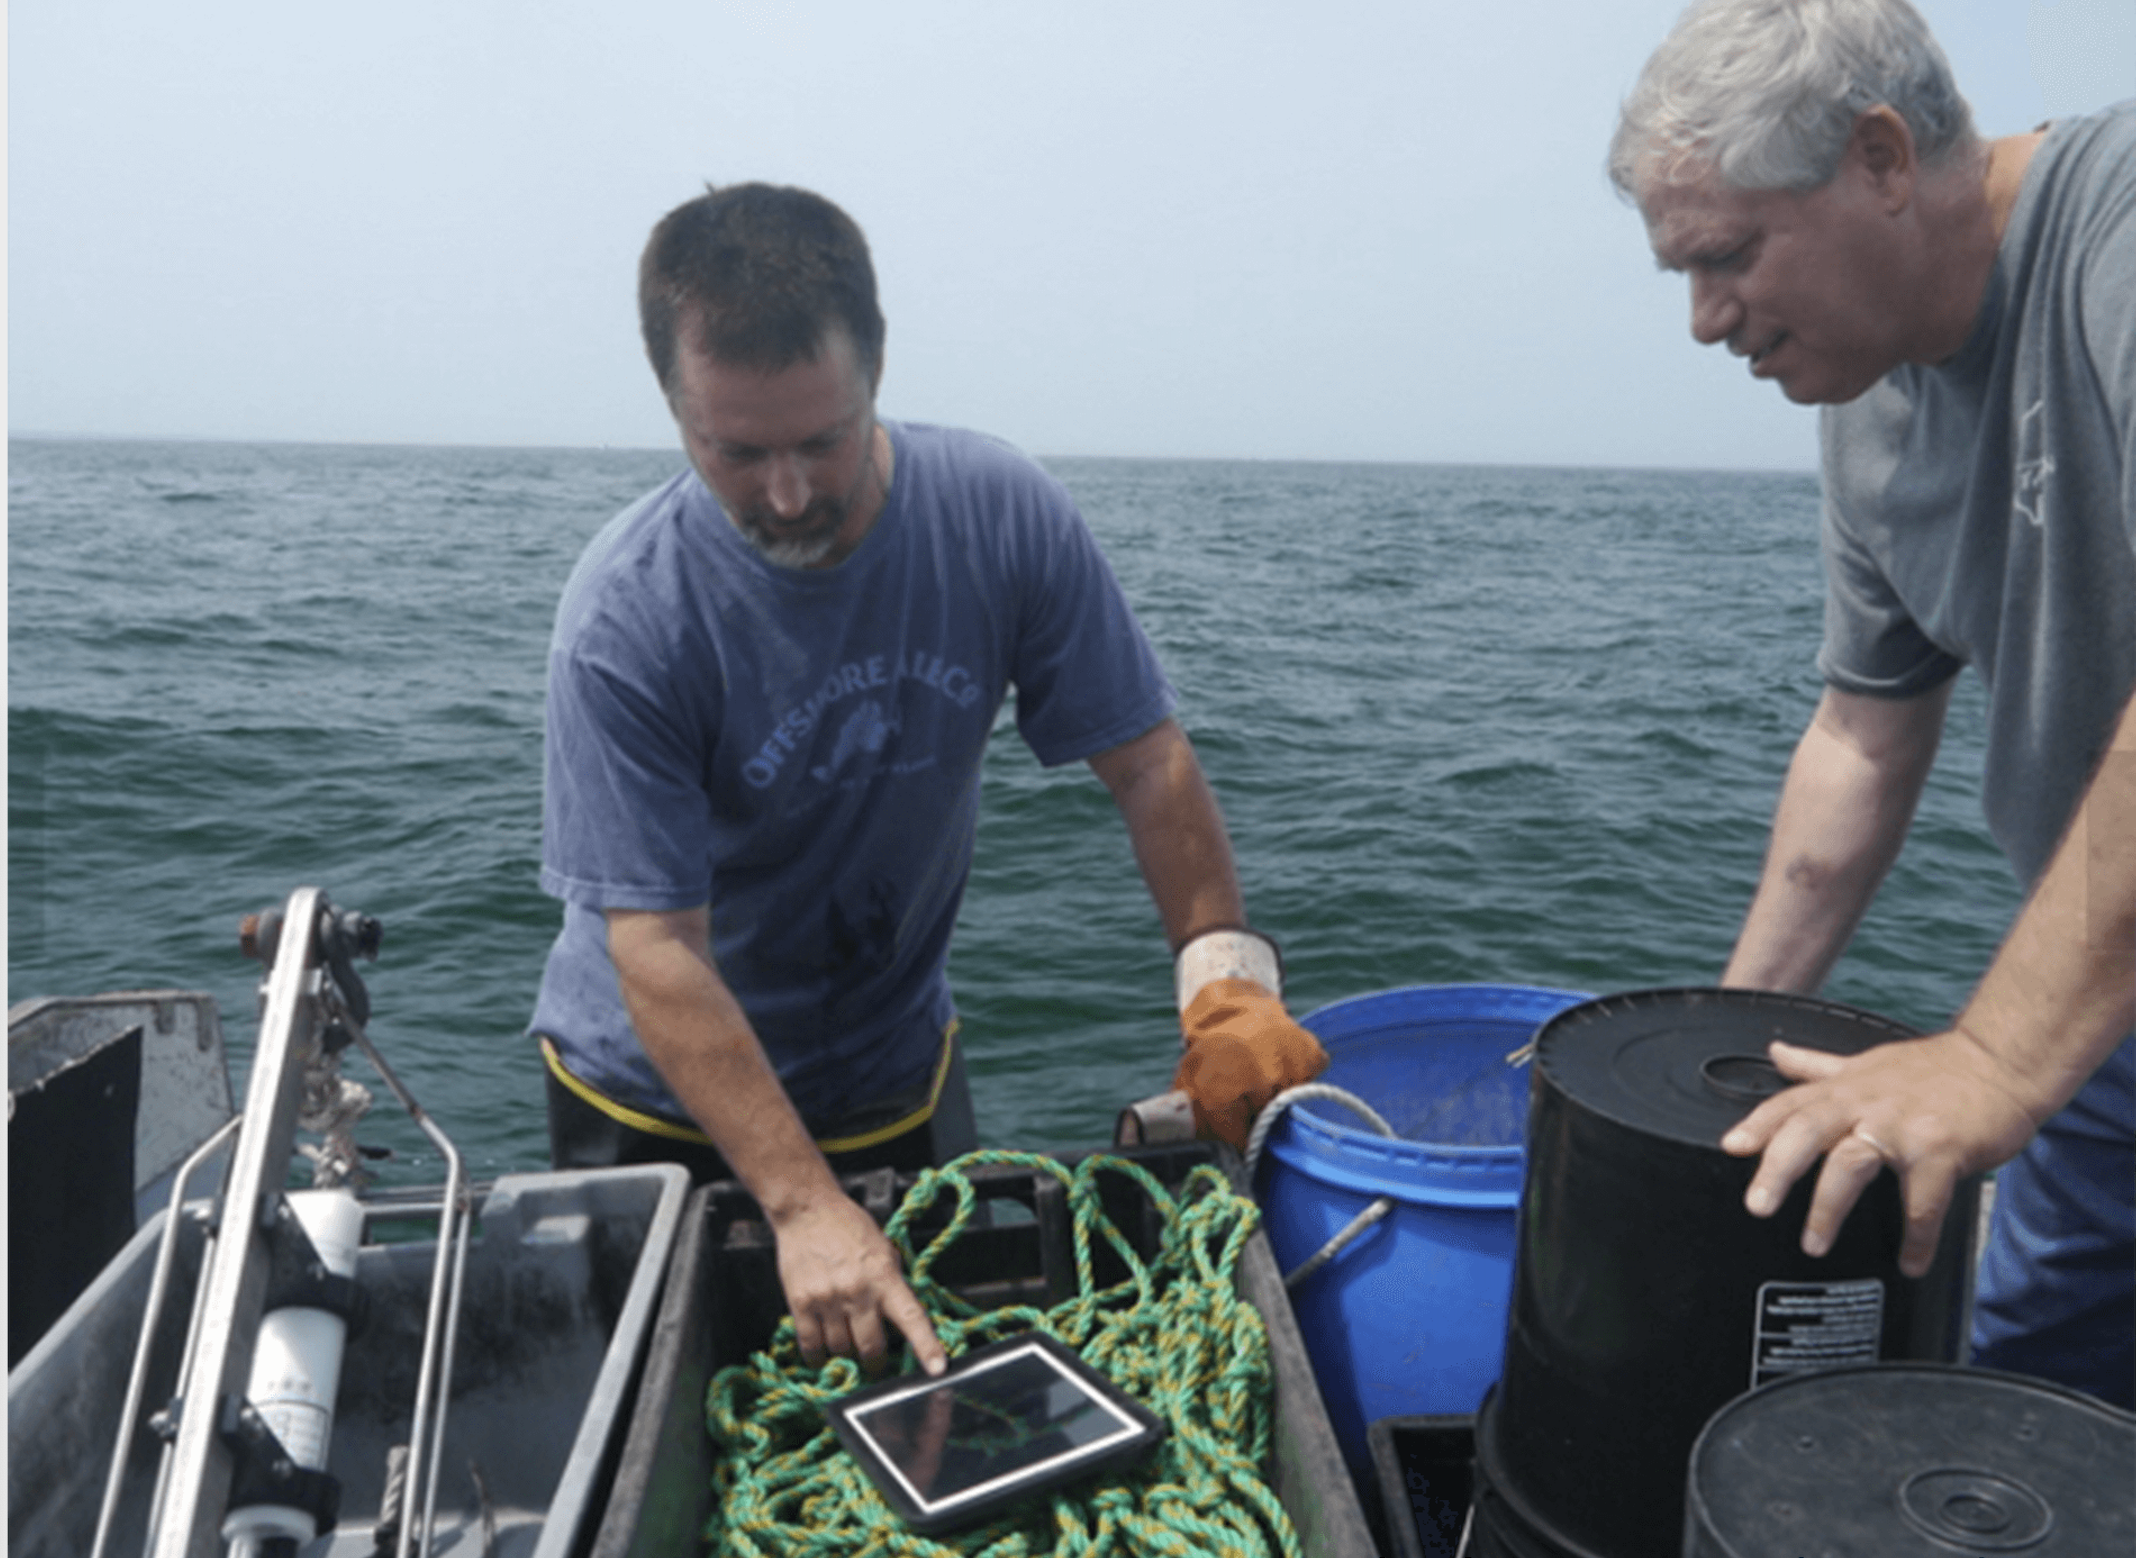
Through this partnership, fishers have come to value data from the Shelf Research Fleet and the Pioneer Array, as well as the insights of researchers who have spent years studying some of the most productive fisheries in U.S. waters. WHOI provides Pioneer data to fishers, and fishers provide oceanographic data collected during their normal fishing operations using CTDs which measure conductivity, temperature and depth information through the CFRF/WHOI Shelf Research Fleet. When the CTDs are brought onboard they wirelessly communicate the temperature data to an iPad where fishermen can view oceanographic conditions and ultimately upload the data to scientists. These CTD measurements provide the physical properties of sea water, which help determine the location and composition of the catch.
[caption id="attachment_20251" align="alignright" width="300"] Fisher Michael Marchetti (left) and WHOI scientist Glen Gawarkiewicz discuss data collected by a portable CTD. Credit: Commercial Fisheries Research Foundation.[/caption]
“This arrangement is a good example of how if people are willing to listen and really learn to value issues that are going on for another group, remarkable things can occur,” said Glen Gawarkiewicz, a WHOI researcher who leads the CFRF -WHOI Shelf Research Fleet.
In December, Gawarkiewicz visited the sea surface temperature website maintained by Rutgers University. There he noticed a sea surface temperature image that seemed to suggest a patch of warm, salty water known as a warm core ring forming directly adjacent to the continental shelf in the vicinity of the Pioneer Array. Warm core rings form when the Gulf Stream becomes unstable. These meanders can break off forming a swirling mass of water dozens of miles across, with warm water at the center that can be transported away from the Gulf Stream and into normally cold coastal waters of New England. Once there, such eddies can disrupt ecosystems and affect weather patterns for weeks.
[caption id="attachment_20250" align="alignleft" width="300"]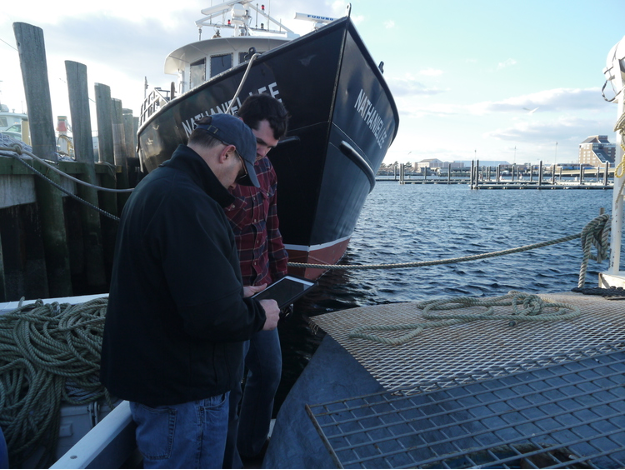 Newport Rhode Island lobsterman James Violet (foreground) reviews oceanographic data collected via CTDs on WHOI provided iPads. Credit: Commercial Fisheries Research Foundation.[/caption]
Gawarkiewicz then went to the Ocean Observatories Initiative data portal and made plots that confirmed the existence of high-salinity surface water near one of Pioneer’s offshore moorings and near the seafloor of one of the array’s inshore moorings. The conditions, he said, were very much like an event in January 2017 in which fish normally associated with warm Gulf Stream waters were caught near Block Island. The event in January 2017 was initially identified in Shelf Research Fleet data and then confirmed in Pioneer Array glider data analyzed by Robert Todd of WHOI.
Acting on the solid relationship built between WHOI and the CFRF, Gawarkiewicz emailed CFRF staff to warn them that conditions were changing and that they should be on alert for changes in the fishery. Shortly after, he received a phone call from Shelf Fleet collaborator, Aubrey Ellertson, who had reported that fishers were noticing an increase in water temperature on the bottom of the seafloor, and an impact on their catch. For some fishers, the Jonah crab fishing declined, and for others they were not seeing traditional fish species caught in their gillnets.
This exchange highlights the strong partnership between WHOI and the Rhode Island fishing fleet. The collaboration has helped participating fleet members recognize oceanographic processes and relate their fishing catch to processes discussed with WHOI scientists like Gawarkiewicz, and his colleagues Magdalena Andres, Ke Chen, and Massachusetts Institute of Technology/WHOI Joint Program graduate Jacob Forsyth. At the same time, Gawarkiewicz and his team have learned from the fishing community about the impacts of warm core rings on species distribution, their catch and, more broadly, on the shelf ecosystem.
“I knew to pass along this alert because members of the Shelf Research Fleet have taught me about what fishing outcomes are likely from some changing ocean conditions,” said Gawarkiewicz. “It is truly remarkable how much we have been able to learn from each other.”
Gawarkiewicz believes that this event demonstrates both the practical and intellectual value of the Pioneer Array data in improving understanding of sub-surface exchange processes. “Without Pioneer, we would not know the bottom salinity nor been able to give the fishers a heads-up as to what to expect. This shows how Pioneer is having a direct impact on how, when, and where people are fishing.”
To hear an audio piece with interviews with Gawarkiewicz, Aubrey Ellertson and others, listen here.
Read More
Should the Pioneer Array be moved? If so, where?
In 2021, the Ocean Observatories Initiative Facilities Board (OOIFB) and the National Science Foundation (NSF) are launching a process to consider whether to move the Pioneer Array from its current location, on the New England shelf and slope south of Martha’s Vineyard, to a new site. Selection of the next OOI Pioneer Array location, or decision to maintain the Array at its current location, will be driven by community input on the important science questions that can be addressed by the Pioneer Array.
The OOI community is invited to weigh in on this important decision during a two-phase sequential lab approach that will bring scientists, educators, and other stakeholders together virtually to evaluate 1) future location options for the Pioneer Array and 2) new design considerations that can enable exciting research endeavors at the chosen location.
Two Innovations Labs will be held in 2021. The Phase 1 Innovations Lab, March 15-19, will explore possible locations for the Pioneer Array based on multiple factors, driven by scientific questions that require an ocean observatory to advance knowledge. At the Lab, interdisciplinary teams will work together to ideate and develop a roadmap of possible locations including exploring new scientific, educational, and partnership opportunities.
The Phase 2 Innovations Lab, in late spring/early summer, will come up with a plan to maximize the science gains and broader impacts of the potential new site. If a new site is recommended, the Array would be moved in 2023. The OOI Coastal and Global Scale Nodes (CGSN) Team at Woods Hole Oceanographic Institution would continue the operation and maintenance of the array, regardless of its location.
The Lab’s findings will be considered by an NSF review panel, which will report to NSF in early fall on the new Pioneer Array location and how it can be optimized for science and education.
How to Become Involved
For those interested in learning more, a 60-90-minute informational session, Phase 1 Micro Lab, is planned for 13 January 2021, beginning at 1 pm Eastern. Representatives from NSF along with CGSN, the current operator of the Pioneer Array, will present information about the selection process and technical details about the Pioneer Array.
Individuals interested in applying for the Phase I Innovations Lab are encouraged to attend the Micro Lab. The information provided could be useful in submitting an application. To attend the Phase 1 Micro Lab, please RSVP here.
The application to participate in the Phase 1 Innovations Lab is available here. The application deadline is 31 January 2021.
Selected Innovative Lab participants will be announced in mid-February. Participants selected for Phase I will also be considered for Phase II.
What to Expect
The Innovations Labs will bring together scientists, stakeholders, and educators. Interdisciplinary teams will work together for six-hour days for the full week. Teams will form, pitch, and refine plans (based on input from experts and other participants). Participants will meet virtually each day of the week (M-F). Four days will be for synchronous meetings and one day will be dedicated to asynchronous team work
To learn more or to apply, click here.
Read More
Potential Relocation of the OOI Pioneer Array Discussion 8 Dec
The National Science Foundation (NSF) will present plans to use an “Ideas Lab”, a participatory, immersive process designed to innovative the decision-making process for the potential move of the Ocean Observatories Initiative (OOI) Pioneer Array at the American Geophysical Union Fall Meeting. The presentation will be at the OOI virtual booth, on 8 December 11:15-noon Eastern. Lisa Clough, Section Head from NSF’s Division of Ocean Sciences, will describe the “Ideas Lab” process that will be used to determine if the Pioneer Array should be moved, and if so, to what location. She will be joined by Al Plueddemann, Project Scientist for OOI’s Coastal and Global Scale Nodes, who will speak to the operational considerations involved in a potential move of the Pioneer Array.
The Coastal Pioneer Array is currently located in the Middle Atlantic Bight, centered about 75 nautical miles south of Martha’s Vineyard, where the continental shelf-slope is highly productive. The area was chosen as the initial placement of the Pioneer Array to examine exchanges between the shelf and slope and the shelf ecosystem and provide insight into air-sea gas exchange, including carbon dioxide absorption. From the outset, NSF has committed to re-evaluating the placement of the Pioneer Array every five-to-seven years.
“Ideas Lab are designed to bring together people to innovate and invigorate their scientific and educational approaches. We hope by using this participatory process, current and future users of OOI data will deeply explore the opportunities of having an open-data real-time coastal ocean array in various locations within the US EEZ,” explained Clough. “It is our hope that by collectively considering what the optimal location for the Pioneer Array is, and to a certain extent what types of data will be collected and how, the decision-making process will also encourage new thinking.”
Plueddemann, who has been involved with 15 successful missions to recover and deploy equipment at the Pioneer Array, will introduce some of the technological, logistical and environmental considerations inherent in a decision to relocate the array.
“My role in this decision-making process is solely as an information broker,” explained Plueddemann. “Neither I nor anyone involved in the current Pioneer Array team will be involved in the process of deciding how and where the Pioneer Array might be relocated. Our role will be to inform and advise on the feasibility of different concepts.”
Regardless of the location decision, the current team at Woods Hole Oceanographic Institution will continue to operate the Pioneer Array. Their formal role as operators of the Array entails expertise in the deployment, recovery, and maintenance of the equipment.
REGISTER NOW!
Potential Relocation of the Pioneer Array: Participate in the Process
8 December from 11:15 am-noon
Read More
Rolling Seas, Followed by Blue Skies During Pioneer 15
The weather for the 15-day Pioneer 15 expedition aboard the R/V Neil Armstrong came in like a lion and left like a lamb. As the ship departed the Woods Hole dock on 28 October, the sky was gray, the air damp, and the forecast foreboding as the 10- member scientific team and the crew of the R/V Neil Armstrong headed toward the Pioneer Array, about 75 nautical miles south of Martha’s Vineyard.
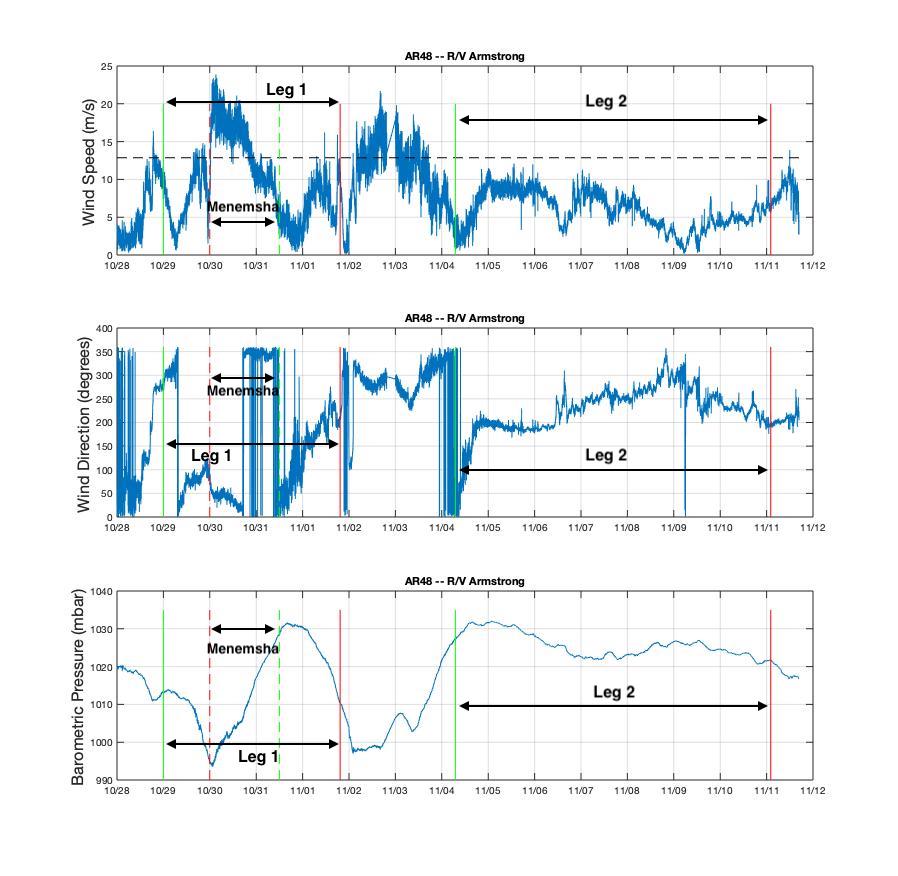
During Leg 1, the ship had some rocky days and briefly sought the protection of Menemsha Bight on the northwest side of Martha’s Vineyard as Tropical Storm Zeta passed through and brought her fury with her. Leg 2 of the journey brought with it clear skies and smooth sailing. The following shows the wind and pressure data from the ship throughout the Pioneer 15 cruise.
[media-caption path="/wp-content/uploads/2020/11/AR48_Weather-1_annotated.jpg" link="#"]Wind speed, direction, and barometric pressure from the met mast of the R/V Neil Armstrong. The green lines indicate when the ship arrived at the Array, the red lines show when it departed. The solid lines are for Leg 1 and Leg 2, and the dashed lines are the excursion to Menemsha in Leg 1. Credit: Sheri N. White (WHOI)[/media-caption]
Chief Scientist Sheri N. White said, “Despite the difficult weather, we had a very successful mission. The team recovered and deployed three coastal surface moorings and a profiler mooring, and deployed two winter coastal profiler moorings. We also were able to recover three gliders, and collect shipboard and CTD data in the vicinity of the Array. We planned on a bit of flexibility in the schedule due to the late fall departure, which always brings with it unpredictable conditions.”
The expedition was conducted in two legs because all of the moorings could not be accommodated on the ship at the same time. The Team returned to home port at the conclusion of the cruise on 11 November, when they disembarked after a month of being either in isolation or at sea away from friends and family.
The recovered moorings are now undergoing refurbishment onsite at WHOI so they will be ready for the next equipment turn in spring 2021. Next on tap for the Pioneer Array is the deployment of four gliders, Next on tap for the Pioneer Array is the deployment of four gliders, which will be done from a small vessel when the weather allows a safe transit.
Pioneer 15 in Pictures
[media-caption path="/wp-content/uploads/2020/11/DSC_0138-scaled.jpg" link="#"]The Pioneer 15 Team deploys the Central Surface Mooring on Leg 1 in dreary weather. Credit: Dee Emrich©WHOI[/media-caption]
[media-caption path="/wp-content/uploads/2020/11/DSC_0685-scaled.jpg" link="#"]The Pioneer 15 Team recovers the Inshore Surface Mooring. It had been in deployed in the water for 12 months. Credit: Dee Emrich©WHOI[/media-caption]
[media-caption path="/wp-content/uploads/2020/11/IMG_4234-scaled.jpg" link="#"]The Team dressed as oceanographers for Halloween… and deployed the Inshore Profiler Mooring in the few hours of clear skies between two storms at the Pioneer Array. Credit: Sheri N. White©WHOI[/media-caption]
[media-caption path="/wp-content/uploads/2020/11/IMG_4244-scaled.jpg" link="#"]The R/V Neil Armstrong left the WHOI dock on Leg 2 of the Pioneer 15 expedition, with the Central Surface Mooring in position for deployment. Credit: Sheri N. White©WHOI[/media-caption]
[media-caption path="/wp-content/uploads/2020/11/IMG_4245-scaled.jpg" link="#"]The Offshore Surface Mooring is ready for deployment on the stern of the R/V Neil Armstrong on Leg 2. Credit: Dee Emrich©WHOI[/media-caption]
[media-caption path="/wp-content/uploads/2020/11/IMG_4245-scaled.jpg" link="#"]Beautiful weather on Leg 2 made recovering the large surface moorings a bit easier. The surface moorings were deployed for 12 months, rather than six, due to the COVID pandemic. Credit: Jennifer Batryn©WHOI[/media-caption]
[media-caption path="/wp-content/uploads/2020/11/PMOU-16_deploy.jpg" link="#"]This is what a Profiler Mooring looks like during deployment. Profiler Moorings collect data from the entire water column using a McLane Moored Profiler, which crawls up and down the mooring line. Credit: Sheri N. White©WHOI[/media-caption]
[media-caption path="/wp-content/uploads/2020/11/ISSM_Biofouling.jpg" link="#"]This is some of the biology that has taken up residence on the Inshore Surface Mooring during its year-long stay on the Atlantic continental shelf. Credit: Dee Emrich©WHOI[/media-caption]
Read More
Buoy Wave Height Measurements Improve SAR Estimates
Excerpted from the OOI Quarterly Report, 2022.
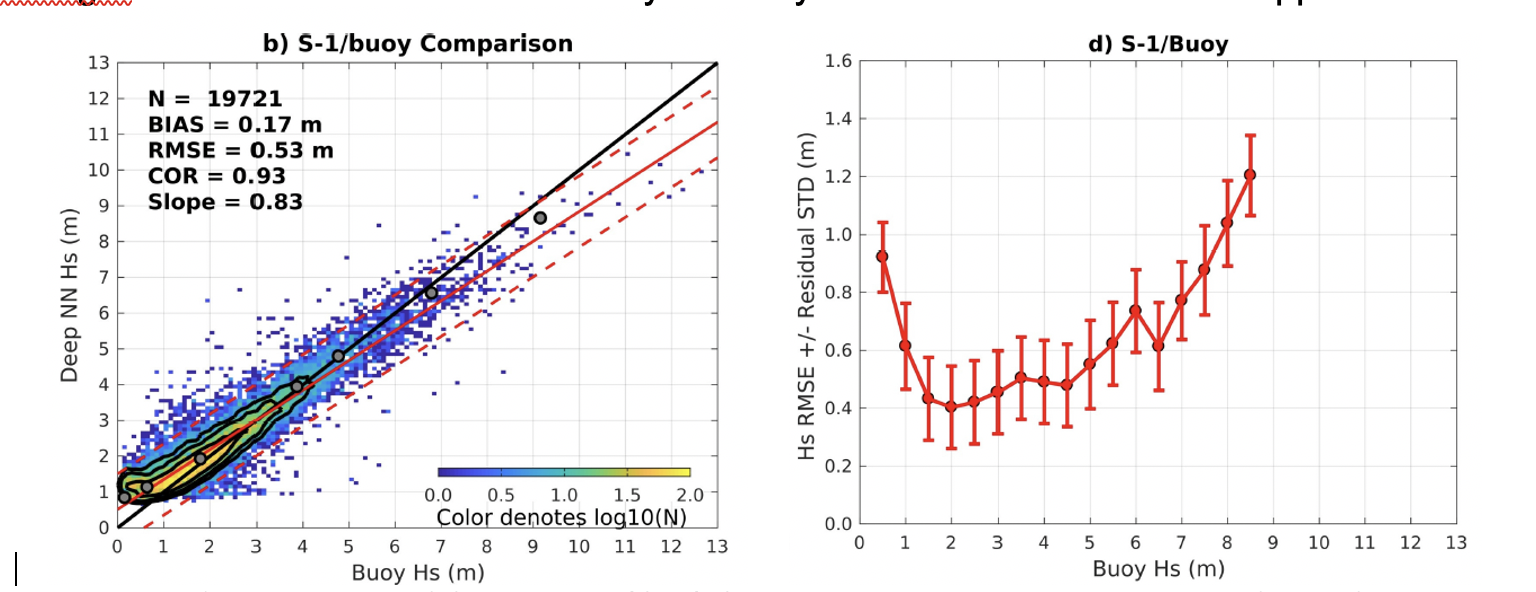
Synthetic Aperture Radar (SAR) sensors on satellites measure backscatter from the ocean surface and can be used to estimate wave height at very high spatial resolution (~10 m) relative to satellite altimetry. Two Sentinel-1 satellites of the European Space Agency (ESA) collected SAR measurements of the ocean surface from 2015-2018, together covering the entire globe every six days. Data-driven approaches to predicting significant wave height (Hs) from SAR have either used relatively limited in-situ data sets or used a wave model (e.g. WaveWatch-3) as the “training” data for a deep learning approach. Quach et al.(2020) improve on previous approaches to estimation of Hs from SAR by creating a comprehensive in-situ observational record. They compiled data from the US National Data Buoy Center and Coastal Data Information Program, Canadian Marine Environmental Data Services, the international OceanSITES project, and the OOI. Surface wave data sets from the OOI Irminger Sea, Argentine Basin and Southern Ocean surface buoys were used. The authors note the importance of the Southern Ocean Array, where “many of the largest wave heights are recorded… [from] an under sampled region of the ocean.”
The comprehensive in-situ data set is split into separate training and validation segments. When SAR Hs from training data are compared to altimeter Hs from the validation segment, the deep learning algorithm shows root-mean-square (RMS) error of 0.3 m, a 50% improvement relative to prior approaches. Comparison with the buoy validation segment (Fig. 18) shows RMS error of 0.5 m. The authors attribute the increased error to the larger number of extreme sea states in the observations and the relative paucity of extremes in the training data.
Observational sea state information is critical for understanding surface wave phenomena (generation, propagation and decay), predicting wave amplitudes, and estimating extreme sea states. Thus, the improvement in RMS error using the deep learning technique notable. The availability of in-situ data from extreme environments such as those sampled by the OOI Irminger Sea and Southern Ocean Arrays are key to validation of these new approaches.
.
Read MorePioneer 15 Underway
[media-caption path="/wp-content/uploads/2020/11/IMG_0034-scaled.jpeg" link="#"]The Pioneer 15 Team departs aboard the R/V Neil Armstrong, framed by equipment that awaits deployment on leg two. [/media-caption]
On October 28th, ten scientists and engineers from Woods Hole Oceanographic Institution departed aboard the R/V Neil Armstrong headed to the Pioneer Array, about 75 nautical miles south of Martha’s Vineyard in the Atlantic Ocean. This trip is the 15th time that a team has traveled to the Pioneer Array to recover and deploy equipment at the site.
The team will recover and deploy three coastal surface moorings and a profiler mooring, and deploy two winter coastal profiler moorings. They will also conduct CTD (Conductivity, temperature, and depth) casts and water sampling at the deployment and recovery sites. In addition, the team will compare ship and buoy meteorological measurements at the surface mooring sites as a way to validate the mooring measurements.
“We’ve been isolating for 14 days, have successfully passed 2 COVID-19 tests, and are ready to go, “ said Sheri White, chief scientist for Pioneer 15. “This is a two-leg expedition because we can’t fit all of the moorings on the deck for one trip to the array. We plan to be in port on November 4th to swap out gear, but we can adjust our schedule accordingly. If bad weather picks up, we can head back to port early to collect the equipment for leg two and not lose valuable time at sea when we can’t work due to weather.” The ship is expected to return from leg two on 11 November.
The surface moorings being recovered have been deployed for one year – six months longer than intended, due to the COVID-19 pandemic – and so are starting to experience some wear and tear. The new moorings being deployed incorporate design updates intended to improve the robustness of components such as the wind turbines and stretch hoses. The team also will be deploying a prototype quad transducer for the ZPLSC instrument. The ZPLSC is a bio-acoustic sonar which measures acoustic signals of plankton and zooplankton at the OOI Coastal Arrays. It has transducers that emit at frequencies of 38, 125, 200 and 400 kHz (the latter three are all from a single quad-transducer). The new quad transducer design should lead to less failures and improved data collection for that instrument.
In addition to performing OOI tasks, the team will be conducting ancillary work to support the Northeast Shelf Long Term Ecological Research (NES-LTER) program. This will include CTD casts, and sampling from the ship’s underway seawater system with an Imaging FlowCytobot (IFCB) instrument.
The members of the scientific party include:
Sheri White, WHOI, Chief Scientist
Chris Basque, WHOI, Deck Lead
Jennifer Batryn, WHOI, Instrument Lead
Collin Dobson, WHOI, Surface Mooring Lead
Meghan Donohue, WHOI, Deck Ops
Eric Hutt, UNOLS, Deck Ops
John Lund, WHOI, Profiler Mooring Lead
Josh Mitchell, UNOLS, Deck Ops
Rebecca Travis, WHOI, Documentation Lead
Dave Wellwood, WHOI, Water Sampling
Read More
Ocean Data Labs Tutorial at WHOI Available Online
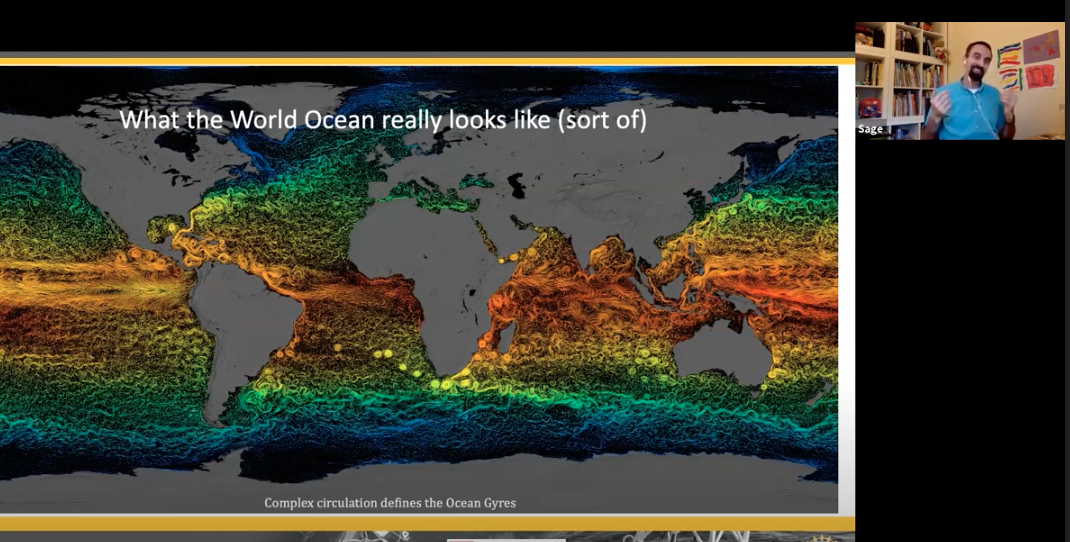
The Zoom screen was full as 40 people participated in the third of Woods Hole Oceanographic Institution’s (WHOI) Data Science Summer Series on 4 August 2020. Research Programmer Dr. Sage Lichtenwalner, of Rutgers, the State University of New Jersey, who helped design and implement the Ocean Observatories Initiative (OOI) Ocean Data Labs, presented.
Lichtenwalner gave an overview of the many resources available through the Ocean Data Labs project, which is developing, testing, refining, and disseminating easy-to-use, interactive Data Explorations and Data Lab Notebooks for use in the classroom. Entertaining and information, the hour-long presentation flew by as Lichtenwalner presented tricks and tips to downloading OOI data, how to use OOI data in python and other computing platforms such as the Google Colab interface, and ended with a demonstration visualization of OOI data collected by its Pioneer Array. The complete webinar can be viewed here.
Dr. Stace Beaulieu, a senior research specialist in Biology and coordinator of WHOI’s Ocean Informatics Working Group, planned and hosted the session.
Read More
Partnerships Expand Use of OOI Data
The OOI’s primary mission is to make its data widely available to multiple users. One way it achieves this, on a broad scale, is by establishing partnerships with other organizations that also distribute ocean observing data. For example, OOI currently partners with the Integrated Ocean Observing System (IOOS), which provides integrated ocean information in near real-time and tools and forecasts to apply the data, the National Data Buoy Center (NDBC), which maintains a network of data collecting buoys and coastal stations as part of the National Weather Service, the Global Ocean Acidification Observing Network (GOA-ON), which uses international data to document the status and progress of ocean acidification, and Incorporated Research Institutions for Seismology (IRIS), a consortium of over 120 US universities dedicated to the operation of science facilities for the acquisition, management, and distribution of seismological data.
NANOOS: Making data relevant for decision-making
NANOOS, the Northwest Association of Networked Ocean Observing Systems, which is part of IOOS, has been operational since 2003, establishing trusting, collaborative relationships with those who use and collect ocean data in the Pacific Northwest. NANOOS has been an exemplary partner in ingesting and using OOI data. Part of its success lies in advance planning. NANOOS, for example, had determined that OOI assets, in addition to achieving the scientific goals for which they were designed, could fill a data void in IOOS assets running north and south in an area between La Push, WA, and the Columbia River, well before the OOI assets came online.
[media-caption type="image" class="external" path="https://oceanobservatories.org/wp-content/uploads/2020/09/Screen-Shot-2020-09-22-at-2.25.24-PM.png" alt="Endurance Array" link="#"]OOI’s Coastal Endurance Array provides data from the north and south in an important upwelling area in the northeastern Pacific. Gliders also traverse this region, with glider data available through both the IOOS Glider Data Assembly Center and the NANOOS Visualization System. Credit: Center for Environmental Visualization, University of Washington.[/media-caption]According to Jan Newton, NANOOS executive director at the University of Washington, “One of the reasons NANOOS is so effective is that our guiding principle is to be cooperative and not compete. If the public is looking for coastal data, for example, we want to make sure they can access it and use it, rather than having them trying to sort through whether it is a product of IOOS or OOI. We operate with the philosophy of maximizing the discoverability and service of the data and OOI has been a great partner in our mission. We’ve been really happy about how this partnership has played out.”
[media-caption type="image" class="external" path="https://oceanobservatories.org/wp-content/uploads/2020/09/Regional-Cable-Array-revised-.jpg" alt="Revised RCA" link="#"]OOI’s Regional Cabled Array also contributes data in the NANOOS region from its Slope Base and the Southern Hydrate Ridge nodes. Credit: Center for Environmental Visualization, University of Washington.[/media-caption]NANOOS has made a huge effort on its data visualization capabilities, so people can not only find data, but look at it in a relative way to use it for forecasting, modeling, and solving real-world problems. OOI data are integral in helping support some of these visualization and modeling efforts, which commonly play a role in situations facing a wide cross-section of society.
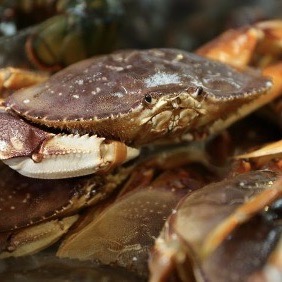
An example of this applicability played out in improved understanding of hypoxia (oxygen-deficient conditions) off the coast of Oregon, which had resulted in mass mortality events of hypoxia-intolerant species of invertebrates and fish, in particular, Dungeness crabs. Allowing access through NANOOS to near real-time oxygen data from OOI assets has allowed the managers and fishers to come up with some plausible solutions to maintaining this valuable resource. The Dungeness crab fishery is the most valuable single-species fishery on the U.S. West Coast, with landed values up to $250 million per year, and plays an enormous cultural role in the lives of tribal communities in the region, as well.
[media-caption type="image" class="external" path="https://oceanobservatories.org/wp-content/uploads/2020/09/Dungeness-Crab.jpg" alt="Dungeness Crab" link="#"]OOI oxygen data have helped resource managers and fishers maintain the valuable Dungeness crab fishery, which is the most valuable single-species fishery on the U.S. West Coast.[/media-caption]Researcher Samantha Siedlecki, University of Connecticut, reports that in late June of 2018, for example, fishers in the region were pulling up dead crabs in pots without knowing the cause. Scientists accessed near real-time OOI observations through the NANOOS data portal and found that the Washington Inshore Surface Mooring of the Coastal Endurance Array (EA) had measured hypoxia from June 7th onwards. So, the data confirmed real-life conditions and explained the crab mortalities.
This is important because such occurrences are helping to confirm models and enhance forecasting to better manage these events by providing guidance to fishers and resource managers. In this instance, the forecast indicates what regions will likely require reduced time for crabs to remain “soaking,” caged in the environment during hypoxia events, to ensure crabs are captured alive, and also aid in spatial management of the fishery itself. OOI data will play a role in continual improvements in forecasting in this region and the fishery by providing data during winter months, ensuring historical data are available and quality controlled for use in forecasting, and continuing to serve data in near real-time.
Adds Newton, “I can’t tell you how many OOI and other PIs come up and tell me how they love that their data are having a connection to real world problems and solutions. It makes their research go farther with greater impact by being part of this NANOOS network.”
Explains Craig Risien, Coastal Endurance Array senior technician at Oregon State University, “OOI is collecting an incredible wealth of data, offering a treasure chest of material to write papers, write proposals, include in posters, and now it is being used in practical ways for finding scientific solutions to environmental problems. Every time we look at the data, there’s a new story to tell. We always find something new, something interesting, and encourage everyone to have a look and experience the same usefulness and excitement about OOI data.”
Sharing OOI data
The OOI is in talks with the IOOS regions serving the Northeast Atlantic and the Mid-Atlantic to see how OOI data might enhance their networks, as well. The OOI also has been providing data to the National Data Buoy Center since 2016, supplementing the data collected by NDBC’s 90 buoys and 60 Coastal Marine Automated Network stations, which collectively provide critical data on unfolding weather conditions. And, the OOI has been providing data to Global Ocean Acidification Observing Network (GOA-ON), since mid-2019, ground-truthing on site conditions in real to near real-time, which is critical to understanding conditions contributing to ocean acidification and improving modeling capabilities to determine when it might occur. OOI’s Regional Cabled Array has been providing seismological, pressure and hydrophone data to Incorporated Research Institutions for Seismology (IRIS) since 2014, providing a wealth of data from Axial Seamount and on the Cascadia Margin. For example, on April 24, 2015 a seismic crisis initiated at the summit of Axial Seamount with >8,000 earthquakes occurring in 24 hrs, marking the start of the eruption. Starting at 08:01 that same day, the network recorded ~ 37,000 impulsive events delineating underwater explosions, many of which were associated with the formation of a 127 meter thick lava flow on the northern rift.
Data examples
If you would like to test drive some of the OOI data in NANOOS, NDBC, and GOA-ON, here are some examples below:
IOOS
· OOI data in the NANOOS Visualization System (NVS)
NDBC
· Coastal Endurance Array data (Stations 46097, 46098, 46099, 46100)
· Coastal Pioneer Array data (Stations 44075, 44076, 44077)
· Global Irminger Array data (Station 44078)
GOA-ON
· Coastal Endurance Array data
IRIS
· Regional Cabled Array (While searching within IRIS for OOI data, use the two-letter IRIS network designator “OO.”)
Read More
Shedding Light on Wave Energy Harvesting
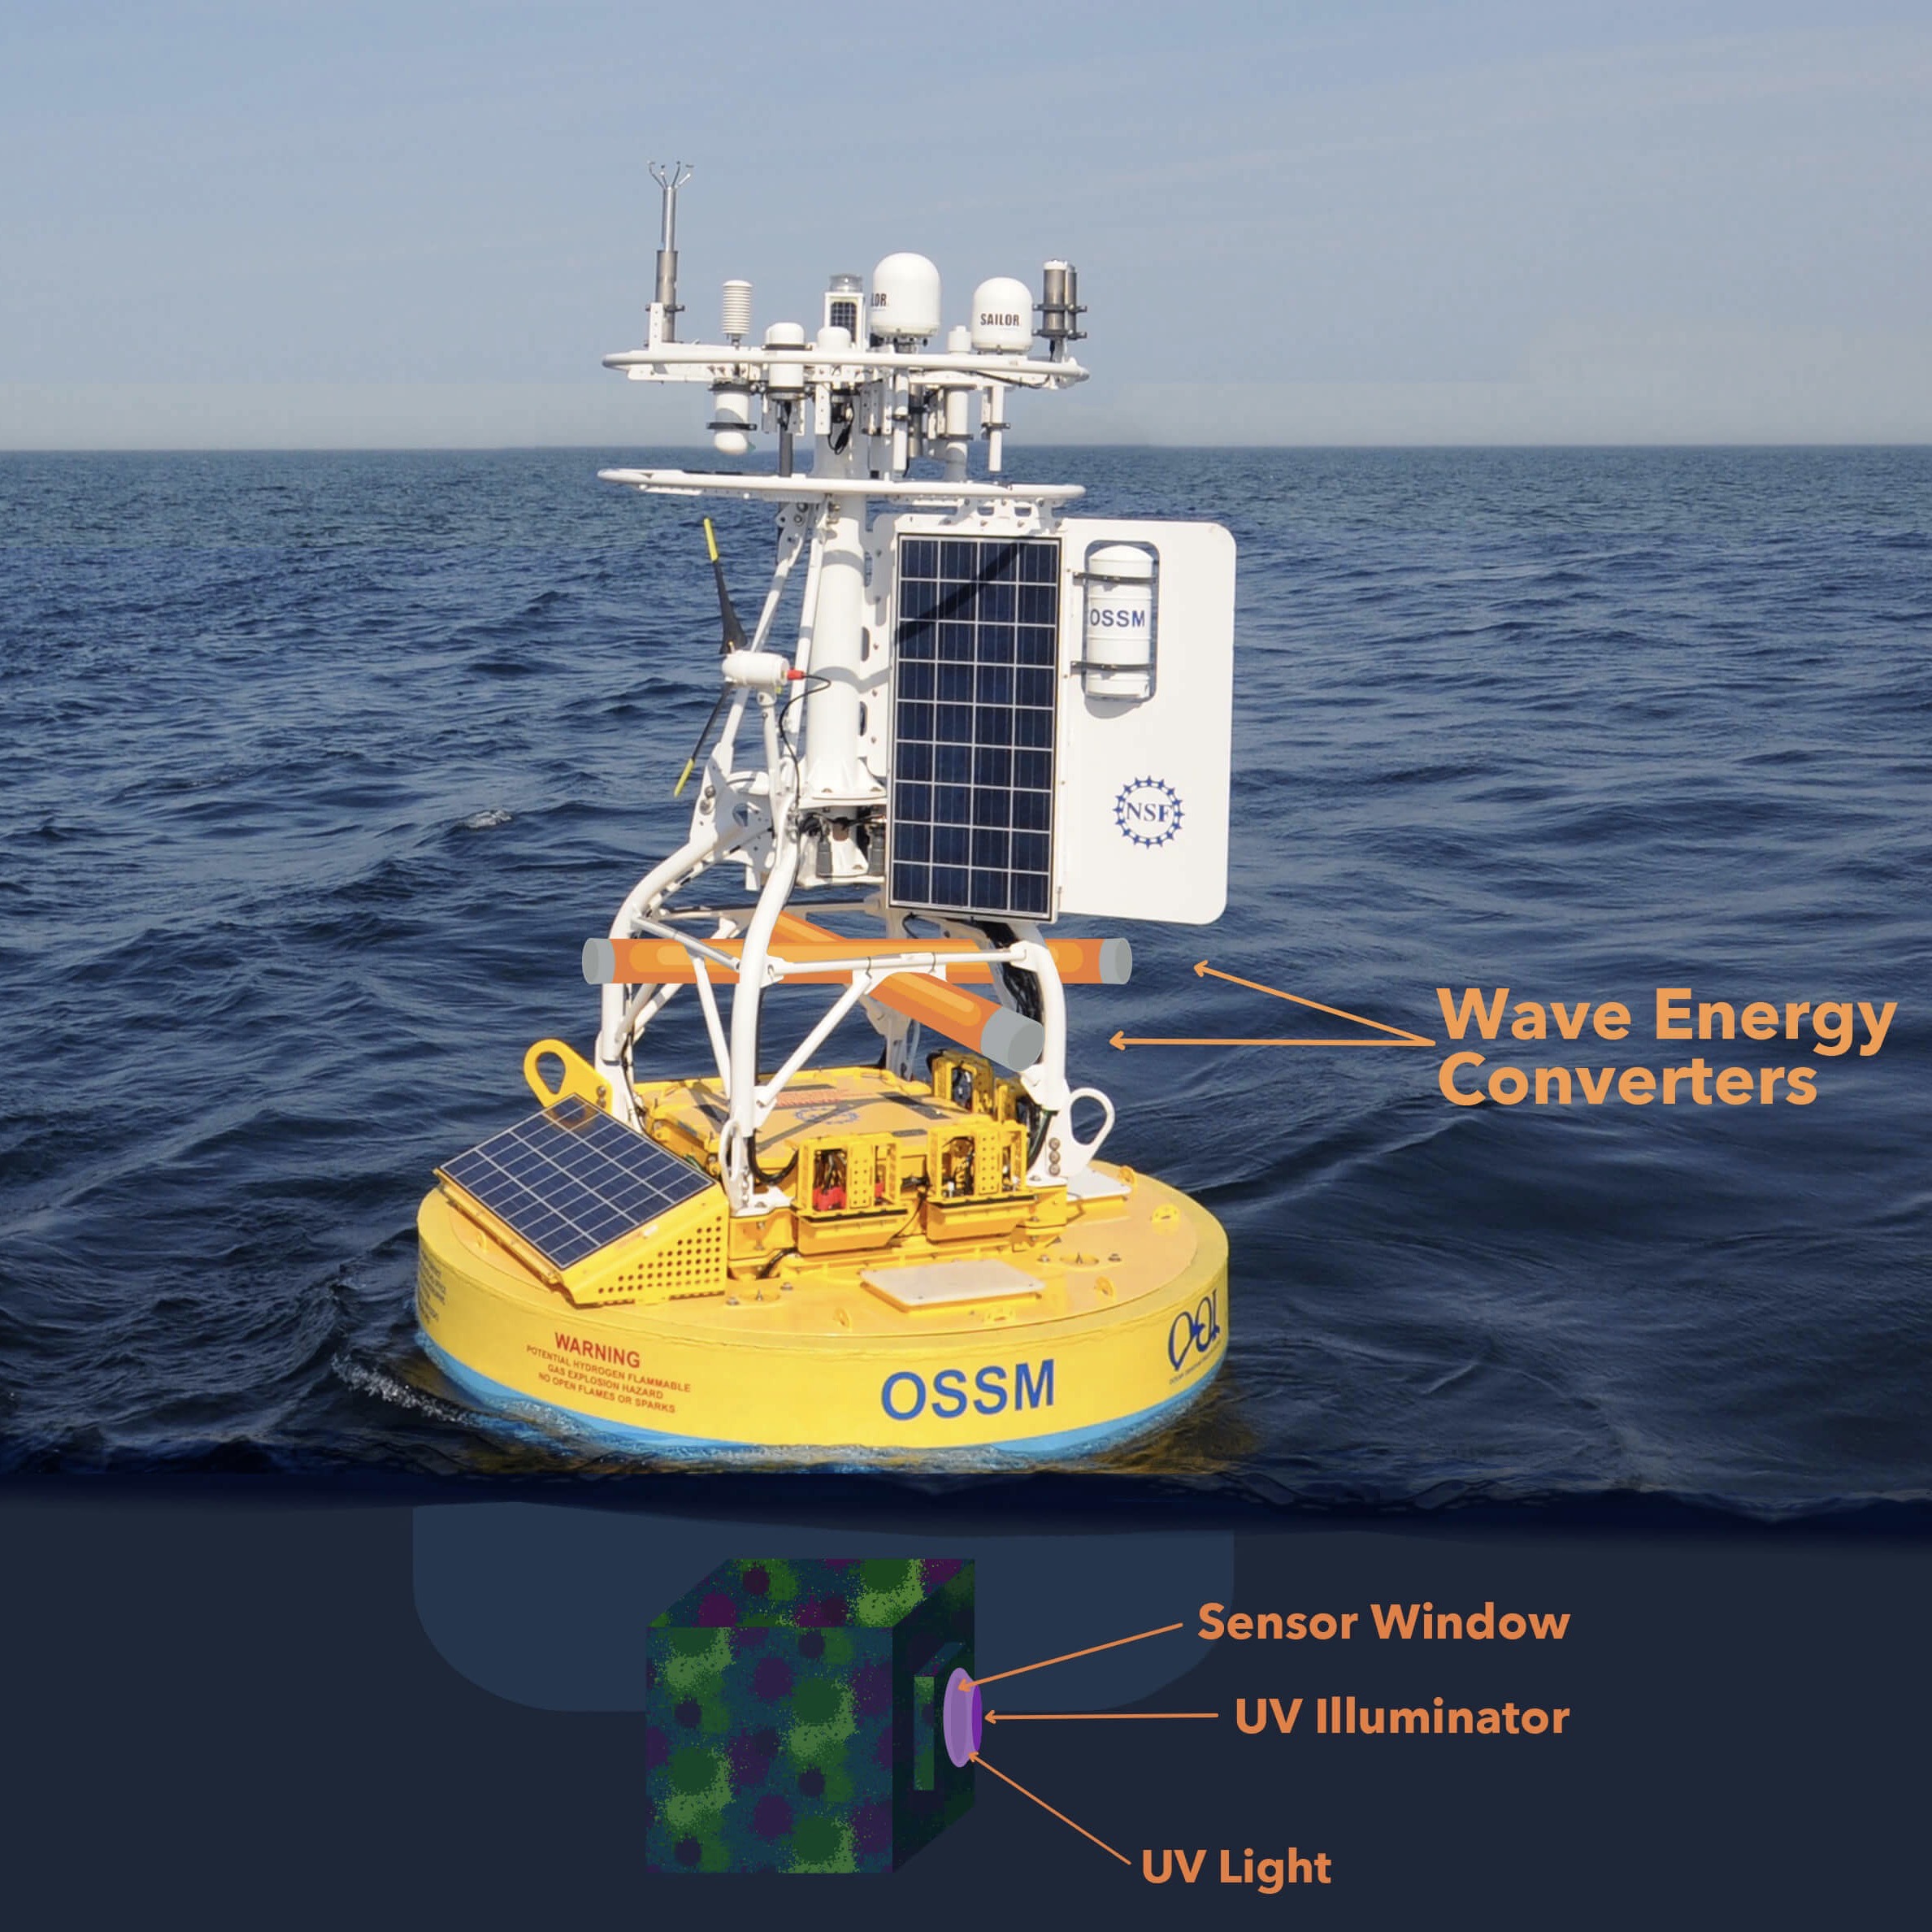
Two entrepreneurs and two engineers recently teamed up to develop a wave-based energy generator with the potential of powering the Pioneer Array, while also providing energy to a new, longer lasting, and potentially more effective way to keep the array’s sensors free and clear.
The Department of Energy thought the idea had such potential that it awarded the team a Small Business Technology Transfer (STTR) grant that will allow them to develop a proof of concept of this system by late March 2021.
The development team consists of grant Co-Investigator Matt Palanza, program engineer for the Ocean Observatories Initiative (OOI) at Woods Hole Oceanographic Institution (WHOI), Megan Carroll, a research engineer at WHOI and expert in the dynamics of moored systems, and Principle Investigator Julie Fouquet and Co-Investigator Milan Minsky, principals of 3newable, LLC, a firm dedicated to the development of small-scale wave energy converters. Fouquet started by developing and testing wave energy converter concepts on land, to choose an efficient, low-cost and flexible approach. Minsky brings to the team extensive experience in developing first-generation ultraviolet LEDs for medical and industrial applications that she will put to good use in designing a system to tackle serious biofouling conditions that plague all equipment put into the ocean for extended periods.
“The concept of harnessing wave energy at the Pioneer Array, then powering an ultraviolet LED anti-fouling light, which could possibly keep the array functioning much longer, would be a win-win. If this combination is proven here, it could have widespread application in oceanographic research and aquaculture applications, with tremendous potential for cost savings,” said Palanza.
Striving for Good Environmental Outcomes
Julie Fouquet founded 3newable LLC in 2015 with the goal of capturing electrical power from water waves as a source of renewable power. Previously, companies wanting to commercialize wave energy generation had failed while attempting to build utility scale systems, which were extremely costly. Years of experience in the semiconductor industry taught Fouquet that product development requires multiple design-build-test-redesign cycles. Companies developing utility-scale systems ran out of money before reaching a viable product. She chose to focus her efforts on developing an efficient and cost-effective small-scale wave energy converter that could fit into the back of an SUV and on a runabout boat.
Having worked together for decades, she and Minsky – now vice president of product at 3newable – teamed up to find out what sort of applications in the oceanographic community could use a small-scale wave energy converter.
After many meetings, they concluded that the Pioneer Array buoys would be a good testing ground. Palanza agreed and the team set out to write a proposal that would capitalize on their collective talents to provide a potential real-world application of wave energy and anti-biofouling technology.
The Pioneer Array buoys are already powered by wind and solar, but the wave energy converter offers a way to keep the sensors clear and recording for longer time periods using UV LED lights, possibly extending trip intervals needed to service the arrays.
Like most things in spring 2020, COVID caused delays in the launch of this project. DOE announced the award in May, but the actual award was delayed until early August, which potentially squeezes the March deadline for producing the feasibility study. From there, the team hopes to move forward to Phase 2, which would involve construction of both the wave energy conversion and UV anti-fouling prototypes and testing in the field.
“We are already working in a distributed way with processes in place so COVID hasn’t impacted our progress in analyzing data and developing lab tests,“ said Minsky. “But the interesting thing about the pandemic is that it has really propelled the UV LED field along as people explore its potential medical uses. Prices are dropping and quality is going up so we will be able to take advantage of these advances as we go about commercializing this module.”
During Phase 1, the team will be striving to answer the following questions:
· How much power is needed to run UV anti-biofouling equipment at the array?
· Can enough power be generated to meet the demand?
· How big of a wave energy converter unit will be needed?
· What are the unit size limitations if attached to the array?
“We all are excited to get this project launched. There’s a real need for improved anti-biofouling technology, and with the emergence of UV LEDs powered by waves onsite, it’s a sound solution with a potentially positive environmental impact, “added Palanza.
Read More
UV Anti-fouling Light Keeps Oxygen Sensors Clean
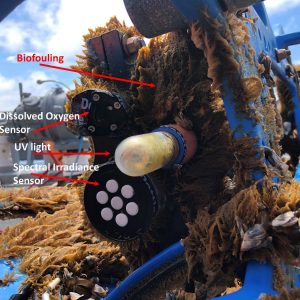
 Biofouling is a real challenge to keeping equipment deployed in the ocean free functioning properly to deliver data to shore. The addition of UV light is helping to keep the oxygen optode sensors clear and recording data. Photo: Jon Fram, Oregon State University.[/caption]
Biofouling is a hazard of keeping equipment in the ocean for long periods of time, particularly when it is near the surface where photosynthesis occurs. For OOI’s arrays that remain in the water for six months or longer, this is a pressing issue because of the need to ensure sensors can continue to collect and transmit data back to shore. The OOI scientists and engineers are always investigating ways to keep biofouling at bay. They recently worked with Aanderaa, which provides OOI’s oxygen optode sensors, to implement a solution to keep oxygen sensors free of biofouling by installing ultra-violet (UV) lights that periodically shine on the instruments’ sensing foil.
As early as 2016, a team of OOI engineers and technicians from Oregon State University, the University of Washington, and Woods Hole Oceanographic Institution began to tackle some of problems with the instruments selected by OOI and to improve the quality of instrument measurements. In October of 2016 AML Oceanographic showed OOI’s instrument group data from Ocean Networks Canada of a UV light used to mitigate biofouling on Aanderaa’s oxygen optodes. The following October, OOI deployed a side-by-side test of two oxygen optodes (one with a UV light pointed at it) at seven meters depth on the Oregon Shelf Surface Mooring. Data from the two sensors tracked each other for six weeks, and then the unprotected sensor fouled. Within weeks, there were daily afternoon spikes of up to twice the oxygen level of the protected sensor, with slightly lower measurements than the unprotected sensor at night due to respiration of the biofilm. The team found that the biofouling signal wasn’t always as dramatic, nor did it always develop in the same period of time after deployment. Physics has a hand in this, too. Sometimes the fouling signal disappeared after a storm cleaned off the sensor.
In summer 2018, OOI started deploying UV-protected oxygen optodes mounted shallower than 70 meters on Surface Moorings. By mid-209, once some initial hardware and deployment issues were resolved, OOI expanded deployment of UV-antifouling from moored dissolved oxygen sensors, to the dissolved oxygen sensors on the Coastal Surface Piercing Profilers, and then to uncabled digital still cameras moored at less than 70 meters depth.
Following the success of the UV-light test on dissolved oxygen sensors, UV antifouling was tested on a moored Pioneer Array spectral irradiance (SPKIR) sensor in 2018. Here too, the testing conducted with Sea Bird Scientific, the SPKIR vendor, confirmed that the UV light did not damage the instrument’s optics. As a result, in 2019, all subsurface OOI spectral irradiance sensors on Surface Moorings were outfitted with UV-antifouling mitigation, as well as the Coastal Surface Piercing Profilers and uncabled digital still cameras moored at less than 70 meters. The team has adjusted the cycle of the UV lights so that they prevent biofouling without damaging the sensors, interfering with measurements, or utilizing too much power.
“While the solution appears simple, it was a long journey to find the right mix of equipment and duration of use to resolve the issue of biofouling for each sensor at each location, “explained Jonathan Fram, project manager for the Coastal Endurance Array at Oregon State University. “An ongoing challenge is the intermittency of biofouling and the many forms it can take, which can make it difficult to properly diagnose the problem. Usually biofouling is a slimy film, but sometimes it can be a barnacle or another large creature.”
“The use of UV-lights for biofouling mitigation, although well-known, cannot often be used due to the power required,“ added Sheri White, senior engineer at Woods Hole Oceanographic Institution, who was instrumental in moving this solution forward on the Pioneer Array. “We have the advantage of generating our own power, so that we are able to implement it on a number of optical instruments on our Surface Moorings.”
OOI continues to measure the impact of the UV light on biofouling. While the results are clear that the UV lights increase measurement reliability and accuracy, the team is still trying to gauge the extent of the improvements. Data are annotated to indicate when UV-antifouling was used for each instrument deployment.
Read More