
Posts by Leslie Smith
OOI Monthly Update – May 2016 & World Ocean Day
Letter from the Director
OOI User Community and Colleagues,
Welcome to another edition of our OOI Monthly Newsletter. LOTS to cover this month, including achievement of a major program milestone and some exciting media coverage which highlights recent OOI developments and our program’s play in World Ocean Day.
Our OOI Cyber Infrastructure (CI) capabilities take a major leap forward this month with the release last week of our full suite of data delivery and display tools and a great improved User Interface (UI). And, the data team remains hard at work, continually coming bringing more data to you through the OOI data portal.
I encourage all of our many users to try out these new features and, as always, to keep the great feedback coming in to the HelpDesk. Your ongoing inputs are critical for us to identify and correct errors and make continual improvements to the data portal and other areas on the OOI website.
This month we’ve got yet another round of “turn cruises” getting underway, as our Implementing Organizations continue heading to sea to replace OOI instruments as a regular part of life cycle management.
Our summer season is off to a busy start, and I don’t see any slowdowns on the horizon!
Stay with us, and stay engaged.
Greg
Happy World Ocean Day
From everyone at the Ocean Observatories Initiative, we hope that you all had a great World Ocean Day and perhaps were able to celebrate the day by exploring the ocean through OOI online data.
Bring the Ocean into Your Home: Exploration is one click away
When the HMS Challenger set sail in 1872, researchers made discoveries that laid the foundation of the science of oceanography. These early scientists couldn’t have imagined that more than a century later, the secrets of the sea could be discovered by almost anyone, even those thousands of miles from the coastline.
Today with the National Science Foundation (NSF)-funded Ocean Observatories Initiative (OOI), the ocean is accessible 24 hours a day, 7 days a week to anyone with an Internet connection.

“The OOI is placing as much ocean data online as possible and making it available in real-time,” says Roger Wakimoto, NSF Assistant Director for Geosciences. “In addition to scientific discovery, we hope to spark the public’s interest in the sea and contribute to the safety of those who make their living on the water or vacation along the coast.”
The OOI is a permanent scientific presence in the ocean. It consists of 83 platforms with more than 830 instruments providing more than 100,000 scientific and engineering data products. These platforms and instruments are spread across seven arrays located in the Atlantic and Pacific Oceans.
The OOI Data Portal opened its doors for the first time in early January to allow users -scientists, educators, and the public – to freely access OOI data. Over the past five months, the quantity of data available and tools for downloading and plotting data have steadily increased, and the OOI continues to expand its data availability.
“Much like the Challenger crew, the OOI is employing new technology that we hope will revolutionize our understanding of the ocean,” says Greg Ulses, the OOI Director at the Consortium for Ocean Leadership, which manages the OOI Program for NSF. “We are doing that by focusing on our online data delivery. We live in a time of constant Internet connection – your computer, your tablet, your phone – so we’re giving people access to the ocean by meeting them where they are, online.”
Data from the OOI will foster scientific advancements by helping researchers gain a better understanding of earthquakes and shifts in tectonic plates; hydrothermal vent and methane seep species; climate and weather phenomena such as El Niño; ocean acidification; the upwelling that fuels productive coastal fisheries; and the links between ocean circulation and climate.
Scientists aren’t the only ones benefitting from the OOI. A suite of online tools, including data visualization exercises and lesson plans, allows educators to engage students in scientific inquiry on oceanographic concepts. In addition, commercial or recreational fishers may monitor offshore conditions by checking data from nearby buoys.
Anyone with an Internet connection can download and view plots of OOI data from all arrays, or watch a live-streaming, high-definition video from a hydrothermal vent 250 miles off the coast of Oregon.
Tales of krakens, whirlpools, and passages to foreign lands have long united people and kindled interest in the mysterious forces of the sea. This year on World Oceans Day and beyond, celebrate by connecting with the ocean live – without even getting wet.
[button link="http://www.nsf.gov/news/news_summ.jsp?cntn_id=138708&org=NSF&from=news" bg_color="#00a9dd" border="#004377" class="bigbutton"]Full Story[/button]Current OOI Data Availability
Streaming data from OOI cabled assets (Cabled and Endurance Array) can now be viewed online, in near-real time, through the Data Portal plotting feature. All the data ingested into OOINet continues to be available for plotting in the OOI Data Portal. Please note that ingestion is an early step in the full data flow process and these data have not yet gone through the quality control process. To view what has been ingested, click here to access the operator status tool. Asynchronous downloads of NetCDF files have also been enabled on the OOI Data Portal.
On the OOI Website, links can be found to download raw data sets through an online repository. Please note that in the coming weeks, as we continue to update our raw data delivery mechanisms, these OPeNDAP links may change. Additionally, data sets continue to be downloadable through the THREDDS Server and are now organized by array. Data are currently available for all arrays and include several comprehensive data sets for individual gliders, moorings, and profilers. Live Video from Axial Seamount can be viewed online every 3-hours and previously recorded videos can be downloaded from the archive.
Historical cruise data are available for download from the OOI website. And we continue to provide interim delivery of the Cabled Array seismometer and bottom pressure data through IRIS http://www.iris.edu/hq/. Delivery of Cabled Array tilt meter and co-located temperature plots continue through Dr. Bill Chadwick’s website.
Recent Deployments
Endurance Array maintenance cruise departed Newport OR May 4th on the R/V Thomas Thompson. Over the course of 14 days the crew successfully recovered and re-deployed six surface moorings and one wire-following profiler mooring. Additionally one surface piercing profiler mooring was deployed along with three coastal gliders.
[media-caption type="image" path="/wp-content/uploads/2016/06/IMG_5669-623x350.jpg" alt="Coastal Endurance Washington Inshore Surface Piercing Profiler Mooring pierces calm surface waters after deployment. Photo Credit: Jon Fram and Linda Fayler, Oregon State University" link="#"]Coastal Endurance Washington Inshore Surface Piercing Profiler Mooring pierces calm surface waters after deployment. Photo Credit: Jon Fram and Linda Fayler, Oregon State University[/media-caption]Pioneer Array 6 Cruise on the R/V Neil Armstrong out of Woods Hole Oceanographic Institution was a success with the recovery and re-deployment of Pioneer Array moorings and gliders. The cruise was made up of three legs spanning from May 12th to June 2nd. Separating the cruise into legs was essential to allow for enough space on the ship to house the eight recovered moorings and one glider as well as the nine moorings and four gliders set for deployment. In addition to the infrastructure maintenance activities, two AUVs were tested during the cruise, running missions in the area of the moored array.
Read MoreWorld Oceans Day: Bring the seas into your home; exploration is one click away
When the HMS Challenger set sail in 1872, researchers made discoveries that laid the foundation of the science of oceanography. These early scientists couldn’t have imagined that more than a century later, the secrets of the sea could be discovered by almost anyone, even those thousands of miles from the coastline.
Today with the National Science Foundation (NSF)-funded Ocean Observatories Initiative (OOI), the ocean is accessible 24 hours a day, 7 days a week to anyone with an Internet connection.
“The OOI is placing as much ocean data online as possible and making it available in real-time,” says Roger Wakimoto, NSF Assistant Director for Geosciences. “In addition to scientific discovery, we hope to spark the public’s interest in the sea and contribute to the safety of those who make their living on the water or vacation along the coast.”
Permanent scientific presence
The OOI is a permanent scientific presence in the ocean. It consists of 83 platforms with more than 830 instruments providing more than 100,000 scientific and engineering data products. These platforms and instruments are spread across seven arrays located in the Atlantic and Pacific Oceans.
The OOI Data Portal opened its doors for the first time in early January to allow users -scientists, educators, and the public – to freely access OOI data. Over the past five months, the quantity of data available and tools for downloading and plotting data have steadily increased, and the OOI continues to expand its data availability.
“Much like the Challenger crew, the OOI is employing new technology that we hope will revolutionize our understanding of the ocean,” says Greg Ulses, the OOI Director at the Consortium for Ocean Leadership, which manages the OOI Program for NSF. “We are doing that by focusing on our online data delivery. We live in a time of constant Internet connection – your computer, your tablet, your phone – so we’re giving people access to the ocean by meeting them where they are, online.”
Data from the OOI will foster scientific advancements by helping researchers gain a better understanding of earthquakes and shifts in tectonic plates; hydrothermal vent and methane seep species; climate and weather phenomena such as El Niño; ocean acidification; the upwelling that fuels productive coastal fisheries; and the links between ocean circulation and climate.
Benefits to public
Scientists aren’t the only ones benefitting from the OOI. A suite of online tools, including data visualization exercises and lesson plans, allows educators to engage students in scientific inquiry on oceanographic concepts. In addition, commercial or recreational fishers may monitor offshore conditions by checking data from nearby buoys.
Anyone with an Internet connection can download and view plots of OOI data from all arrays, or watch a live-streaming, high-definition video from a hydrothermal vent 250 miles off the coast of Oregon.
Tales of krakens, whirlpools, and passages to foreign lands have long united people and kindled interest in the mysterious forces of the sea. This year on World Oceans Day and beyond, celebrate by connecting with the ocean live – without even getting wet.
More about the OOI
The OOI is a network of platforms and sensors that track the oceans’ physical, chemical, geological, and biological properties from the seafloor to the sea surface. The OOI consists of seven arrays located across the North and South Atlantic and Pacific, including one cabled, two coastal, and four global arrays. Using undersea robotics, moorings, fiber-optic cables, and specialized instrumentation, the OOI links technology and advanced engineering capabilities to an intricate cyberinfrastructure, bringing ocean observing data to shore. In the decades ahead, oceanographers, educators, and the public will use the observatory and its components to conduct research and interact with the ocean in a way never before possible.
Funding for the Ocean Observatories Initiative is provided by the National Science Foundation through a Cooperative Agreement with the Consortium for Ocean Leadership. The Consortium for Ocean Leadership has overseen the construction and initial operations of the OOI through meaningful partnerships with WHOI, OSU, UW, and Rutgers. The OOI is an integrated infrastructure of science-driven platforms and sensor systems that measure physical, chemical, geological, and biological properties and processes from the seafloor to the sea surface. OOI data are made available free of charge to the user communities of oceanographers, scientists, educators, and to the public; some data are provided in near-real time.
For more information on the OOI please visit the OOI Website or follow us on Facebook and Twitter.
About NSF
The National Science Foundation (NSF) is an independent federal agency that supports fundamental research and education across all fields of science and engineering. In fiscal year (FY) 2016, its budget is $7.5 billion. NSF funds reach all 50 states through grants to nearly 2,000 colleges, universities and other institutions. Each year, NSF receives more than 48,000 competitive proposals for funding and makes about 12,000 new funding awards. NSF also awards about $626 million in professional and service contracts yearly.
Cross-posted from NSF Press Release 16-062.
Media Contacts
Cheryl Dybas
National Science Foundation
(703) 292-7734
cdybas@nsf.gov
Leslie Smith
Consortium for Ocean Leadership
(202) 787-1613
lsmith@oceanleadership.org
Nature Magazine, Vol 534
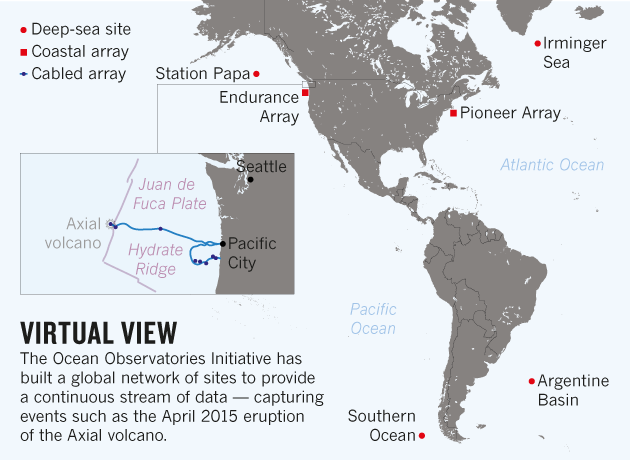
(From Nature Magazine / By Alexandra Witze) US ocean-observing project launches at last. Network of deep-water observatories streams data in real time.
[media-caption type="image" path="/wp-content/uploads/2016/06/nature-ocean-observatories-initiative-map-NEW-WEB-1.png" alt="from Nature Magazine (doi:10.1038/534159a)" link="#"]from Nature Magazine (doi:10.1038/534159a)[/media-caption]Nearly 10 years, US$386 million and many grey hairs after it got the go-ahead, an enormous US ocean-observing network is finally up and running.
On 6 June, the National Science Foundation (NSF) announced that most data are now flowing in real time from the Ocean Observatories Initiative (OOI), a collection of seven instrumented arrays. Oceanographers have the chance to test whether the technologically complex and scientifically unprecedented project will ultimately be worth it.
“It has been stressful,” says Richard Murray, the NSF’s director for ocean sciences. “It’s not for the faint-hearted.”
The raw data streams came online in April — months behind schedule, in part because of a 2014 switch between university subcontractors.
Through an open-records request, Nature obtained more than 1,200 pages of e-mails between project managers at the NSF and the Consortium for Ocean Leadership in Washington DC, which built the observatory. The records reveal an extraordinary level of tension throughout 2014 and into early 2015, as the final instruments were installed in the water and the contract for handling the data streams was switched from the University of California, San Diego, to Rutgers University in New Brunswick, New Jersey.
“Please excuse my display of stress in this email, but the InBox is overflowing with high-priority, short-fuse items — none of which deserve to be ignored — but all of which cannot be completed within the requested time frames,” Timothy Cowles, then programme director at the Consortium for Ocean Leadership, wrote to the NSF in January 2014.
The NSF cited cost overruns and performance delays in changing the cyberinfrastructure contract later that year. In April 2015, an underwater volcano laden with OOI instruments erupted, just as scientists had predicted — but the live data were not yet flowing to the wider scientific community.
Sea change
Now, about 85% of OOI data are available in real time on the project’s website, with the percentage growing every week, says Greg Ulses, the current programme director at the Consortium for Ocean Leadership. The information — on factors such as temperature and salinity — streams from more than 900 sensors at the 7 sites.
The OOI consists of one high-tech cable on the tectonically active sea floor of the northeast Pacific Ocean, together with two lines of oceanographic instruments — one off the US east coast and the other off the west coast — and four high-latitude sites, near Greenland, Alaska, Argentina and Chile. Each array involves a combination of instruments, from basic salinity sensors to sophisticated underwater gliders.
The NSF built the network as a community resource, hoping to stimulate an era of virtual oceanography in which scientists explore real-time data sets open to all.
“We know the data are valuable,” says Lisa Campbell, a biological oceanographer at Texas A&M University in College Station. “How to implement it is what we’re working on.”
Those involved in the OOI’s painful birth are happy to see it working at last. “When I finally got through and saw the real-time data, I shouted so loud someone had to come down the hall and close the door,” says Glen Gawarkiewicz, a physical oceanographer at the Woods Hole Oceanographic Institution in Massachusetts.
The array off the coast of Massachusetts has already captured some unprecedented observations, he says. In 2014, it measured air–sea fluxes when a hurricane passed overhead. The following winter, it measured dramatic shifts in the boundary at which shallow waters interact with deep ones. “That has tremendous practical implications, because there’s a lot of commercial fishing in that area,” Gawarkiewicz says. Using OOI data, he is now working with local fishers to share real-time information on changes in temperature and currents.
The west-coast array has studied a warm blob of water linked to weather patterns that are strengthening the ongoing drought in California. And in the North Atlantic, off the coast of Greenland, OOI scientists have coordinated their measurements with those of others, such as an international programme to measure heat flow in this key region. “These are high-scientific-value sites that we have dreamed about, and now we have occupied them,” says Robert Weller, a physical oceanographer at the Woods Hole Oceanographic Institution.
….
[button link="http://www.nature.com/news/us-ocean-observing-project-launches-at-last-1.20031"]Read Full Article[/button]
Nature 534, 159–160 (09 June 2016) doi:10.1038/534159a
Read MoreOOI Monthly Update – April 2016
Letter from the Director
OOI User Community and Colleagues,
Welcome to another edition of our OOI Monthly Newsletter. In this edition we’re going to continue to highlight the great work being done by the OOI CI and Data Teams. As I’ve discussed in previous newsletters our primary focus remains completing the roll out of the full data delivery capability of our OOI Cyber Infrastructure (CI). However, even as that work continues more data is continually coming on line and being made available through the OOI data portal. In this issue you’ll find another detailed update of current data availability. We’ll be continually adding accessible data to the portal until we complete the development of the final CI data delivery baseline in late May.
Speaking of data delivery, I’d like to call out special attention to our first featured news article which highlights an early and major “win” for the Data and CI Teams: the release of raw OOI data through the data portal. This critical capability has been much in demand from our user community, and we’ve already seen a strong and steady pull of raw data since our team made it available in April. Get on the data portal and have a look!
You’ll also see in this month’s newsletter that May will mark the start of the annual “cruise season” for OOI, when our Implementing Organizations head to sea to replace OOI instruments as a regular part of life cycle management. One constant in OOI is that every team involved will always stay busy!
Thanks everyone, for your continued interest in OOI. Please continue to use our data portal, and keep the great feedback coming in to the HelpDesk. Your ongoing inputs are critical for us to identify and correct errors and make continual improvements to the data portal and other areas on the OOI website. Stay with us, and stay engaged.
-Greg
Featured News
Raw Data Now Available for Download
Raw Data Access for all OOI Arrays is now available from the OOI Website, and can be accessed here. Further details and file organization structure information can be found on the OOI website.
Welcome Aboard the R/V Neil Armstrong
Welcome the newest member of the nation’s research vessel fleet, the R/V Neil Armstrong! Christened after the legendary explorer Neil Armstrong, the new ship will seek to follow his legacy of exploration and scientific discovery.
The OOI was excited to be amongst the first to use this vessel as the R/V Armstrong recovered two OOI Moorings during its “Science Verification III (SVC III)” Cruise from Virginia to Woods Hole, MA. These moorings were the Coastal Pioneer Array Central Surface Mooring and Upstream Inshore Profiler Mooring located on the continental shelf south of Martha’s Vineyard.
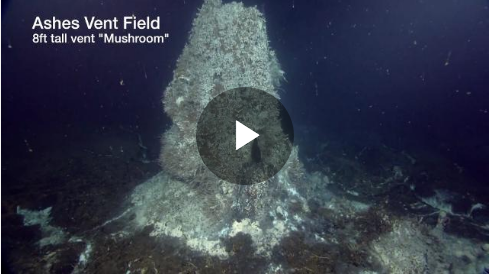
Live Video from Axial Seamount
Every 3-hours from 250 miles off the Oregon coast, and 1 mile underwater, HD video streams in live over the Internet through the OOI’s Cabled Array in situ camera system. Live video streams of a ~14 ft tall, actively venting hydrothermal vent occur during the hours of 2:00, 5:00, 8:00, and 11:00 ET & PT day and night, for a duration of 14 minutes.
Current OOI Data Availability
Streaming data from OOI cabled assets (Cabled and Endurance Array) can now be viewed online, in near-real time, through the Data Portal plotting feature. All the data ingested into OOINet continues to be available for plotting in the OOI Data Portal. Please note that ingestion is an early step in the full data flow process and these data have not yet gone through the quality control process. To view what has been ingested, click here to access the operator status tool. Asynchronous downloads of NetCDF files have also been enabled on the OOI Data Portal.
On the OOI Website, links can be found to download raw data sets through an online repository. Please note that in the coming weeks, as we continue to update our raw data delivery mechanisms, these OPeNDAP links may change. Additionally, data sets continue to be downloadable through the THREDDS Server and are now organized by array. Data are currently available for all arrays and include several comprehensive data sets for individual gliders, moorings, and profilers. Live Video from Axial Seamount can be viewed online every 3-hours and previously recorded videos can be downloaded from the archive.
Historical cruise data are available for download from the OOI website. And we continue to provide interim delivery of the Cabled Array seismometer and bottom pressure data through IRIS http://www.iris.edu/hq/. Delivery of Cabled Array tilt meter and co-located temperature plots continue through Dr. Bill Chadwick’s website.
Upcoming Deployments
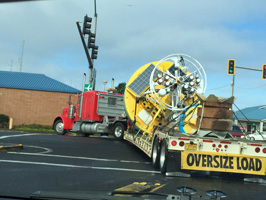
 Endurance Array maintenance cruise will depart Newport OR May 5th on the R/V Thomas Thompson. This deployment is part of the twice-per-year maintenance cruises to turn around the coastal arrays off Newport, Oregon, and Grays Harbor, Washington. To get to the coast from Corvallis, the moorings head down the 101, catching a ride on a tractor trailer.>
Pioneer Array 6 Cruise on the R/V Neil Armstrong will depart Woods Hole Oceanographic Institution on May 12 for a recovery/turn of OOI moorings and gliders.
Read MoreOOI Status Update: Raw Data Now Available
Raw Data Access for all OOI Arrays is now available from the OOI Website, and can be accessed here.
Files within this page are organized using the following file hierarchy:
-
- Uncabled Assets: Site –> Deployment (e.g. D00001) –> Data Logger –> Instrument/Profiler
- Cabled Assets: Site –> Node
For help translating the directory structure, please refer to the list of Site-Platform Codes and Instrument Class Codes.
“Raw” indicates data as they are received directly from the instrument, in instrument-specific format. They may, depending on the instrument, contain data for multiple sensors (interleaved), be in native sensor units (e.g., counts, volts) or have some processing steps already performed. Some of the configuration files associated with the raw data streams are included with those data in the raw data repository.
Please note that though all OOI Raw Data are stored by OOI, they may be available through another website, such as the low-frequency hydrophones and seismometer data, which is available via the IRIS website.
OOI platform and instrument metadata and calibration data to supplement these raw data are accessible via the Asset Management page of the OOI Data Portal.
Additional information can be found on the Raw Data page. If you are not able to find what you are looking for or having any questions, please ask the HelpDesk.
Read MoreWelcome Aboard the R/V Neil Armstrong
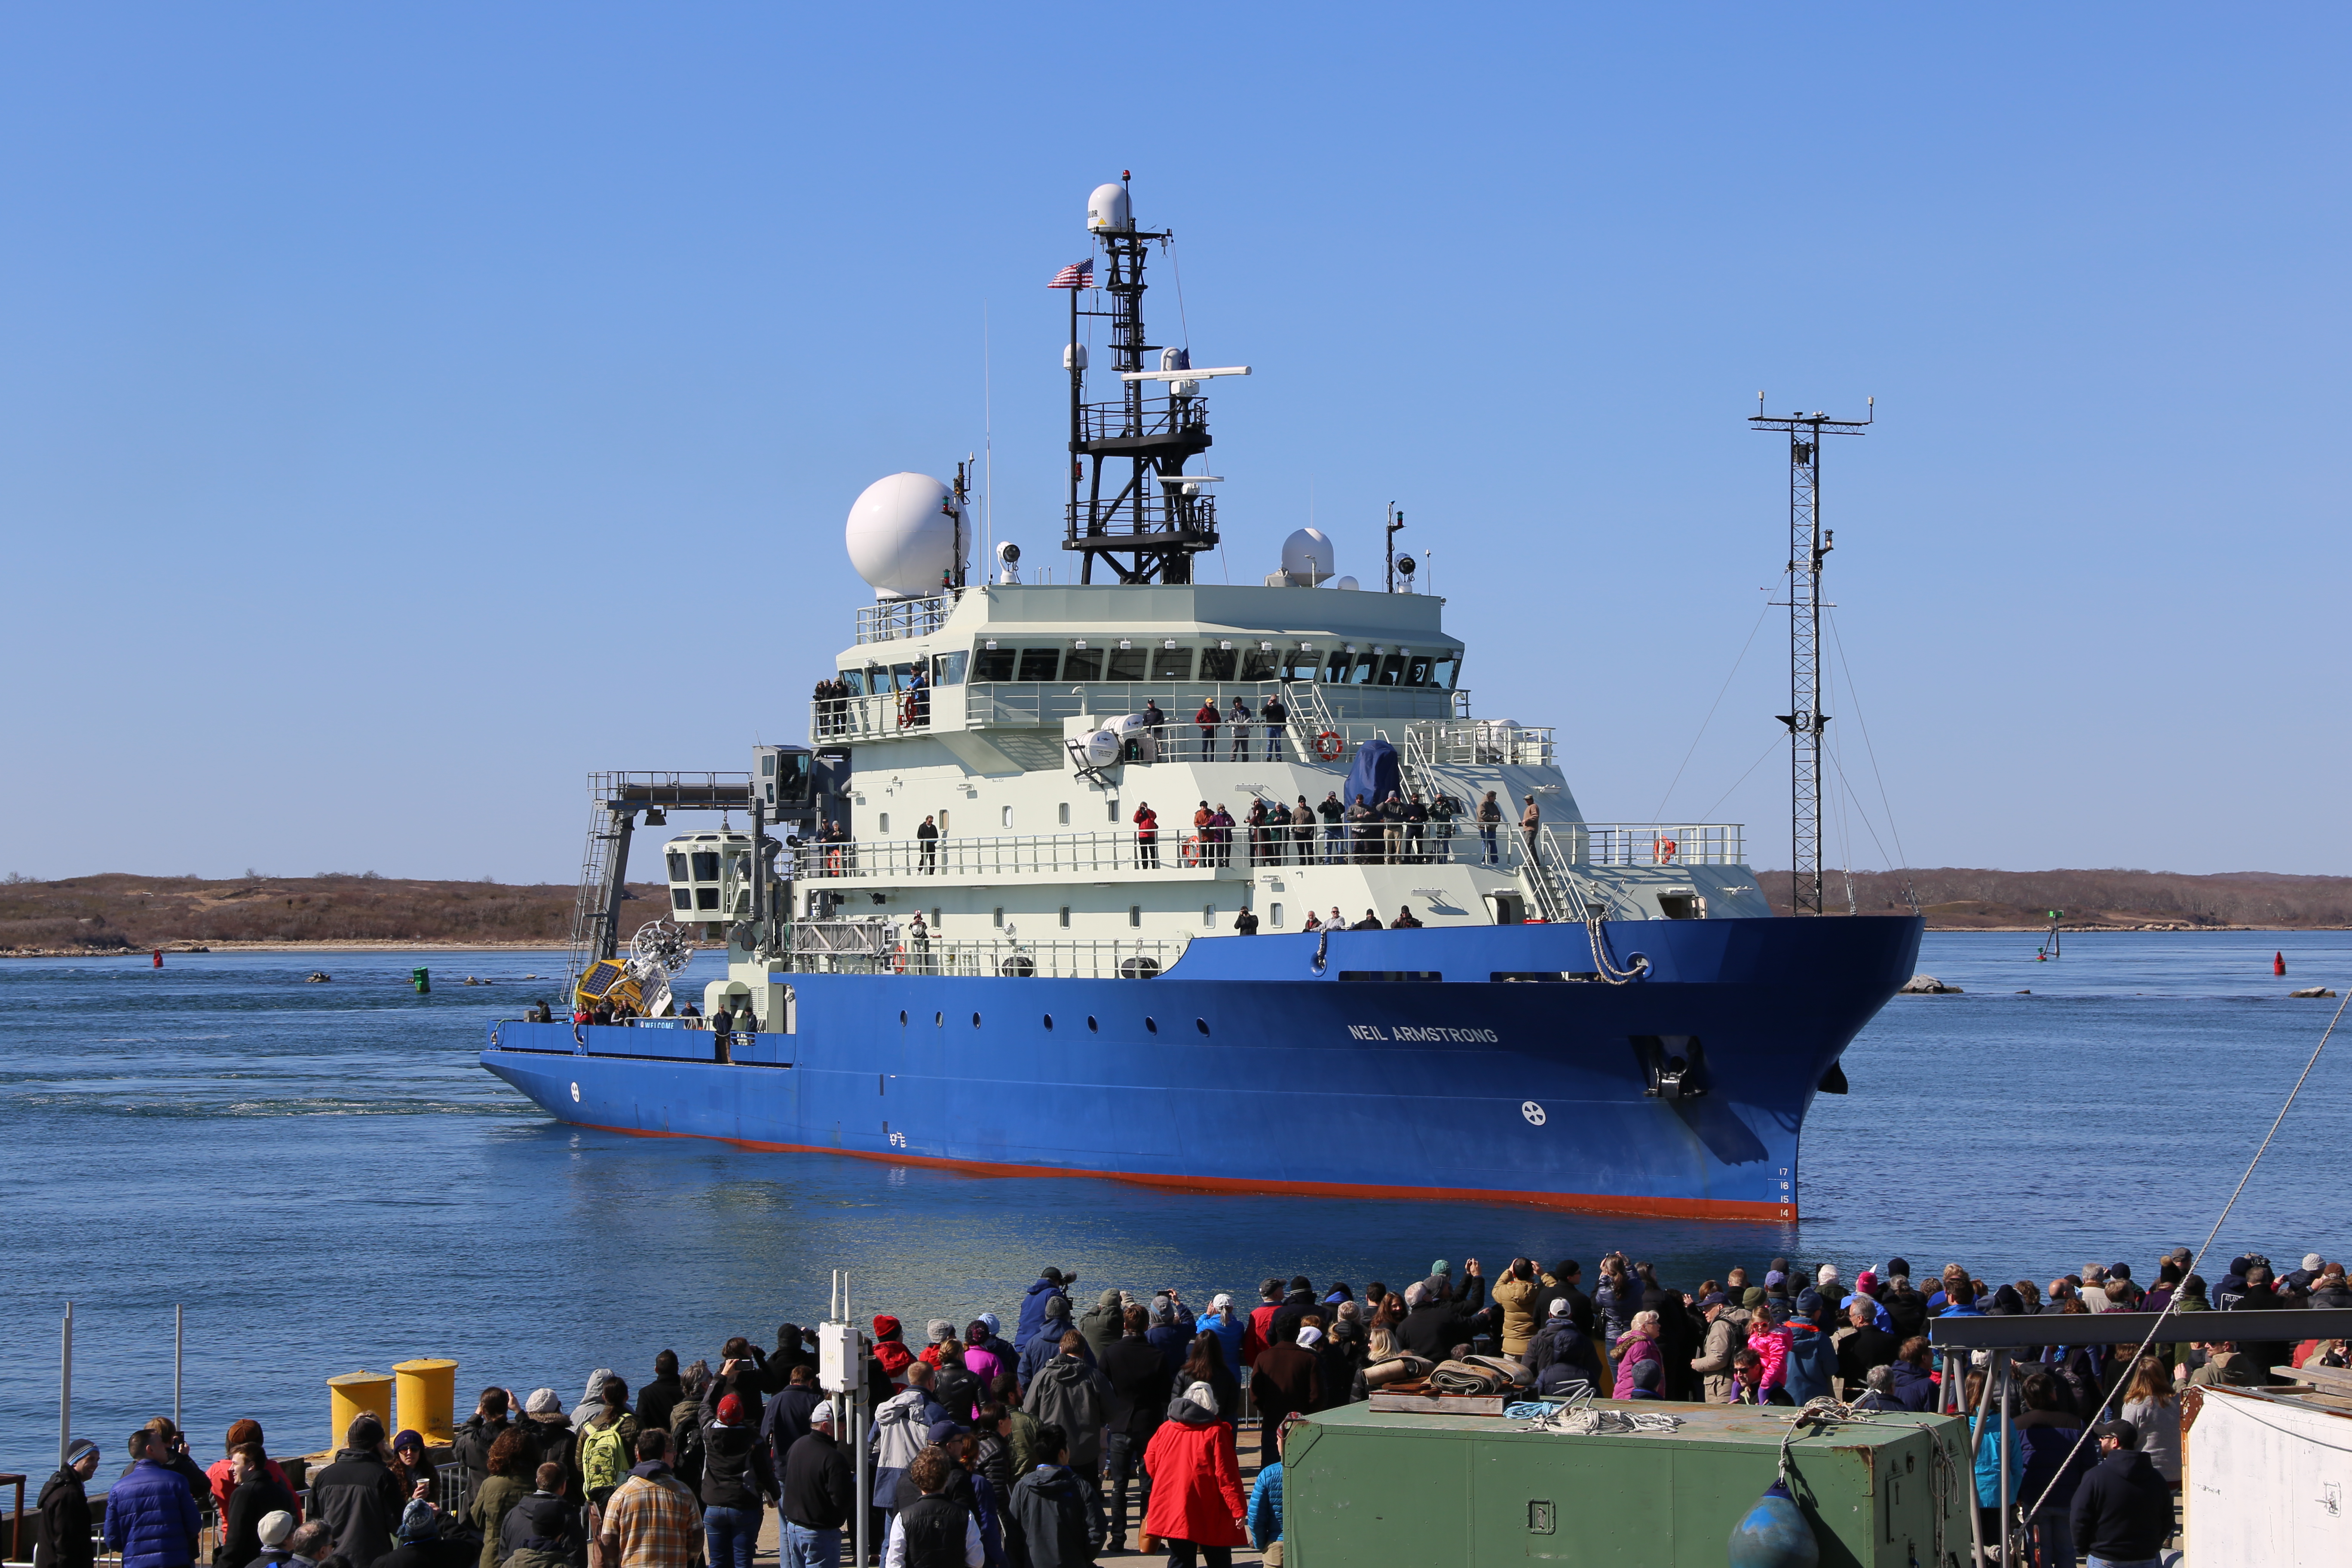
Welcome the newest member of the nation’s research vessel fleet, the R/V Neil Armstrong! Christened after the legendary explorer Neil Armstrong, the new ship will seek to follow his legacy of exploration and scientific discovery. Capable of ranging up to 11,500 nautical miles, the Neil Armstrong is 238 feet long, is equipped with two full-sized labs, and can support up to 44 scientists and crew.
The Ocean Observatories Initiative (OOI) is excited to be amongst the first to use this vessel as the R/V Armstrong recovered two OOI Moorings during its “Science Verification III (SVC III)” Cruise from Virginia to Woods Hole, MA. These moorings were the Coastal Pioneer Array Central Surface Mooring and Upstream Inshore Profiler Mooring located on the continental shelf south of Martha’s Vineyard.
Home-ported at the Woods Hole Oceanographic Institution, the Armstrong will be enlisted for future Pioneer Array maintenance cruises, as well as cruises to the Global Irminger Sea Array southeast of Greenland.
The Coastal Pioneer and Global Irminger Sea Arrays are the OOI’s two arrays in the North Atlantic. The Coastal Pioneer Array is one of two coastal arrays and is located along the continental shelf-break front off the coast of New England. The Pioneer Array’s oceanographic and meteorological observations from the highly productive region along the continental shelf-break off the coast of New England. This array allows scientists and educators to examine several important coastal processes, including shelf break fronts, frontal upwelling, and the role of filaments and eddies in cross-shelf exchange of parameters such as nutrients, heat, and biomass.
The Global Irminger Sea Array is one of four global sites in the OOI focusing on the critical, yet under-sampled, high-latitude regions of the Pacific and Atlantic. It includes a network of moorings that will support sensors for measurement of air-sea fluxes of heat, moisture and momentum; physical, biological and chemical properties throughout the water column.
The OOI, a project funded by the National Science Foundation, is an integrated infrastructure of science-driven platforms and sensor systems that measure physical, chemical, geological, and biological properties and processes from the seafloor to the sea surface. It was designed to provide data to address scientific challenges such as climate and ecosystem health.
Please continue to visit the OOI Website for the latest news on the program, sign up for our Mailing List, or submit comments or question through the HelpDesk.
Read MoreOOI Monthly Update – March 2016
Letter from the Director
OOI User Community and Colleagues,
Welcome to this inaugural edition of our OOI Monthly Newsletter. I hope that you all will enjoy it as much and find it as useful as I did! As you’ll see in this edition the OOI Team remains hard at work. Our primary focus remains completing the roll out of the full data delivery capability of our OOI Cyberinfrastructure (CI). However, even as that work continues more data is continually coming online and being made available through the OOI Data Portal. You’ll find a detailed update of current data availability in this issue, as well as an update on the overall state of our CI work. We’ll be continually adding accessible data to the portal until we complete the development of the final CI data delivery baseline in late May.
Finally, I’d like to call attention to a call out for support we’ve issued this week to any members of the OOI User Community who are subject matter experts on sensors used within the OOI, and who would be interested in providing us with some volunteer assistance. Our data team and Science Oversight Committee members are engaged in ongoing work to evaluate and validate OOI data streams and instruments. In addition to and in support of this effort we are looking for some volunteer assistance from subject matter experts to conduct some targeted validation work on select OOI instruments. Please review the details below, and let us know if you’re interested in helping out.
Thanks everyone, for your continued interest in the OOI. Please continue to use our data portal, and keep the great feedback coming in to the HelpDesk. Your ongoing inputs are critical for us to identify and correct errors and make continual improvements to the data portal and other areas on the OOI website. Stay with us, and stay engaged.
Featured News
Call For Assistance from OOI Sensor Subject Matter Experts
The OOI is requesting assistance from OOI sensor Subject Matter Experts (SMEs) who are interested in supporting an ongoing effort to evaluate and validate OOI data streams and instruments using raw data streams from OOI instruments. This call is designed to evaluate existing data to supplement existing evaluation and validation activities (OOI Quality Control Protocols and Procedures) and to help the OOI improve at-sea and post-recovery procedures based on the latest information from subject matter experts.
SME volunteers will be provided with raw data streams from select instruments identified by the OOI Science Oversight Committee (SOC) as priority instruments most in need of validation. SMEs will be asked to analyze the raw data to both validate proper operation of the instrument and evaluate and validate the content of the data.
To volunteer, please contact the HelpDesk – help@oceanobservatories.org
-Full Story-
Cyberinfrastructure Update
The Cyberinfrastructure Team has been working to increase data download capabilities from the OOI Data Portal (OOINet) and the OOI website. Currently, users can plot and download science data, access cruise reports and shipboard data, and view streaming video from the ocean floor. Additionally, new in March, asynchronous download of NetCDF files has been enabled, and the OOI Data Team is working to increase the datasets available through this mechanism. Raw Data for all arrays will be available from the OOI by April 8, via a link on the OOI website.
Several impending software and GUI improvements are still being tested on the test server, including: direct .csv download, association of pressure and latitude/longitude with all glider and profiler data points, and compression and file naming improvements to NetCDF files. These changes are scheduled to go live next week.
Thank you to everyone who has tried out the OOINet system and sent us feedback! Your input is of great value to the program as we continue to update the system and fix any errors that arise. There are currently over 300 users registered with the OOI Data Portal. From these users we have received close to 200 HelpDesk tickets this year and we have been able to resolve over 80% of these tickets. The remaining are being addressed in upcoming software and GUI upgrades. For those of you who have not logged in yet, check it out and let us know what you think!
Current OOI Data Availabilty
Streaming data from OOI cabled assets (Cabled and Endurance Array) can now be viewed online, in near-real time, through the Data Portal plotting feature. All the data ingested into OOINet continues to be available for plotting in the OOI Data Portal. Please note that ingestion is an early step in the full data flow process and these data have not yet gone through the quality control process. To view what has been ingested, click here to access the operator status tool. Asynchronous downloads of NetCDF files have also been enabled on the OOI Data Portal. Please note that we are working to increase the availability of datasets through asynchronous downloads. Some of the more complex datasets, like the Optical Attenuation and Absorption data, are not available at this time.
On the OOI Website, links can be found to download large format data sets, including HD video files from ASHES through an OPeNDAP server. Please note that in the coming weeks, as we continue to update our raw data delivery mechanisms, these OPeNDAP links may change. Additionally, data sets continue to be downloadable through the THREDDS Server and are now organized by array. Data are currently available for all arrays and include several comprehensive data sets for individual gliders, moorings, and profilers.
Historical cruise data are available for download from the OOI website. And we continue to provide interim delivery of the Cabled Array seismometer and bottom pressure data through IRIS http://www.iris.edu/hq/. Delivery of Cabled Array tilt meter and co-located temperature plots continue through Dr. Bill Chadwick’s website.
Read MoreCoastal & Global Array Overview Webinar March 3rd
Date: Thursday, March 3rd
Time: 3:30pm Eastern/12:30pm Pacific
The CGSN and EA teams will host a Webinar Thursday, March 3rd at 3:30 pm ET to present an overview of the Coastal Pioneer, uncabled Coastal Endurance and Global Array infrastructure. This is will cover the configuration of the Array, descriptions of the various platforms, and engineering details including power, communications, etc. A brief opportunity to answer questions will also be available. The session is scheduled to last up to 2 hours.
National Science Foundation Dear Colleague Letter: February 9, 2016
This week, the Ocean Sciences Division of the National Science Foundation (NSF/OCE) released an important update on OOI. As part of a previously planned and anticipated series of events connected with the transition of OOI from construction to operations NSF/OCE will carry out a recompetition to manage and operate the Ocean Observatories Initiative. Details below.
The Ocean Sciences Division of the National Science Foundation (NSF/OCE) will carry out a recompetition to manage and operate the Ocean Observatories Initiative (OOI) through an open, merit-based external peer-review process. The forthcoming solicitation is expected to result in award of a five to ten-year Cooperative Agreement (CA) for the management and operation of the OOI.
[button link="http://www.nsf.gov/publications/pub_summ.jsp?ods_key=nsf16041"]For additional information visit website[/button] Read MoreStaff Consultations Next Week: Coastal and Global Arrays
OOI Operations Staff are available to meet with potential investigators who wish to submit proposals to deploy instruments on the OOI. Investigators can schedule an appointment to meet virtually with OOI Operations Staff to discuss technical requirements, testing, and answer any other questions researchers might have regarding adding instrumentation to the OOI arrays.
For more information, check out the Staff Consultations page.
Pioneer and Endurance Array meetings are scheduled for Feb. 2-3. Global Array meetings are scheduled for Feb. 4-5. The following times are currently available. (all times are Eastern).
Pioneer and Endurance Array One-on-One Meetings
Times listed in bold are available for the Pioneer and/or Endurance Array. Other times are for the Pioneer Array only.
Tuesday, February 2: 0900, 1000, 1100, 1300, 1400 1500
Wednesday, February 3: 0900, 1000, 1100, 1600
Global Array One-on-One Meetings
Thursday, February 4: 0900, 1000, 1100, 1300, 1400 1500
Friday, February 5: 0900, 1000, 1100, 1300, 1400 1500
Please contact the HelpDesk with your top 2 preferred times to schedule an appointment. We will send you a confirmation.
For more information, check out the Staff Consultations page.
Read More