
Posts by Leslie Smith
Updated OOI User Interface now Live for Testing & Feedback
OOI User Community and Colleagues,
We have been working on some improvements and streamlining of the OOI User Interface. Changes have been made to the format and functionality of the initial landing page, platform information pages, plotting capabilities, and data catalog. Hopefully these changes result in improved usefulness of the site and upgraded ability of users to locate and use data of interest.
[button link="https://ooiui.oceanobservatories.org/"]Preview the new OOI User Interface[/button]We are making the new site available now in order to get feedback on user experiences before it officially replaces the existing user interface.
Please send any feedback or recommendations to help@oceanobservatories.org no later than September 16th.
The site will continue to be enhanced and more capabilities will be added over the next few months as our list of planned upgrades are completed. We also plan to continue upgrading the site based on your user feedback. The existing user interface is still available (here). You may continue to send feedback after the 16th, but we will use the information we receive before then to determine how we proceed with the next phases of the new GUI rollout.
Note that the preview site is using a temporary URL (ooiui.oceanobservatories.org), when the new GUI goes live it will replace the current site (ooinet.oceanobservatories.org).
As you explore the site, please note that there are a few known issues to be aware of during testing. You are free to test any areas of the site, but there is already work underway on the following items:
- Landing page array maps are being updated to include detailed bathymetry and as-designed locations of individual platforms to provide a better idea of where assets are deployed.
- While searching through the data, you may encounter some blank location, depth, or deployment fields. This is due to an overhaul of asset management information behind the scenes.
- Plotting of acoustic data (e.g. ADCP) using binned pseudocolor plots is a work in progress. The option is available, but results may not be formatted correctly.
- Currently only parameters from a single data stream can be shown on a single plot. If you attempt to add parameters from another instrument or multiple streams, you will receive an error message indicating the lack of interpolation functionality.
- Platform-level visualization of status information for instruments in the water using a standard color-code is in progress but not yet implemented.
- A History and Status page for mobile assets (gliders and AUVs) is under construction. This page will allow for visualization of ideal glider lines and actual glider tracks based on GPS position.
- A site tour overlay for the new site’s functionality is being prepared, and will be added to based on your feedback.
Thank you,
OOI Graphical User Interface Team
OOI scientists and Data Team to present at MTS/IEEE Oceans 16 Meeting
Scientists and engineers from the OOI Marine Implementing Organizations (MIOs) and the OOI Data Team are gearing up to present at the 2016 MTS/IEEE Oceans conference in Monterey Bay, CA September 19 – 22, 2016.
The event is set to draw an international audience of more than 2,000 attendees. The conference will center around presentations and posters from over 500 professionally reviewed technical papers, including those submitted by OOI scientists and engineers.
We look forward to connecting with you all at the conference.
OOI Related Presentations
Tuesday Sept. 20
1:30-3:00, Marriott: San Francisco
- Wilcock, W.D.S., D.A. Schmidt, J.E. Vidale, M.J. Harrington, P. Boudin, et al. Designing an Offshore Geophysical Network in the Pacific Northwest for Earthquake and Tsunami Early Warning and Hazard Research
Manalang, D., and J.R. Delaney. Axial Seamount – Restless, Wired and Occupied: A Conceptual overview of Resident AUV Operations and Technologies.
Kelley, D.S., J.R. Delaney, and the Cabled Array Team. NSF’s Cabled Array: A Wired Tectonic Plate and Overlying Ocean
5:30-5:00, Marriott: San Francisco
- McRae, E. Continuous Real Time Scanning of the Upper Ocean Water Column.
Wednesday Sept. 21
10:30-12:00, Portola: Cotton Wood 2
- Philip, B.T., D.S. Kelley, E.A.Solomon, and J.R. Delaney. Monitoring Methane Emissions at Southern Hydrate Ridge using an OOI Cabled Array Acoustic Doppler Current Profiler.
1:30-3:00, Marriott: Santa Barbara
- Delaney, J.R., D.S. Kelley, A. Marburg, M. Stoermer, H. Hadaway, K. Juniper, and F. Knuth. Axial Seamount – Wired and Restless: A Cabled Submarine Network Enables Real-time tracking of a Mid-Ocean Ridge Eruption and Live Video of an Active Hydrothermal System Juan de Fuca Ridge, NE Pacific
Thursday Sept. 22
8:30-10:00, Marriott: Santa Barbara
- Marburg, A., and K. Bigham. Deep Learning for Benthic Fauna Identification
10:30-12:00, Portola: Cotton Wood 2
- Knuth, F., L. Belabassi, L. Garizio, M. Smith, M. Vardaro, and A. Marburg. Automated QA/QC and Time Series Analyses on OOI High-Definition Video Data
Belabbassi, L., L. Garzio, M. Smith, F. Knuth, J. Kerfoot, M. Vardaro, and M. Crowley. Successes and Lessons Learned from OOI End-to-End System Data Quality Audit
Two years of Pioneer Gliders: A track line view
In July, the OOI CGSN operations team completed another “refresh” of the Pioneer glider fleet. The nominal lifetime for OOI coastal gliders (battery limited) is 90 days. The fleet is refreshed by recovery of exhausted gliders and deployment of refurbished gliders with fresh batteries.
The Coastal Pioneer Array is designed to have 6 Coastal Gliders deployed at a time. Each glider traverses a distinct path within and around the Pioneer Array, sampling an area measuring over 24,000 km2, roughly the size of New Hampshire.
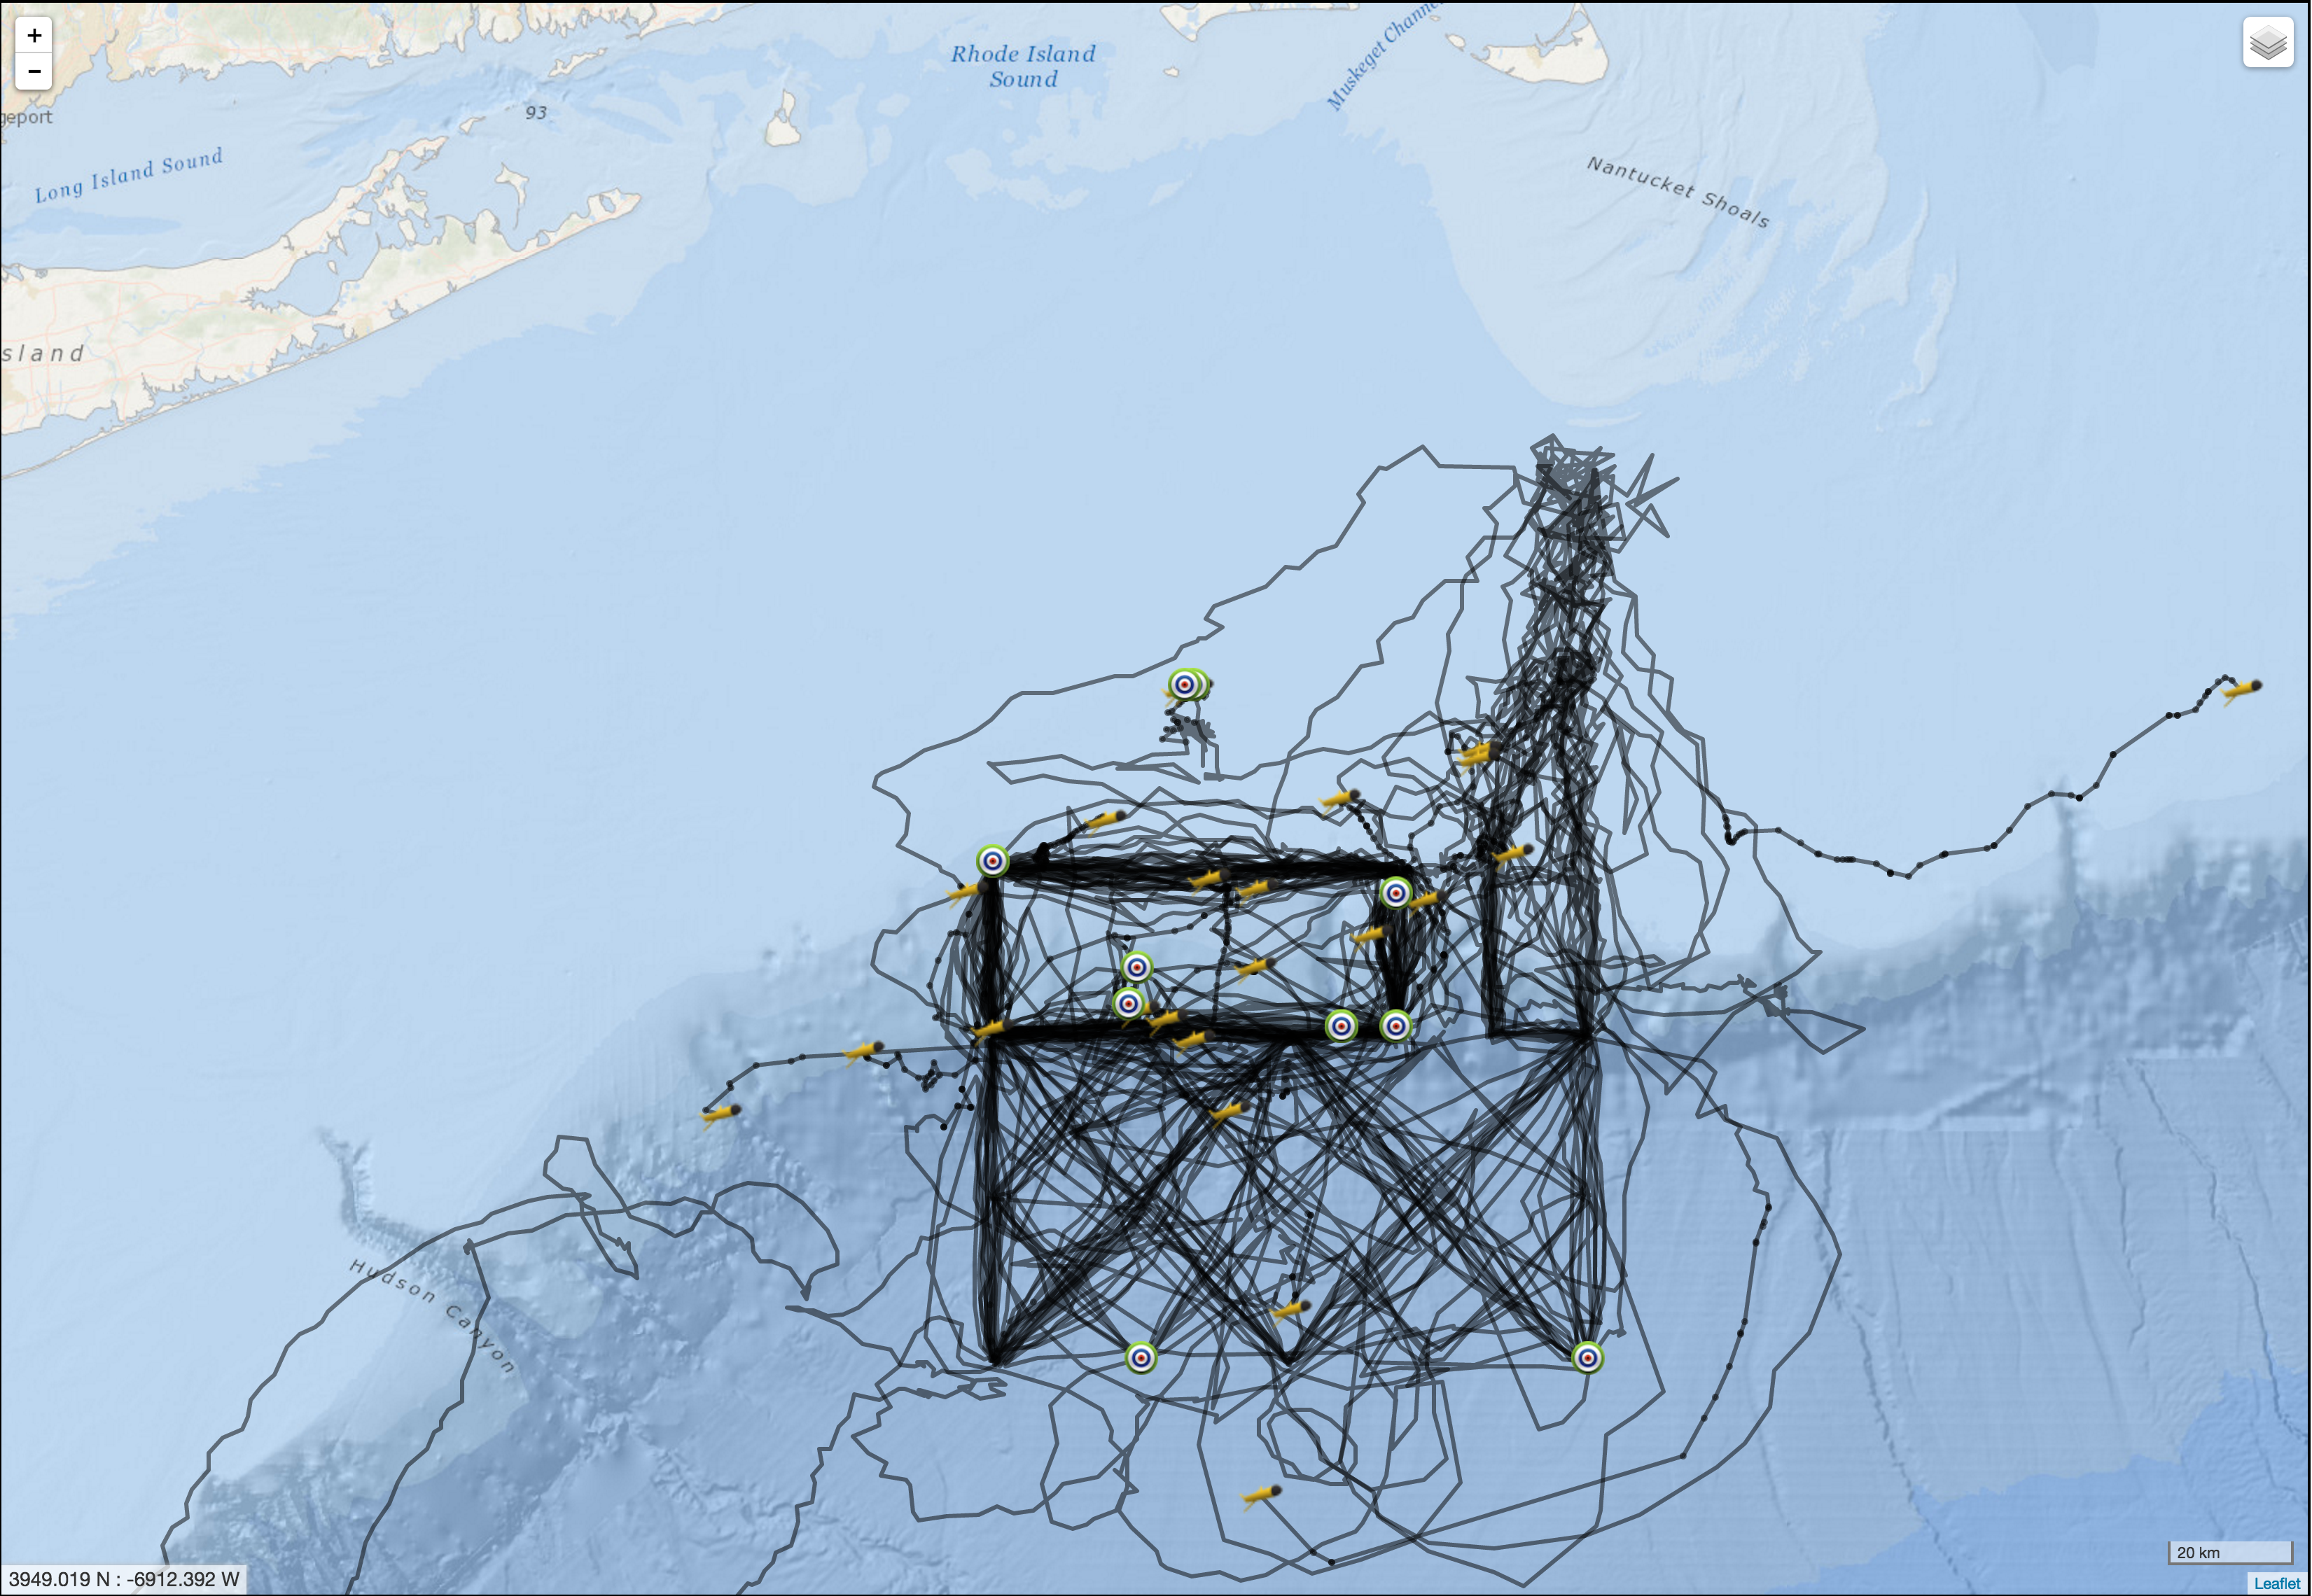
The first three Pioneer Array Coastal Gliders were deployed just over two years ago in May 2014. The map on the right shows a composite of the tracks of all the gliders deployed at Pioneer since those initial deployments.
The impressive results of glider piloting in the complex coastal environment are evidenced by the match between the composite tracks (right) and the planned tracks (left). The tracks that diverge from the plan show the difficulty of maintaining the glider navigation in the face of severe weather and strong currents.
On average, each of the 25 gliders, for which data are shown, were deployed for a duration of 66 days and travelled a distances of approximately 1200 km (750 miles). The longest deployment was 118 days and the glider travelled a distance of 2,230 km (or 1,400 miles). That is roughly the same as driving halfway across the United States!
Congrats to the Pioneer team on a job well done. This is just the beginning!
[twocol_one][caption id="attachment_10832" align="alignright" width="276"]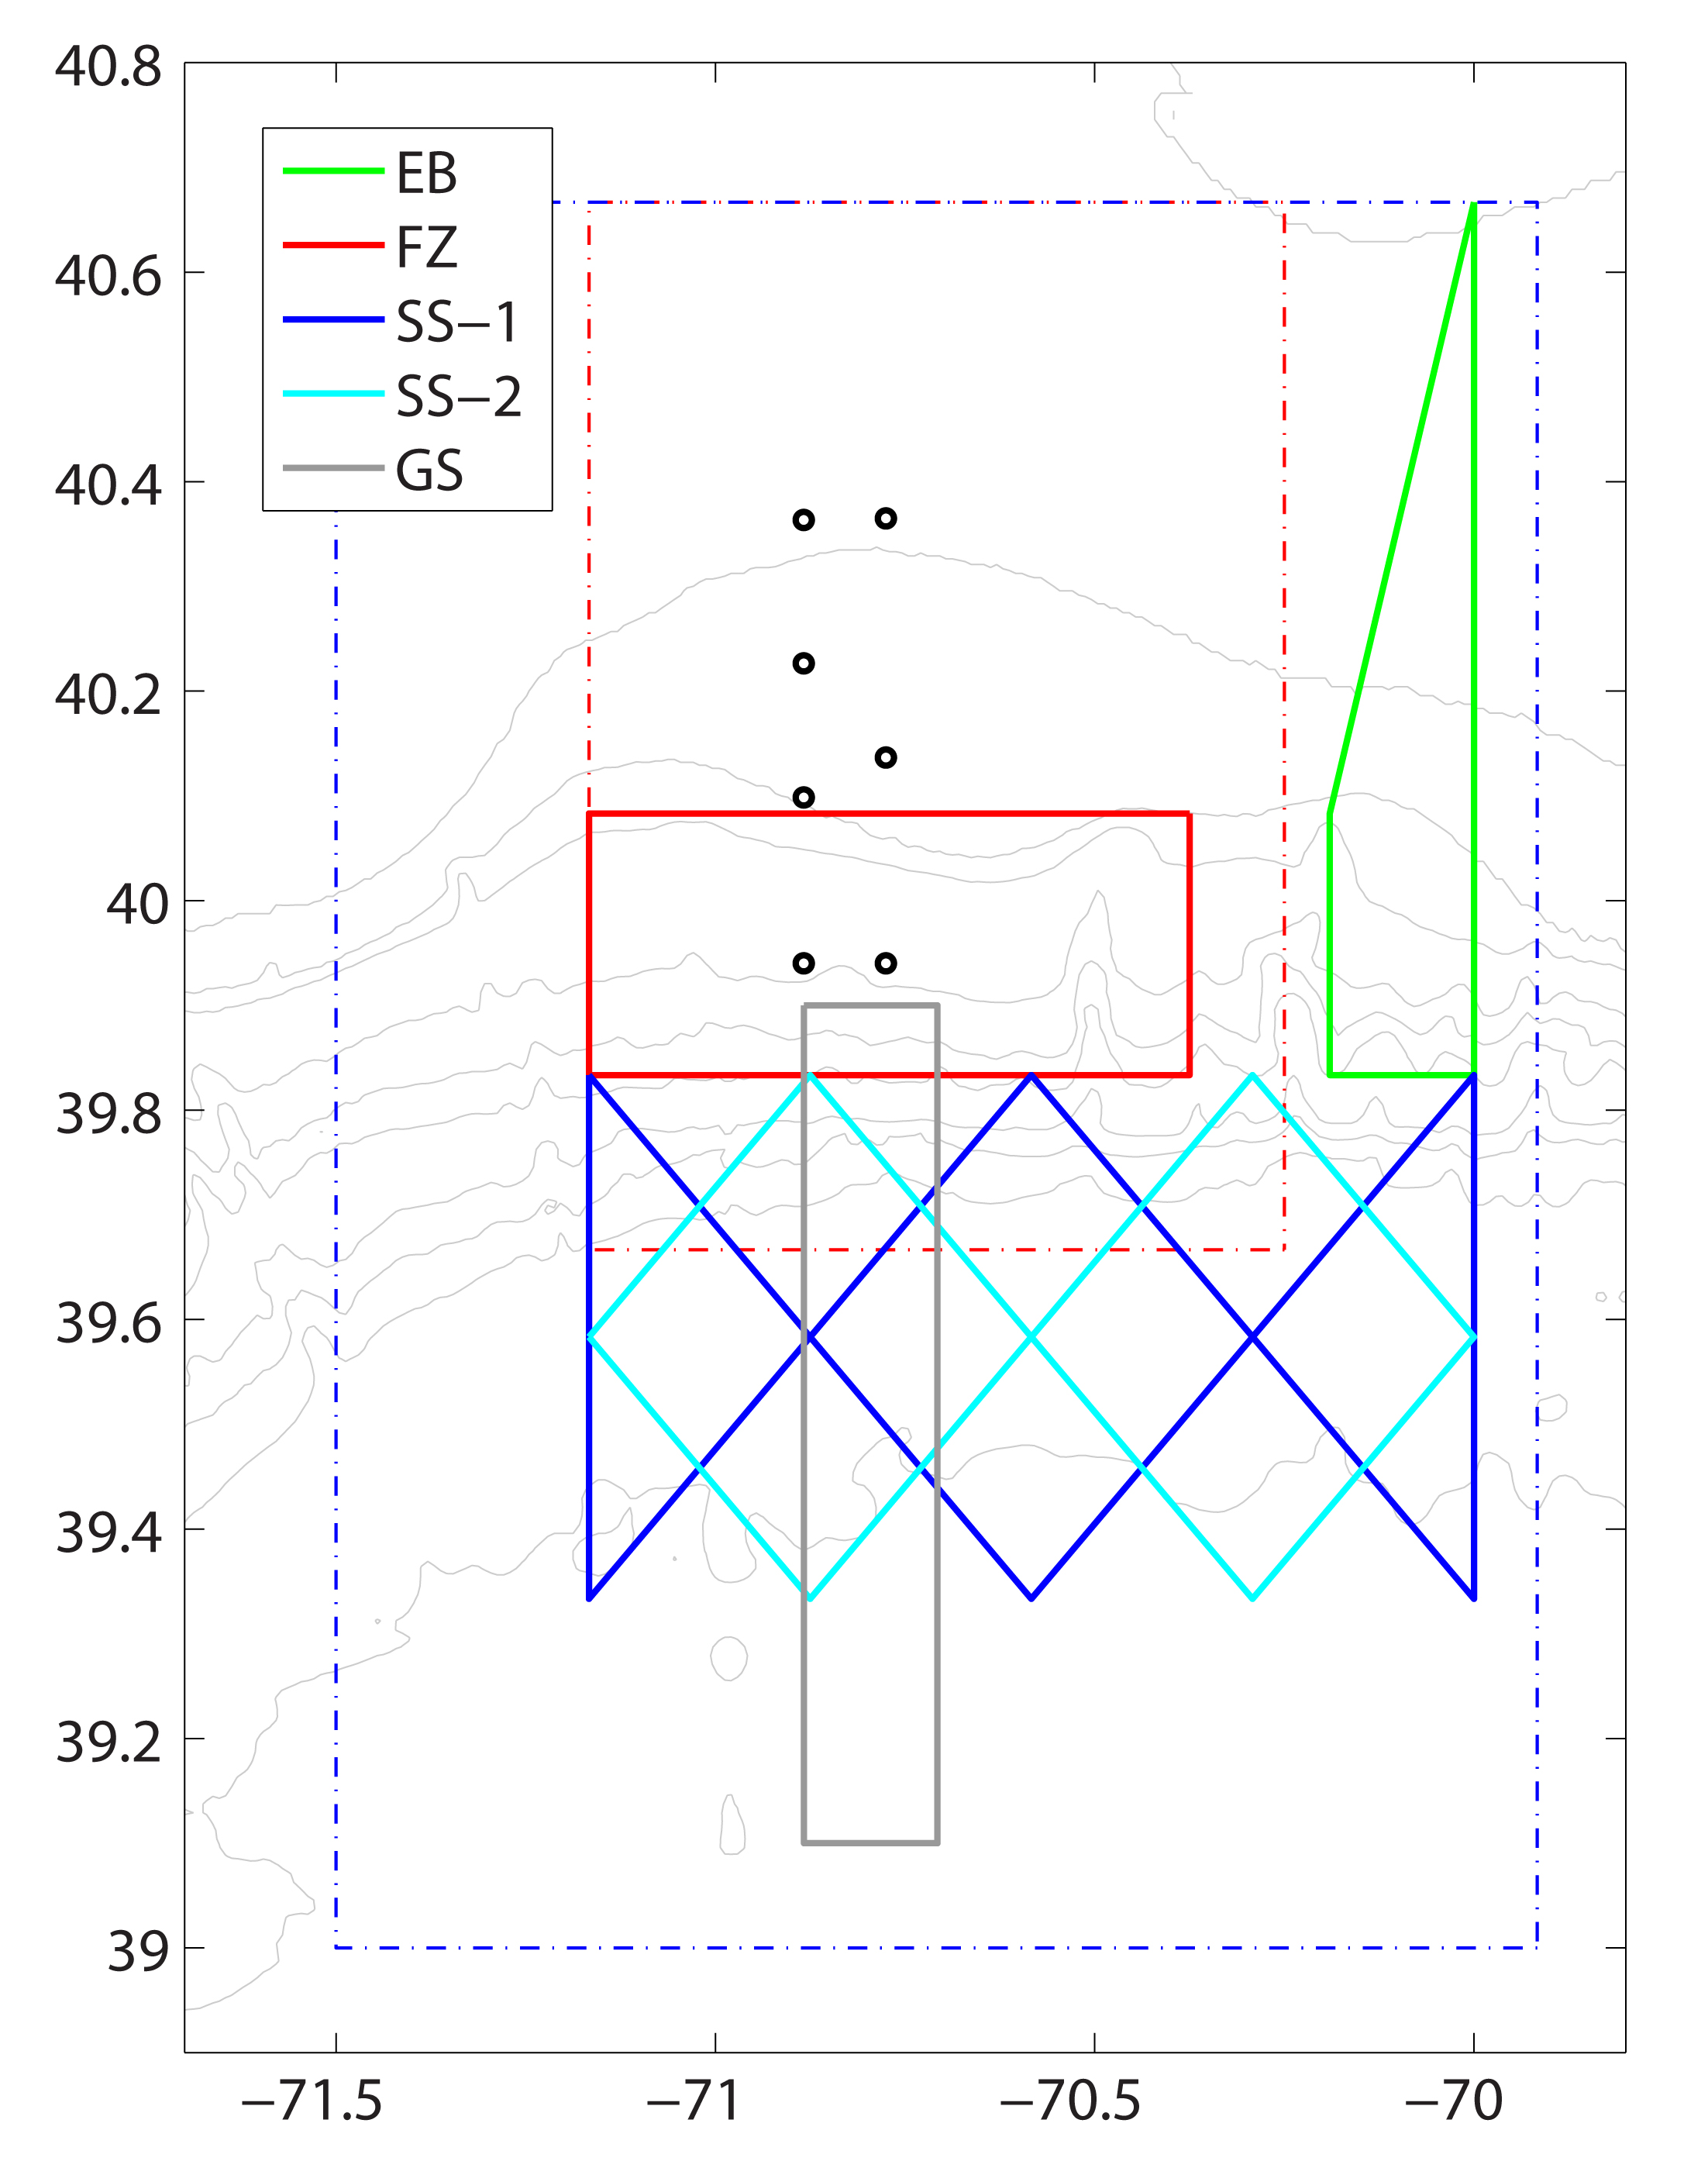 Pioneer Array gliders sample along five glider tracks off the coast of New England. The x- and y-axis are latitude and longitude in decimal degrees. Pioneer Array mooring sites are represented by circles. Boundaries of the glider and AUV operating areas are represented by the blue and red dashed lines, respectively. The five glider tracks are represented by the solid color lines:
-Eastern Boundary (EB) green
-Frontal Zone (FZ) red. Note: two gliders occupy this track
-Slope Sea: SS-1 blue; SS-2 cyan
-Gulf Stream (GS) gray[/caption]
[/twocol_one] [twocol_one_last]
[caption id="attachment_10715" align="aligncenter" width="507"] Each line represents the path of one glider. Glider symbols are the last location of the glider before recovery, green dots represent deployment locations.[/caption]
[/twocol_one_last] Read More
Observing the Oceans, a Photo Tour
Woods Hole Oceanographic Institution (WHOI), the Marine Implementing Organization for the OOI Coastal Pioneer and Global Arrays has created a photo tour of their journey with the OOI from the development and design of these arrays to the completion of construction.
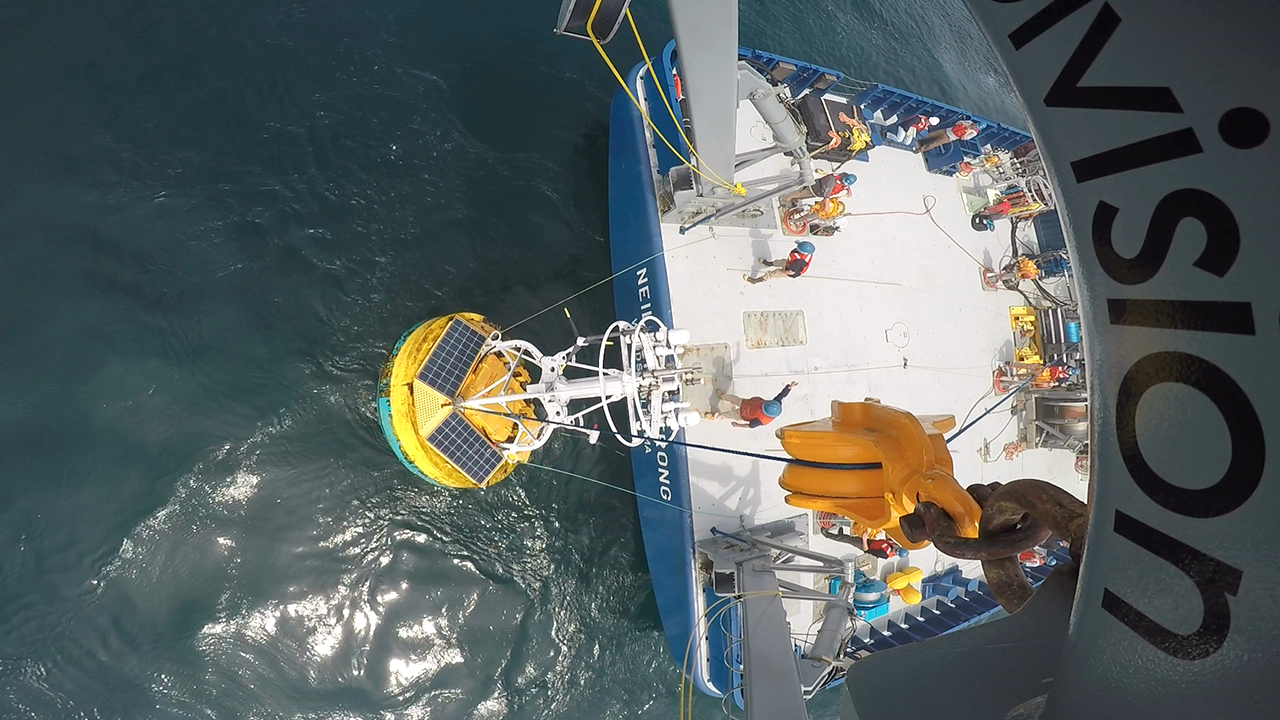
[media-caption type="image" path="/wp-content/uploads/2016/08/000_OOI_intro_GoPro_Armstrong_Paul_Matthias_435553.jpg" alt="The Ocean Observatories Initiative is moving full speed ahead at Woods Hole Oceanographic Institution." link="https://oceanobservatories.org/2016/08/observing-the-oceans-a-photo-tour/000_ooi_intro_gopro_armstrong_paul_matthias_435553"]The Ocean Observatories Initiative is moving full speed ahead at Woods Hole Oceanographic Institution. This unprecedented ocean science project is streaming a wealth of marine data straight from the ocean to the World Wide Web, making it free for anyone to use. In the image above, an OOI coastal surface buoy is recovered from the ocean and hoisted onto the fantail of the research vessel Neil Armstrong. Photo Credit: Paul Matthias, WHOI[/media-caption] [button link="http://www.whoi.edu/visualWHOI/observing-the-ocean"]Check it out![/button] Read MoreOOI data now available from NANOOS
Northwest Association of Networked Ocean Observing Systems (NANOOS) is now serving OOI data on their NANOOS Visualization System (NVS). Data from the OOI Coastal Endurance OR and WA Line Surface Moorings can now be viewed along side other sources including NANOOS, NSF CMOP, NOAA NDBC, and CDIP.
This effort marks the beginning of the larger effort to integrate OOI data into existing public data repositories to increase user access to these data and further facilitate interdisciplinary research by putting the OOI infrastructure in the context of other data available in the area.
Stay tuned as we continue to reach out to organizations, like IOOS, to cross post our data!
Interested in what else the community is up to with OOI data? Check out the Community Resources page on our website.
Read MoreVISIONS’16 OOI Cabled Array Maintenance Cruise Begins
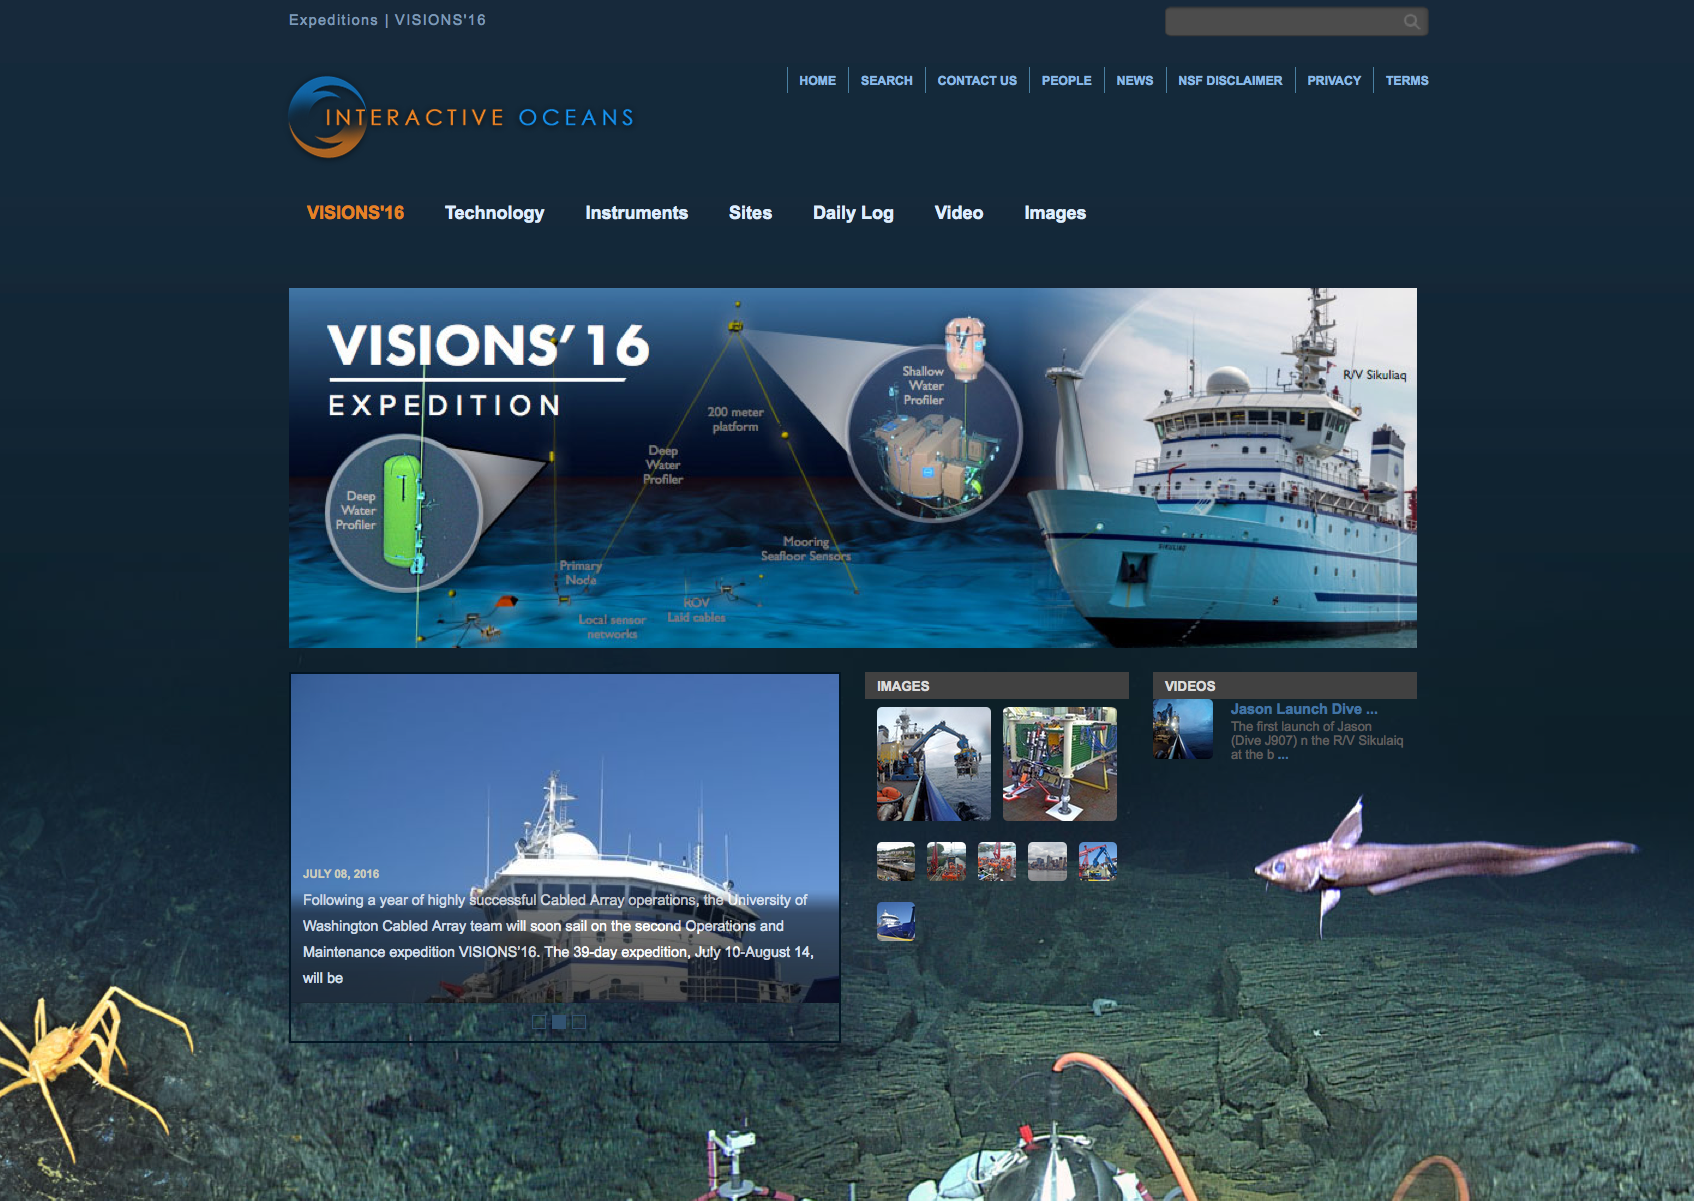
On July 10, the R/V Sikuliaq left dock at the University of Washington to begin VISIONS’16, a 39-day mission to replace and maintain elements of the Cabled Array off the coasts of Oregon and Washington. Led by Chief Scientist Deb Kelley, this is the second Operations and Maintenance cruise for the Cabled Array implementing organization, as part of the National Science Foundation’s (NSF) Ocean Observatories Initiative.
During the cruise, scientists from the University of Washington School of Oceanography within the College of the Environment and engineers from the Applied Physics Laboratory will visit all of the Cabled Array sites where they will recover, install, and test over 100 instruments and nine junction boxes. They will also recover and reinstall the Deep Profiler Moorings at the Endurance Offshore and Slope Base sites. The remotely operated vehicle (ROV) Jason will also assist in the recovery and installation of the underwater infrastructure. This is Jason’s first time supporting the Cabled Array, which required special modifications to be made to the ROV over the past year.
The three legs of the cruise will run from July 10 to August 15, 2016.
You can learn more about the cruise on the VISIONS’16 website, which includes daily cruise logs, as well as image and video galleries. You can also follow along on Twitter (@VISIONSops), where up-to-the-minute updates about activities on board are posted.
Read MoreOOI Community Workshop: Cabled, Endurance, and Station Papa
The Ocean Observatories Initiative (OOI) infrastructure is operational and ocean scientists can now integrate OOI observations into their research proposals and projects. The UNOLS Ocean Observing Science Committee (OOSC) along with OOI’s Science Oversight Committee (SOC) are organizing a workshop that will focus on current and future science addressed by the extensive OOI infrastructure in the Northeast Pacific. This includes the OOI Cabled, Endurance, and Station Papa Arrays. Early science successes from OOI will be highlighted, as well as Ocean Networks Canada (ONC) and NOAA projects focused on furthering scientific understanding of coastal and offshore processes.
The workshop will inform the oceanographic research community of the science capabilities of the Cabled Array, Endurance Coastal Array and the Station Papa Array. An overview of the OOI science themes as they relate to these Arrays will be reviewed as well as a report from Ocean Networks Canada and NOAA. An overview of the Cyber Infrastructure (CI) applications, data products, user interfaces, and system features will also be provided along with hands-on demonstrations. The workshop program will include a discussion on how to include OOI and other observational data in both proposals and publications. OOI Program Team members and NSF representatives will be on hand to answer questions and provide information on OOI operations and governance.
This community workshop will provide a forum to facilitate science collaborations and identify strategies for engaging future users of OOI. Workshop participants will have the opportunity to provide feedback on their initial experiences in working with the OOI systems and data. There will be opportunities for discussions about possible future additions of sensors and national-international partnerships.
The Workshop will be held at the University Place Hotel and Conference Center in Portland, OR on September 27-29, 2016.
(Cross posted from Maritime Professional / Joseph R. Fonseca)
[feature]The application deadline for in-person participation at the workshop has passed and we cannot accommodate additions at this time. However, you are welcome to participate in the workshop virtually via web conference. To register for web conference participation,
please complete this very brief on-line form.
[/feature] Read More
Successful SME Evaluation – Spectrophotometer (OPTAA)
Because of the great diversity of the sensor types deployed by the OOI, it is understood that the familiarity and knowledge of the OOI program scientists and the data team members may not be sufficient to fully investigate and evaluate all types of data being collected. In order to validate the data from these instruments, we reached out to the experts in the field, or as we like to call them “SMEs” (Subject Matter Experts).
For this task, the OOI team asked the SMEs to take a segment of raw data from a specific instrument, and to apply their knowledge and processing tools together with the requisite calibration, sampling, and metadata to produce a calibrated, engineering units version of the data and assess its validity. Assessing validity means answering whether or not the instrument is working properly and yielding data that is realistic. It also means examining whether or not the sampling protocol implemented for the deployment is appropriate to achieve the scientific goals of deploying that instrument.
One of the instruments examined was the WET Labs AC-S Spectrophotometer deployed on the Endurance Array Washington Offshore Surface Mooring on the west coast. Our SME for this instrument was Emmanuel Boss (University of Maine), an expert in the use of optical instrumentation to study the properties of material suspended in seawater.
With the data team’s help, Dr. Boss verified 1.5 months of data (April-May 2015) at this site with successful results. He was able to process and plot the data using the raw data and vendor calibration files from the AC-S, salinity and temperature from a collocated CTD data to correct absorption and attenuation median spectra and scattering, and data from a collocated fluorometer to cross-check the chlorophyll and POC results.
Consistency between the sensors suggests that they did not foul during the deployment. Not only did his results show that accurate data was being produced by all the sensors in question, but the AC-S (an extremely sensitive instrument normally deployed for very short periods of time) did not drift noticeably during the deployment period, a notable achievement.
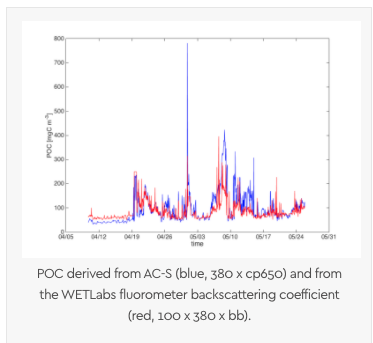
[twocol_one] [caption id="attachment_10536" align="alignnone" width="500"]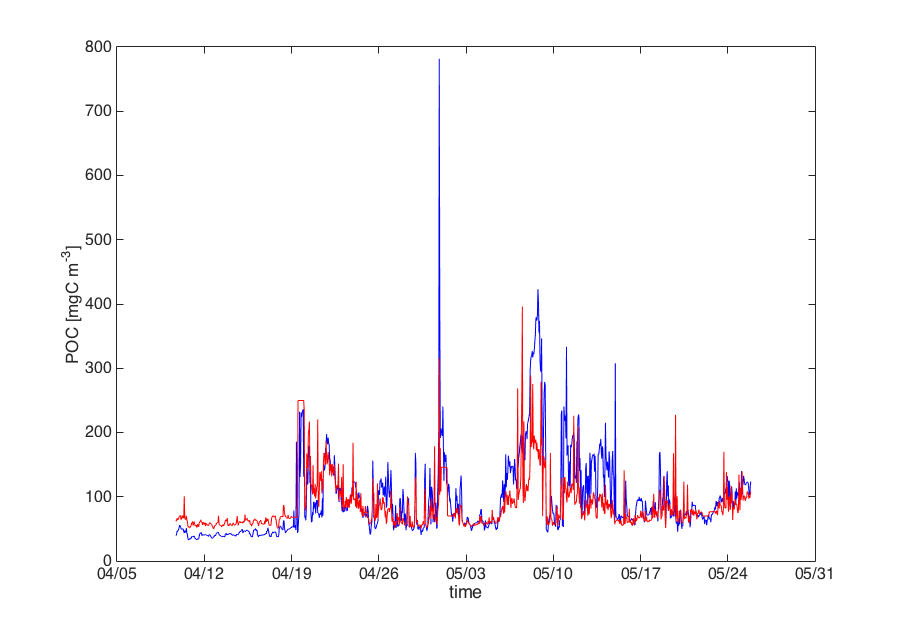 POC derived from AC-S (blue, 380 x cp650) and from the WETLabs fluorometer backscattering coefficient (red, 100 x 380 x bb).[/caption]
[/twocol_one] [twocol_one_last]
[caption id="attachment_10535" align="alignleft" width="500"]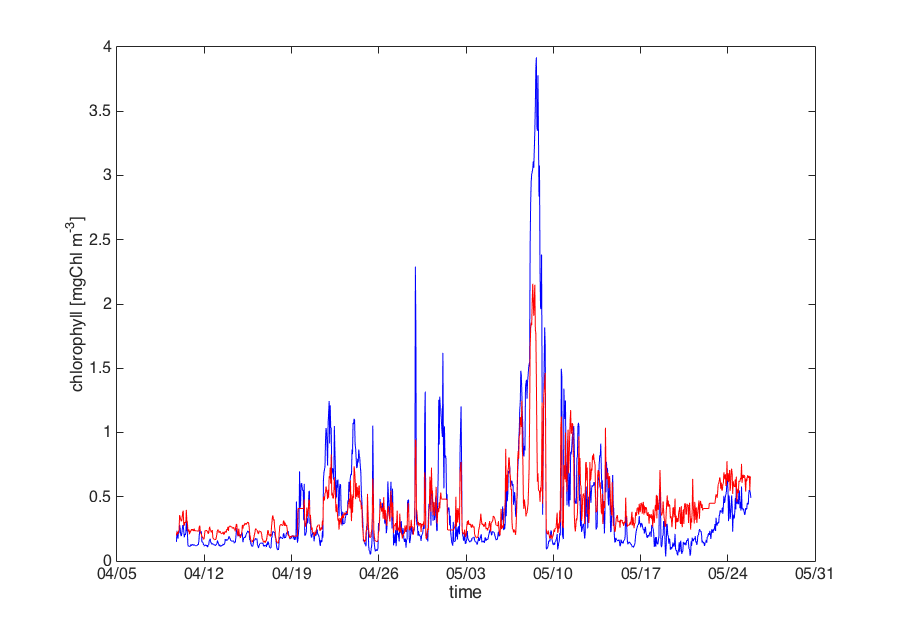 Chlorophyll based on AC-S (blue) and on a collocated WETLabs fluorometer (red, calibration x 0.5).[/caption]
[/twocol_one_last]
Dr. Boss stated “The fact that we can do this closure exercise gives me confidence that we should be able to see when fouling or drift become an issue.” He did caution that this analysis represented a very small data set at one location at a specific time, under limited ambient temperature and trophic conditions. “While very encouraging, much more work will need to be done to establish how representative it is,” he noted.
The data team is working on using these results to compare with the processed data being delivered by the OOI software, and are continuing to pursue similar efforts for additional instruments with the help of our other volunteer SMEs. We look forward to being able to tell similar success stories for other OOI instruments.
Read MoreEOS – Ocean Observatories Initiative Expands Coastal Ocean Research
An Ocean Observatories Initiative (OOI) inshore surface mooring is deployed in June 2015 off the coast of Newport, Oreg., from Oregon State University’s (OSU) R/V Pacific Storm. In the background, a team on OSU’s R/V Elakha is deploying an OOI underwater glider. Photo Credit: Andy Cripe, Corvallis Gazette-Times
[/media-caption]
(From EOS, 97) By Robinson W. Fulweiler, Glen Gawakiewicz, and Kristen A. Davis
The coastal ocean provides critical services that yield both ecological and economic benefits. Its dynamic nature, however, makes it a most challenging environment to study. Recently, a better understanding of the coupled physical, chemical, geological, and biological processes that characterize the coastal ocean became more attainable.
Ocean Observatories Initiative systems were fully commissioned as of the end of 2015.
Last January, the Ocean Observatories Initiative (OOI), a program of the National Science Foundation (NSF), held a workshop in Washington, D. C., to acquaint potential users with the capabilities offered by the OOI systems, which were fully commissioned as of the end of 2015. A future workshop is planned for this fall on the West Coast.
OOI maintains two coastal ocean arrays: the Pioneer Array in the northwest Atlantic and the Endurance Array in the northeast Pacific. Each has a series of fixed moorings spanning the continental shelf, as well as mobile assets—underwater gliders and propeller-driven autonomous underwater vehicles.
Together, these observatories are capable of resolving coastal ocean processes across a range of temporal and spatial scales. Such data are critical for understanding nutrient and carbon cycling, controls on the abundance of marine organisms, and the effects of long-term warming and extreme weather events.
At the workshop, Jack Barth (Oregon State University) and Glen Gawarkiewicz (Woods Hole Oceanographic Institution) presented preliminary results of recent studies and data collection efforts, stressing the rapid, ongoing changes in coastal ocean temperatures in the U.S. West and East Coast shelf and slope systems. Other participants discussed connections between physics and water column nutrients, the temporal variability of key shelf currents, and the role of OOI data in assessing biodiversity.
A key outcome of the workshop was the introduction of the OOI data portal, where participants acquired firsthand experience in data querying, plotting, and downloading of OOI data. Additionally, participants had numerous opportunities to provide feedback to the OOI Cyber Infrastructure Team.
Anyone can sign up for an account to gain access to OOI data. These data are now available for plotting on the OOI data portal, and select data streams are also available. These sites will be updated with additional data and downloading formats as they become available.
OOI has entered a new phase of community engagement where scientists and educators are encouraged to use the data, provide feedback on data access ease and quality, and, in the process, expand our understanding of coastal oceans.
NSF program managers from all relevant disciplines expressed their support for the arrays. Additionally, we learned the details of how to submit proposals related to OOI data, and all the proposal submission information is available on the OOI website. Workshop participants also learned about the OOI education portal, which can bring cutting-edge ocean data and ocean science concepts to classrooms and informal science education sites.
The message from NSF was clear—OOI has entered a new phase of community engagement where scientists and educators are encouraged to use these data, provide feedback on data access ease and quality, and, in the process, expand our understanding of coastal oceans. A new era is approaching in which integrated ocean observatories will help stimulate innovative science and educational partnerships at the same time they enhance our ability to understand the changes occurring in our coastal oceans.
Jack Barth and Chris Edwards contributed to the writing of this summary. We thank NSF for sponsoring this workshop and the University-National Oceanographic Laboratory System for organizing the event, with a special thanks to Larry Atkinson and Annette DeSilva for their efforts. We also thank the workshop participants and the OOI Cyber Infrastructure Team for their continued work.
—Robinson W. Fulweiler, Department of Earth and Environment and Department of Biology, Boston University, Boston, Mass.; email: rwf@bu.edu; Glen Gawakiewicz, Woods Hole Oceanographic Institution, Woods Hole, Mass.; and Kristen A. Davis, Department of Civil and Environmental Engineering, University of California, Irvine
Citation: Fulweiler, R. W., G. Gawakiewicz, and K. A. Davis (2016), Ocean Observatories Initiative expands coastal ocean research, Eos, 97, doi:10.1029/2016EO054187. Published on 20 June 2016.
Read MoreCabled Array Webinar Friday 6/24, Staff Consultations 7/6
Cabled Array Webinar
Date: Friday, June 24th
Time: 1:00pm Eastern/10:00am Pacific
Cabled Array staff will provide an overview of the Cabled Array infrastructure currently deployed as well as engineering specifics including connectors, communication capabilities, testing procedures, and general timeline. The goal of the webinar is to provide researchers interested in adding instrumentation-infrastructure onto the Cabled Array the information required to submit an NSF proposal, which includes a letter from the Cabled Array team on technical feasibility.
[button link="https://docs.google.com/forms/d/1Swd4NOgM1yF2EBxoEY-k4P-nRmBvWvejSrJbXe3_AZo/viewform?c=0&w=1"]Register for this Webinar[/button]Please Register by Thursday 6/23 12:00pm PT.
[/feature]
[feature]
Cabled Array One-on-One Meetings
Date:Wednesday, July 6th
OOI Operations Staff are available to meet with potential investigators who wish to submit proposals to deploy instruments on the OOI Cabled Array. Investigators can schedule an appointment to meet virtually with OOI Operations Staff to discuss technical requirements, testing, and answer any other questions researchers might have regarding adding instrumentation to the OOI arrays.
To sign up, please contact the HelpDesk with times you are available.
For more information, check out the Staff Consultations page.
[/feature]
Read More