News
Uncovering Changing Life in the Water Column
Oregon State University Assistant Professor Jennifer Fehrenbacher needed a ship to carry out her National Science Foundation-funded research investigating the lives of foraminifera (single-celled organisms about the size of a grain of sand and smaller) in the northern Pacific. Her work, in collaboration with Dr. Claudia Benitez-Nelson at the University of South Carolina (UofSC), involves deploying bottom-moored sediment traps and collecting plankton tows while at sea, giving researchers the opportunity to explore foraminifera that live in lighted surface waters, and how these communities have changed over time in response to the surrounding ecosystem.
Fehrenbacher found her ship. She will be joining forces with the Endurance Array Team aboard the R/V Sikuliaq during its bi-yearly expedition to recover and deploy ocean observing equipment at its array in the northeast pacific off the coast of Oregon. Fehrenbacher and her team of four researchers will join the Endurance Array 16 team in early April for the second of its two-leg expedition. This will be a continuation of her research project that began in September 2021.
Last September, Fehrenbacher’s team put in place two tandem sediment traps that are located close to the OOI Slope base node. One was deployed at about 600 meters water depth, the other slightly above the sea floor. The last sediment trap study in this region was conducted around 30 years ago, and the foraminiferal species have likely changed since then, as have ocean conditions.
[media-caption path="/wp-content/uploads/2022/03/IMG_5185-copy.jpg" link="#"]Fehrenbacher’s team will be retrieving two tandem sediment traps that are located close to the OOI Regional Cabled Array slope base node. Credit: Jennifer Fehrenbacher, OSU.[/media-caption]
The sediment traps have been collecting material in place for the past six months and will be recovered along with the Endurance 16 team’s recovery and deployment work. Once the traps are back onboard, the collecting cups will be taken off, emptied, replaced, and the traps redeployed for another six-month period. The researchers will package the collected materials for analysis at OSU and UofSC.
The team also will be examining live specimens from night-time plankton tows, taking advantage of quiet night-time hours to conduct the plankton tows when the Endurance team is unable to work safely moving large, bulky, and unwieldy equipment in and out of the ocean. “This arrangement is a win-win for everyone,” said Endurance Array Chief Scientist Ed Dever. “It maximizes the use of ship time, while helping to provide data to answer some questions about how ocean conditions are changing.”
Fehrenbacher’s team will be conducting a series of discrete new tows from the surface to about 500 meters. “While I don’t anticipate a ton of critters in the really deep water, net tows haven’t been done extensively in these waters at these depths. The last one was 30 years ago by oceanographer Alan Mix and his graduate student Joseph Ortiz, so this new work will give us insight into how life in the water column may have changed over time, “ said Fehrenbacher.
Fehrenbacher’s team will be conducting experiments with live foraminifera in a portable travel lab they will bring onboard. A number of different experiments are planned:
PhD candidate Kelsey Lane will be collecting foraminifera (shortened version “forams”) to study their genetics and their microbial communities, other species living with forams.
Graduate student Grace Meyer will be striving to measure carbon and oxygen isotopes in individual forams. She will be collecting empty shells from both the water column and sediment trap material and compare what is found in both, providing information about water column processes that could alter shells’ composition.
Postdoctoral researcher Brittany Hupp will be collecting both live forams and empty shells to study the chemistry of different types of forams, looking at their isotopes and trace metals content.
Researcher Eric Tappa, a sediment trap expert from the UofSC, will be deploying and recovering the sediment trap equipment. Tappa has been working with sediment trap moorings for decades and have proven critical in providing longer time-series records of processes occurring in overlying waters.
As lead scientist Fehrenbacher will be participating in these onboard experiments. She also will be growing forams under controlled conditions and watching them to learn how temperature modulates their shells or their behaviors during the day-night cycle, and will continue her work with recovered forams once she returns to her home lab. There she will be measuring the trace element concentrations in foram shells so results can help inform the Paleo record. . She explained, “Foram shells are used basically as proxies for environmental conditions. So when we measure trace elements in their shells, this gives us information about the pH, temperature, nutrient content, and even the salinity of the ocean in the past.” The onboard experiments help scientists under how forams incorporate these elements into their shells when they are alive, which they can use in assessing past records.
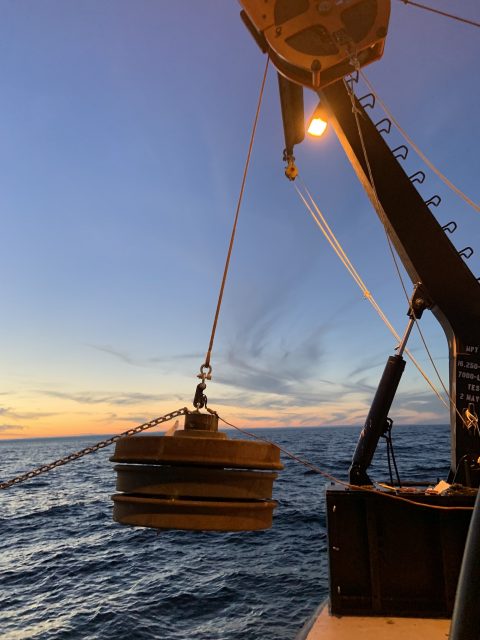
[media-caption path="/wp-content/uploads/2022/03/IMG_5196-copy.jpg" link="#"]An anchor weighing ~2500 pounds is deployed to keep a sediment trap in place for six months until it is recovered with a treasure trove of marine life and particulates for investigation. Credit: Jennifer Fehrenbacher, OSU.[/media-caption]
Challenges of studying small living things
Studying single-celled organisms is difficult on dry land, but is compounded by a moving ship in rolling seas. Fehrenbacher’s team will be taking onboard multiple microscopes, including an inverted microscope to see their subjects, water circulators to keep them at constant conditions while they are alive, and a pH meter. High-powered microscopes are critical for the work because forams range in size from smaller than a grain of sand—about 100 microns— to up to about a millimeter.
“We look at forams in a petri dish under the microscope,” explained Fehrenbacher. “This is challenging as the ship moves back and forth so does the water in the petri dish so you’re looking back and forth as the ship moves.” The researchers have come up with the solution of holding the petri dish at an angle so the water and foram stay in one place and helps prevent researchers’ sea sickness.
Fehrenbacher predicts that the amount of material collected on the Endurance Array 16 cruise will keep she and her graduate students busy for at least the next two years and beyond. She added, “There’s really just nothing quite like the type of information you can get from sediment trap studies. While going out to sea for two weeks a year and doing plankton tows are helpful, we only get information about what’s in the water column at the exact moment of collection. But sediment traps provide months’ worth of data at really high resolution that we can compare with other OOI data and get a detailed picture of ocean conditions and how those conditions affect marine life.
Read More
NSF Issues Dear Colleague Letter to Support Ocean Technical Workforce Education
The National Science Foundation (NSF) issued a “Dear Colleague Letter” (DCL) on March 14, 2022 seeking proposals for curriculum development and student engagement to support the expansion of the ocean technical workforce. Through the DCL, NSF hopes to expand the technical capacity of the U.S. workforce in high-technology fields through training programs that educate the next generation of ocean technicians, data scientists, ocean engineers, and ocean scientists.
Proposal topics of high priority include training in ocean instrumentation design, manufacturing and maintenance of marine-related hardware, and ocean data science and data analytics. Submissions are encouraged that target documented gaps in the U.S. technical workforce in marine instrumentation and manufacturing sectors, including those related to renewable energy, such as wave, tide, wind, and solar energy systems.
Full details can be found here. Proposers are encouraged to contact the program officers prior to submitting proposals or requests for supplemental funding. For questions about this DCL, please contact Elizabeth (Lisa) Rom – elrom@nsf.gov in the Division of Ocean Sciences, Jumoke Ladeji-Osias – jladejio@nsf.gov in the Directorate of Engineering, or V. Celeste Carter – vccarter@nsf.gov in the Division of Undergraduate Education.
Read More
Sixteenth Turn of the Coastal Endurance Array
A team of ten scientists and engineers will depart aboard the R/V Sikuliaq in late March for a two-week expedition to recover and redeploy ocean observing equipment at the Coastal Endurance Array. Located in the northeast Pacific off the coasts of Oregon and Washington, the Coastal Endurance Array consists of two cross-shelf moored array lines, designed to observe cross-shelf and along-shelf variability in the region.
The team will recover and deploy seven moorings. Four of the moorings are located on the Washington Shelf, with the remaining three on the Oregon Shelf. The team also will be recovering a surface piercing profiler at the Washington Shelf site and deploying four surface piercing profilers on the Washington and Oregon lines. Another goal of the team is to deploy and recover gliders so that five are in the water and continue to sample and report back data over the next three months. The gliders collect data across the shelf in shallow water down to 200 meters and also collect data offshore down to depths of 1000 meters.
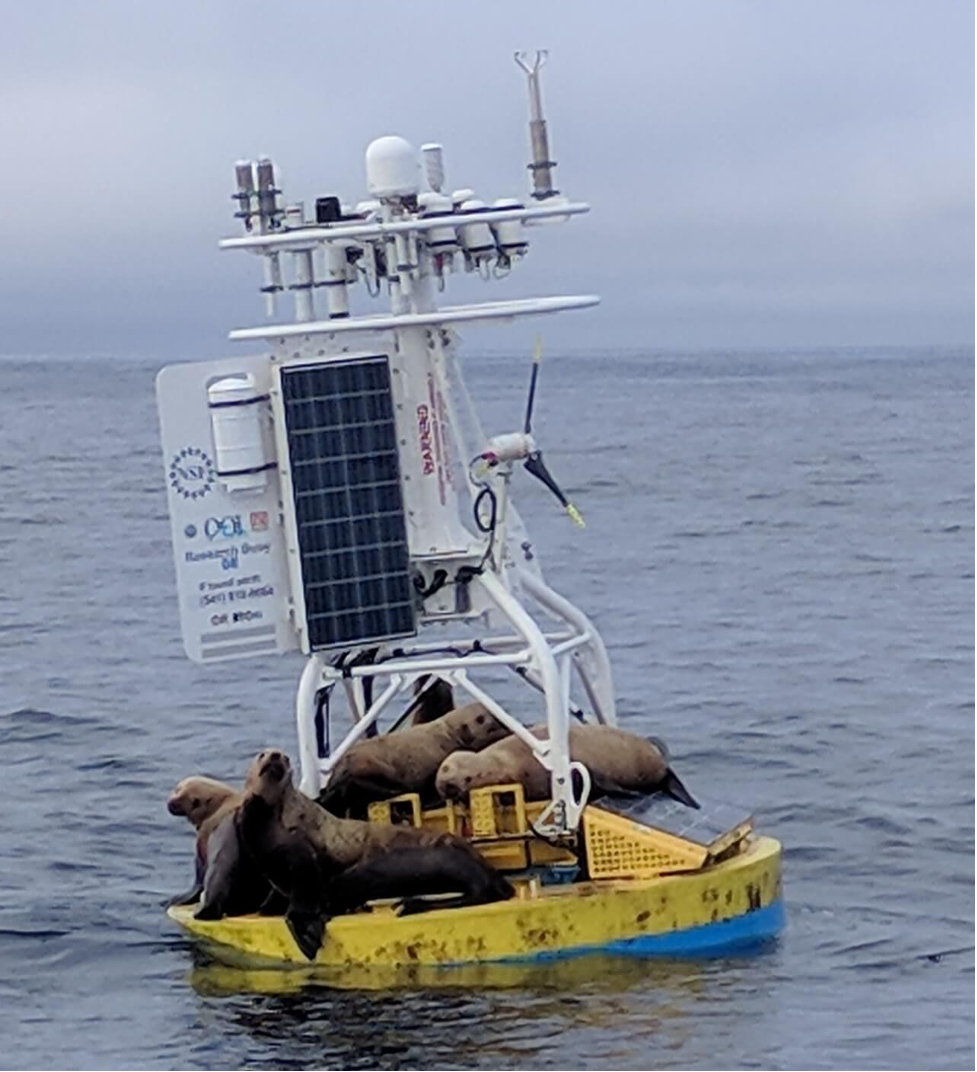
[media-caption path="/wp-content/uploads/2022/03/sea-lions.png" link="#"]The Endurance Array team has to contend with occasional visits of sea lions, which can weigh up to 1000 pounds, and who like to explore the components of the array. This expedition will be testing a re-enforce solar platform to see if can better bear the weight of these hefty and curious visitors. Credit: Endurance Array team.[/media-caption]
When not recovering and deployment equipment, members of the onboard team will be taking CTD (connectivity, temperature, and depth) casts to verify and calibrate instrumentation. Because of the quantity of the equipment to be recovered and deployed, the cruise will take place in two separate legs.
Measurements collected by this array capture the variability of ocean properties across a broad range of temporal and spatial scales. Scientists are using these data to examine ocean health issues such as hypoxia, ocean acidification, and harmful algal blooms, and changing ocean conditions such as intermittent marine heat waves.
“Every time we head out to turn the Endurance Array, the OSU team works together with folks at WHOI to improve the resilience of the gear we put out there and to improve the quality of the data collected,” said Ed Dever, Principal Investigator for the Coastal Endurance Array, serving as Chief Scientist for the Endurance 16 expedition. “It’s a tough environment. The equipment spends six months at sea, getting jostled by high waves and strong winds and serving as habitat for marine life big and small. Yet over the last eight years, we’ve continuously made improvements to the instruments and infrastructure to improve data return. It’s a real testament to the creativity and skills of the whole team. They never stop thinking about ways to make things even better.”
During the second leg of the cruise, a scientific party of five will join the expedition to collect sediment samples for an ongoing experiment led by Dr. Jennifer Fehrenbacher from Oregon State University. This specific scientific inquiry is an example of how the OOI was designed to add instrumentation and adapt sampling approaches to meet the needs of the scientific community it serves.
[media-caption path="/wp-content/uploads/2022/03/Sediment-trap.jpeg" link="#"]Dr. Jennifer Fehrenbacher’s team will be deployin this McLane Mark VII 13 cup Sediment Trap, which is used to collect a time-series of material falling through the water column. The stack of three railroad wheels (on right) are the anchor. Credit: University of South Carolina.[/media-caption]
To help answer other specific science questions, the Endurance 16 team also will be conducting sampling for researchers with instruments on the Endurance Array moorings. The team will test deployment of fish acoustic monitors on the near shore instrument frames (see picture below) of both inshore moorings and the Washington Shelf surface mooring for Taylor Chappel a researcher at Oregon State University. The team will also collect settling organisms on devices attached to multi-function nodes on the Oregon Offshore and Surface moorings for Oklahoma State researcher Ashley Burkett.
[media-caption path="/wp-content/uploads/2022/03/Endurance-mfn.png" link="#"]This Near-Surface Instrument Frame (NSIF) is an instrumented cage that is suspended below surface moorings. (7m for Coastal moorings, 12m for Global moorings). The NSIF contains subsurface oceanographic instruments attached to multiple data concentrator logger computers. During Endurance 16, fish acoustic monitors will be added to the standard equipment. Credit: Ed Dever, OSU.[/media-caption]
During this expedition, the team also will be deploying new equipment and other improvements. For example, a new anemometer, which sits at the top of the mooring to measure the wind speed will be deployed for the first time. A new camera made with off-the-shelf components will be put into field during for its first six-month deployment. And, the team will be testing the rigor of its newly reinforced solar panels, which often have to withstand the weight of the occasional visit by sea lions.
The team has followed all COVID protocols and are ready to go. They will be blogging and sharing photographs of their two-week expedition. Bookmark this page and follow along as they share their stories.
Read MoreUW Students Catalog Visual Treasures from the Undersea World
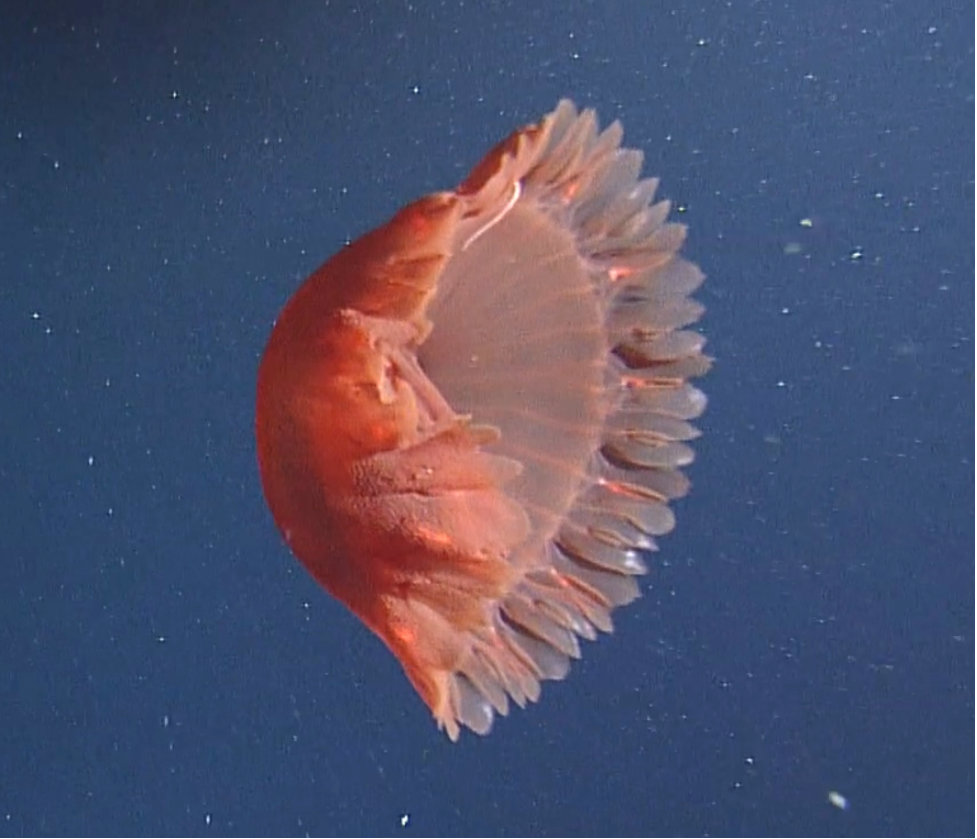
Watch a squid change color or a spider crab move out of the way of the arm of a Remotely Operated Vehicle (ROV), or have a closeup view as a deep sea skate gracefully swims over the seafloor at Axial Seamount. These are but some of the magical moments captured and cataloged by University of Washington (UW) students who have participated in the UW at-sea experiential learning program associated with the Ocean Observatories Initiative Regional Cabled Array’s (RCA) VISIONS cruises.
[media-caption path="/wp-content/uploads/2022/03/Sponge.png" link="#"]The Poralia rufescens was seen at Slope Base. It was found floating in the water column at 2867 meters. Another one was spotted swimming among the dust kicked up by ROPOS at about 2900 meters. Photo Credit: NSF-OOI/UW/CSSF; Dive 1757; V14.[/media-caption]Since 2014, a team of students has been sorting, cataloging, and making publicly available high-definition video and images captured by underwater cameras on ROVs during RCA expeditions. While the primary work of the ROVs is to recover and deploy ocean observing equipment powered by RCA’s high-power and bandwidth submarine cables that stream data live to the Internet, a side benefit is reams of footage and still images of marine life on and near the seafloor and throughout the water column collected during the ROV dives. As part of their shipboard experience during VISIONS expeditions, students stand daily watches in the ROV control labs, working alongside scientists, engineers, and the ship and ROV teams. The students help catalog and timestamp the video footage streaming live from the ROV back to the ship.
The idea for a publicly available online biology catalog was the brainchild of seven VISIONS’14 students on the cruise that year. They were prompted to develop a community resource by perpetually trying to answer the question in the control room: “What do you think that animal is?”
“The initial idea was to create a repository specific to the cabled array and specific to the sites that we visit each year to help answer that question for students and people on shore,” explained Katie Bigham, who evolved from VISIONS student to co-chief scientist for VISIONS’21 and contributed significantly to the catalog during its inception. “We first started the catalog with images and video from Axial Seamount and it grew from there. And Lottie Gonzalez, who has been on every VISIONS cruise since 2017, was instrumental in the catalog’s expansion from Axial to coastal sites.”
[media-caption path="/wp-content/uploads/2022/03/Cockatoo-Squid.png" link="#"]A cockatoo squid (Galiteuthis phyllura) encountered at 585 meters depth during a site survey between the 2-legged mooring EOM leg anchor and the low-voltage node LV01C at Endurance Oregon Offshore. The squid was red when we first encountered it, and then it turned clear as we took video. Photo Credit: NSF-OOI/UW/CSSF, Dive R1752, V14.[/media-caption]
Lottie Gonzalez was hooked on the catalog from here first time at sea. “I wasn’t really sure where to get information on relevant biology that I was seeing in the ROV control room. I was initially directed by Deb Kelley (RCA’s Principal Investigator and Lead of the VISIONS program) to take a look at the biology catalog. As soon as I saw it, it became my first project.” Gonzalez continually added to and updated the catalog during her summer shipboard experiences with the VISIONS program. Gonzalez has also used the catalog as the foundation for training programs and other educational resources she has developed to help guide other VISIONS students and is continuously looking for ways to streamline and improve it.
With input from VISIONS students and professors, the catalog now contains images and videos of eight taxonomic groups and 61 species, along with descriptions of animals’ feeding habits, behaviors, and environmental ranges. Student curators have always welcomed input from experts to help improve content and validate species identification.
The biology catalog was originally designed as a growing archive for students and researchers, but has quickly evolved into an educational and visually spectacular resource for everyone interested in seeing and learning about deep-sea organisms that live in some of the most extreme environments on Earth.
“Part of our job as oceanographers is to share what we know about the vast and unseen ocean below the surface because it is so important to life on the planet,” said Dr. Deborah Kelley, Principal Investigator of the RCA and a UW oceanography professor. “This student-created catalog is serving to inform and excite people about life in the deep ocean, and is a resource for not only scientists, but members of the media, documentarians, educators, and students all over the globe.”
All thanks to the efforts of a few students looking for answers to “What do you think this animal is?”
More images and videos can be seen at the Biology Catalog.
[media-caption path="/wp-content/uploads/2022/03/Dumbo.png" link="#"]A small “dumbo” octopus sits atop a lobate flow at the summit of Axial Volcano – water depth ~ 1500 m (nearly 5000 feet beneath the surface). VISIONS ’13. Photo credit: OOI-NSF/UW/CSSF.[/media-caption]
Read More
Distributed Acoustic Sensing Lays Groundwork for Earthquake, Tsunami Warnings, and More
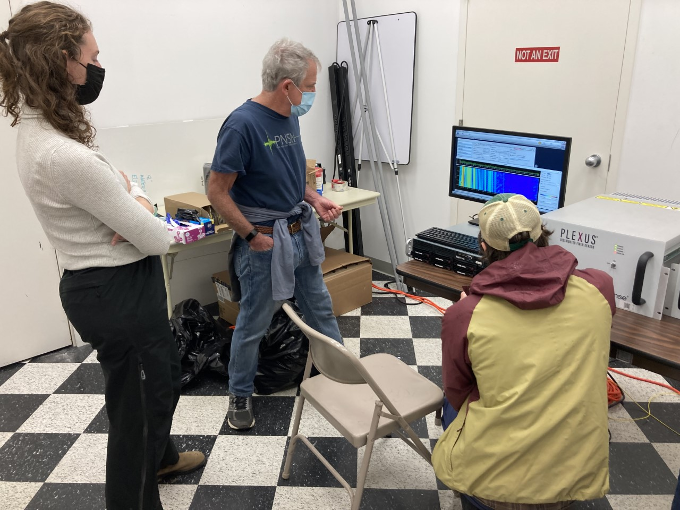
Researchers using the OOI Regional Cabled Array are at the forefront of testing Distributed Acoustic Sensing (DAS) along the seafloor through funding from the National Science Foundation. Ocean-bottom DAS using submarine fiber optic cables promises to advance what we know about marine geology, offshore earthquakes, ocean currents, ocean waves, sediment transport, marine mammals, and a host of other activities that now can be measured by this revolutionary technique.
Taking advantage of a rare temporary shutdown of RCA’s submarine fiber optic cables during a shore station maintenance period, University of Washington Researcher William Wilcock and California Institute of Technology (Caltech) Graduate Student in Geophysics Ethan Williams were part of a team of scientists who installed DAS interrogators on RCA’s “dark cables” to test and collect data for a community experiment. The experiment was designed to determine the potential of submarine DAS to observe seismic, oceanographic, acoustic and geodetic processes. Each interrogator transmitted laser pulses down the fiber optic cable from RCA’s shore station and across the offshore Cascadia Margin and recorded the echoes that came back. This backscatter remains constant until some movement on the bottom or in the water column perturbs the fibers in the cable, changing the pattern of backscattered light. By rapidly probing the cable hundreds of times per second, DAS allows researchers to monitor what’s happening in the cable environment.
“Using DAS, the fiber optic cable acts, in effect, like a line of seismometers that can measure the stretching and contracting of the ground, “explained Wilcock. “It’s an amazing technology, similar to going out in the field and putting a seismic instrument every 10 meters for a stretch of 100 kilometers. So it’s just astounding in terms of what it can potentially measure,” said Wilcock.
The DAS system also has the capability of measuring other oceanographic signals. “It turns out that ocean bottom acoustic sensing on these fiber optic cables is as sensitive to the water layer above as it is to the solid Earth below. This sensitivity provides all sorts of really interesting signals that you would normally observe using an ocean bottom pressure sensor. DAS is opening up the door for lots of interesting research opportunities,” said Williams, who has been working with DAS systems for years under the supervision of Zhongwen Zhan at Caltech, one of the world’s foremost experts in the field.
Among the many potential ways DAS data might be used include advancing earthquake and tsunami early warning systems, and understanding wave and current action, sediment transport, and ocean-generated seismic noise, as well as providing biological information. In Wilcock’s case, he’s excited about using DAS to gain access to fin whale calls that were picked up by this DAS experiment.
The National Science Foundation funded this experiment in the hopes of developing protocols that can support the use of DAS for science and hazards mitigation in the Northeast Pacific while meeting national security requirements. The U.S. Navy conducted a preliminary review of the data and subsequently released the data for public use. The data are being stored on RCA servers at the University of Washington. Researchers will have ftp access to the data at this link. But because the full data set is 26 terabytes, researchers can also email ooicable@uw.edu to arrange to provide disks that will be returned with data they are interested in.
Four days of continuous measurements in this dynamic offshore environment also offer a potential treasure trove of data. Graduate student Williams is turning his attention to exploring these datasets and calibrating them against conventional measurements to better understand what some of the potential applications may be. “I’m very excited about the potential DAS brings to understanding what’s happening on the seafloor. Having, in essence, so many seismometers on the ocean floor means that we can apply all sorts of array-based processing so we’re not only averaging in time, we’re combining information in space. And this allows a lot of really innovative things that we weren’t able to do before.”
“But the real value of these datasets comes from being an open dataset. It will be a great facilitator for learning with the potential to expand general knowledge about how to use DAS in the marine geology and marine geophysics world, which is great,” Williams added.
Both Wilcock and Williams were excited about the potential for DAS to open up understanding of the processes involved in this deep-sea world. They both mentioned a dream of having DAS sensors integrated into future SMART cable technology to expand DAS use on land and in the sea.
Read More
WHOI’s Jim Edson to Replace John Trowbridge as OOI’s Principal Investigator
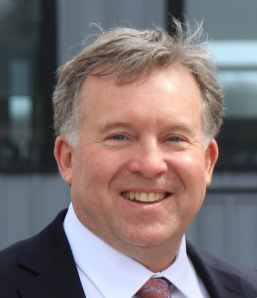
The National Science Foundation has approved the appointment of Dr. James B. Edson as the new Principal Investigator (PI) of the Ocean Observatories Initiative (OOI) Program Management Office (PMO). Edson will assume his responsibilities on March 1, taking over for Dr. John Trowbridge, who announced his intention to leave for a new position in January and has led the PMO from October 2018, when the program management office was moved to the Woods Hole Oceanographic Institution (WHOI) from the Consortium for Ocean Leadership (COL) in Washington, D.C.
“John’s done an exceptional job leading OOI and leaves very big shoes to fill, and we are delighted to have Jim assume the reins and are confident in his ability to lead OOI through the leadership transition and beyond” said Rick Murray, WHOI Deputy Director and Vice President for Science and Engineering, who led the search for Trowbridge’s replacement. “Jim has a phenomenal depth of knowledge about OOI’s early years, having served [with Trowbridge] on the ORION Science & Technology Advisory Committee during the OOI planning stages and as a member and chair of the OOI Program Advisory Committee from 2008-2013. Plus, Jim brings a wealth of experience running large government programs and academic departments. We share his excitement in leading OOI.”
Edson was an Assistant through Associate Scientist with tenure in the Department of Applied Ocean Physics and Engineering at WHOI from 1991 to 2004. He also served as a rotator at the Office of Naval Research from 1998-1999. His research interests include boundary-layer meteorology, with a focus on surface-layer turbulence, air-sea interaction and flux parameterizations. During this period, Edson was Chief Scientist for the Office of Naval Research Coupled Boundary Layers and Air-Sea Transfer (CBLAST) Defense Research Initiative, and Principal Investigator for the Construction and Management of the Martha’s Vineyard Coastal Observatory and its Air-Sea Interaction Tower at WHOI. Edson was Professor and Head of Marine Sciences at the University of Connecticut (UConn) from 2005 to 2017, where he led UConn’s successful effort to join the University Corporation for Atmospheric Research, served as UConn’s member representative for the COL, and oversaw the upgrade and stretch of the R/V Connecticut. He rejoined WHOI in 2018 as a Senior Scientist.
Edson is a fellow of the American Meteorological Society and member of the American Geophysical Union. He has written more than 80 scientific articles and has contributed to 18 scientific books. Edson received a PhD in meteorology from the Pennsylvania State University.
Edson assumes the leadership of an organization that is in excellent shape due to Trowbridge’s leadership. Among many innovations during his tenure, Trowbridge oversaw the development and launch of a new data delivery system, Data Explorer, and the transition of the cyberinfrastructure network to a new state-of-the-art data center at Oregon State University. Despite challenges imposed by costs to upgrade cyberinfrastructure, a flat budget, and Covid-19, Trowbridge ensured that the program accomplished the full scope of marine operations while staying within budget. Trowbridge enabled a highly motivated and capable team, established productive relationships within the Program and with NSF and the Ocean Observatories Initiative Facilities Board, and led a robust community engagement effort.
To ensure a smooth transition, Trowbridge will end his service as the OOI PI on March 1, but will continue half-time to support Edson during a four-month transition period. On June 30, Edson will begin his tenure as the full-time OOI PI.
The Ocean Observatories Initiative is a long-term infrastructure project funded by the National Science Foundation to gather physical, chemical, and biological data from the ocean, atmosphere, and seafloor and to deliver that data on demand and in near real-time online. The program includes moored instrument arrays and autonomous underwater vehicles deployed at critical locations in the coastal and open ocean worldwide. Data from the observatories help researchers address questions across short and long time periods, small and large spatial scales, and from the ocean surface to the seafloor. OOI is managed by the Woods Hole Oceanographic Institution (WHOI) and implemented by WHOI, the University of Washington, and Oregon State University.
Read MoreOOI at Ocean Sciences Meeting 2022
The following is a compilation of OOI-related presentations at this year’s Ocean Sciences Meeting. OOI sponsored a virtual booth at OSM this year. Content and presenters are highlighted in the blue boxes below.
If we have missed any OOI-related sessions, please contact dtrewcrist@whoi.edu and we will be glad to add them.
[feature]
OOI Virtual Booth Sessions
Please register at the links below. Attendance at the Ocean Sciences Meeting is not required for OOI virtual booth sessions.
Monday 28 Feb 2022
Update on Moving the Pioneer Array to the Southern Mid-Atlantic Bight: Lisa Clough, National Science Foundation and Al Plueddemann and Derek Buffitt, Woods Hole Oceanographic Institution
[embed]https://vimeo.com/683052826[/embed]Tuesday 1 March 2022
OOI and Extreme Events: Ke Chen, Woods Hole Oceanographic Institution and Hillary Scannell, Lamont-Doherty Earth Observatory will discuss marine heat waves. Ed Dever, Oregon State University will present on extreme high PCO2 events in the Pacific.
[embed]https://vimeo.com/683823106[/embed]Wednesday 2 March 2022
OOI Data and the Carbon System: Wendi Ruef, University of Washington, Chris Wingard, Oregon State University, and Andrew Reed of Woods Hole Oceanographic Institution will share practical ways researchers can work with and integrate PCO2 and pH data into their research.
[embed]https://vimeo.com/683983211[/embed]Thursday 3 March 2022
Lightning Talks Redux: In case you missed the lightning talks at the OOIFB Town Hall on Friday, 25 February, this is another chance to hear presenters give quick and lively talks about their research and how they are using OOI data to answer scientific questions.
[embed]https://vimeo.com/684418256[/embed]Friday 4 March 2022
OOI Data in the Classroom: Janice McDonnell and Sage Lichtenwalner, Rutgers Center for Ocean Observing Leadership, presented on the OOI Data Lab Manual created by Ocean Data Labs. Cheryl Greengrove, University of Washington, shared innovative ways she is using OOI data to inspire undergraduate students. Elizabeth (Lisa) Rom, National Science Foundation, addressed funding opportunities for OOI education and research initiatives, and Dax Soule, City University of New York, shared how Project EDDIE can be integrated into the classroom.
[embed]https://vimeo.com/685549506[/embed][/feature]
[feature]
OOI at OSM
Friday February 25 2022
noon-1 pm Eastern
TH08 The Ocean Observatories Initiative Facility Board (OOIFB) Town Hall
Lead organizer: Annette DeSilva, University of Rhode Island (desilva@uri.edu)
Tuesday 1 March 2022
9-11 pm Eastern
pH and pCO2 Time Series from the Ocean Observatories Initiative Endurance Array
Presenter: Ed Dever, Oregon State University (Edward.Dever@oregonstate.edu)
Wednesday 2 March 2022
10:30 am Eastern
Six Year Time-Series of Particulate Organic Carbon Flux in the Subpolar North Atlantic from Ocean Observatories Initiative Bio-Optical Data
Presenter: Jose Cuevas, Boston College (cuevasjo@bc.edu)
Thursday 3 March 2022
11:30-12:30 pm Eastern
Mesoscale and Submesoscale Shelf-Ocean Exchanges Initialize an Advective Marine Heatwave
Presenter: Ke Chen, Woods Hole Oceanographic Institution (kchen@whoi.edu)
5:20 pm Eastern
Influence of Biological and Physical Processes on Carbon Uptake over Annual Cycles in the Irminger Sea
Presenter: Kristen Fogaren, Boston College (kfogaren@bc.edu)
Friday 4 March 2022
11:35 am Eastern
Constraining the mixed layer carbon budget in the Irminger Sea using autonomous mooring observations
Presenter: Meg Yoder, Boston College (yoderma@bc.edu)
12:30-1:30 pm Eastern
Categorizing wind events that cause the fall stratification breakdown on the New England Shelf
Presenter: Lucas Lobert, Woods Hole Oceanographic Institution (Llobert@whoi.edu)
3:35 pm Eastern
Robust climatologies of subsurface ocean conditions on the continental shelf and slope along the Newport Hydrographic Line, Oregon, USA, during 1997–2021
Presenter: Melanie Fewings, Oregon State University (melanie.fewings@oregonstate.edu)
5-6 pm Eastern
On the Vertical Structure of Deep Ocean Subinertial Variability
Presenter: John Toole, Woods Hole Oceanographic Institution (jtoole@whoi.edu)
5-6 pm Eastern
OT06 Ocean Observatory Science – Connecting Processes from Events to Climate 01
Lead Organizer: Richard Dewey, (rdewey@uvic.ca)
5:00 pm Quality control and validation of OOI carbon system measurements in the Irminger Sea
Presenter: Andrew Reed, Woods Hole Oceanographic Institution (areed@whoi.edu)
5:05 pm Making available more than two decades of mooring and ship-based observations from the Newport Hydrographic Line
Presenter: Craig Risien, Oregon State University (craig.risien@oregonstate.edu)
5:10 pm A doorway to data: Accessing and exploring OOI data using the InteractiveOceans portal
Presenter: Michael Vardaro, University of Washington (mvardaro@uw.edu)
5:15 pm Basin-scale climate forcing of carbon flux to the deep ocean
Presenter: Maureen Conte, Bermuda Institute of Ocean Sciences (mconte@mbl.edu)
5:20 pm A first look at megabenthic community responses to seasonal change using the new Holyrood Underwater Observatory in Conception Bay, NL
Presenter: Rylan Command, Memorial University of Newfoundland (rylan.command@mi.mun.ca)
5:25 pm Ocean Networks Canada’s fifteen years of observatory science
Presenter: Richard Dewey, University of Victoria (rdewey@uvic.ca)
6-7 pm Eastern
OT06 Ocean Observatory Science – Connecting Processes from Events to Climate 02
Lead Organizer: Richard Dewey, (rdewey@uvic.ca)
6:00 pm A purpose-built integrated ocean observatory captures physical mechanisms driving spatial and inter-annual variability within an Antarctic coastal canyon
Presenter: Josh Kohut, Rutgers University (kohut@marine.rutgers.edu)
6:05 pm Estimating gross primary production from Diel measurements of oxygen and pH from underwater gliders
Presenter: Stephen Huie, California State University Monterey Bay (shuie@csumb.edu))
6:10 pm OOI protocols, workflows, and user tools provide high-quality, research-ready oceanographic data
Presenter: Wendi Ruef, University of Washington (wruef@uw.edu)
6:15 pm Event detection using QARTOD quality control flags: Examples from OOI Argentine Basin and Irminger Sea Arrays
Presenter: Andrew Reed, Woods Hole Oceanographic Institution (areed@whoi.edu)
6:20 pm An all-weather sea surface wind speed product from microwave radiometers
Presenter: Suleiman Alsweiss, Global Science & Technology Inc. (suleiman.alsweiss@noaa.gov)
6:25 pm Improvements and new applications of high-frequency radar for coastal ocean observing systems
Presenter: Libe Washburn, University of California, Santa Barbara (libe.washburn@ucsb.edu)
[/feature]
Read MoreApplications Open for June Northeast Pacific OOIFB Workshop
The Ocean Observatories Initiative Facility Board (OOIFB) will host a workshop focusing on current and future science that can be addressed using data from OOI’s infrastructure in the Northeast Pacific and other regional observatory arrays. The workshop will be held at the OSU Portland Center in Portland, OR on June 7-9, 2022. This workshop was scheduled to be held in 2020, but was postponed due to the COVID-19 pandemic. The OOIFB is hopeful that in June 2022 members of OOI’s community can safely come together for a productive workshop. A hybrid model with in-person along with options for virtual participation is planned.
The workshop is aimed at researchers who are using or are considering using OOI data; resource managers from national, state, and tribal agencies; and educators at all levels interested in using data from the OOI’s Regional Cabled, Coastal Endurance, and Global Station Papa Arrays.
The workshop will inform the research community of the available data and science opportunities offered by the OOI and other observatory arrays located in the Northeast Pacific. An overview of OOI data products, user interfaces, and system features will be provided along with hands-on demonstrations using data access tools. OOI Program Team members and NSF representatives will be on hand to answer questions and provide information on OOI operations.
The workshop will provide a forum to facilitate science collaborations, identify strategies for engaging future users of OOI, and build cross-network collaborations. Community-building and expanding broader impacts will be discussed. Workshop participants will have the opportunity to provide feedback on their experiences in working with the OOI systems and data.
To apply for the workshop, please complete the on-line application form that is available on the workshop web page. Please indicate how you plan to participate in the workshop (in person or virtual) when completing the form. Travel support is available, but limited. Broad representation from institutional, geographic, and disciplinary groups is desired and will be considered in participant selection. The deadline for applications is March 20, 2022.
Additional details about the workshop and agenda are available here.
Improving Remote System Response in Increasingly Hostile Oceans
Wind and Waves and Hydrogen, Oh My!
Improving remote system response in increasingly hostile oceans
This article is a continuation of a series about OOI Surface Moorings. In this article, OOI Integration Engineer Alexander Franks discusses the mooring software and details some of the challenges the buoy system controller code has been written to overcome.
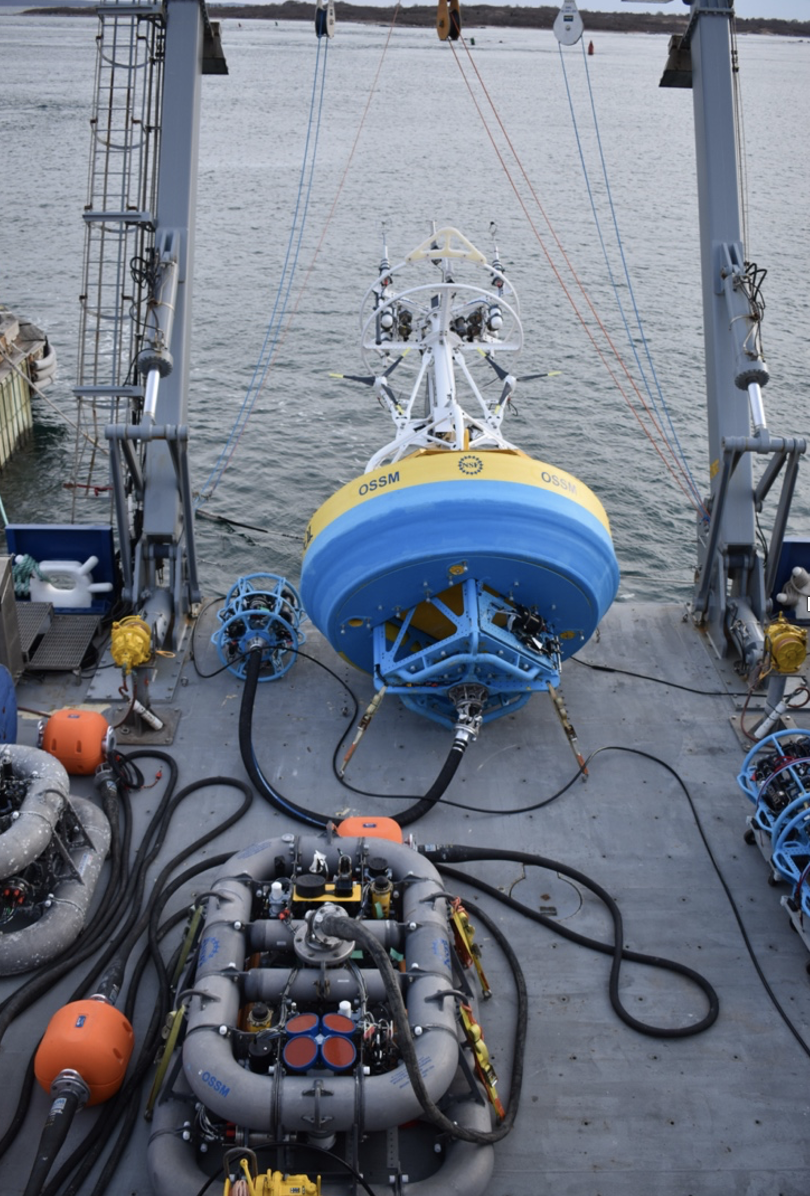
Components of the OOI buoys working in concert make up a system that is designed for deployment in some of the most challenging areas of our world’s oceans. These systems collect valuable scientific data and send it back to Wood Hole Oceanographic Institution (WHOI) servers in near real time. Mechanical riser pieces (wire rope, and/or stretch hoses) moor the buoy to the bottom of the ocean. Foam flotation keeps the buoy above water in even the worst 100-year storm, while its masthead supports instrumentation and satellite radios that make possible the continuous relaying of data. The software controlling the system is just as important as the physical aspects that keep the system operating.
The system software has a variety of responsibilities, including setting instrument configurations and logging data, executing power schedules for instruments and parts of the mooring electronics, controlling the telemetry system, interfacing with lower-level systems including the power system controller, and distributing GPS and timing. The telemetry system is a two-way communication path, so the software controls data delivery from the buoy, but also provides operators with the ability to perform remote command and control.
[caption id="attachment_22938" align="alignnone" width="745"]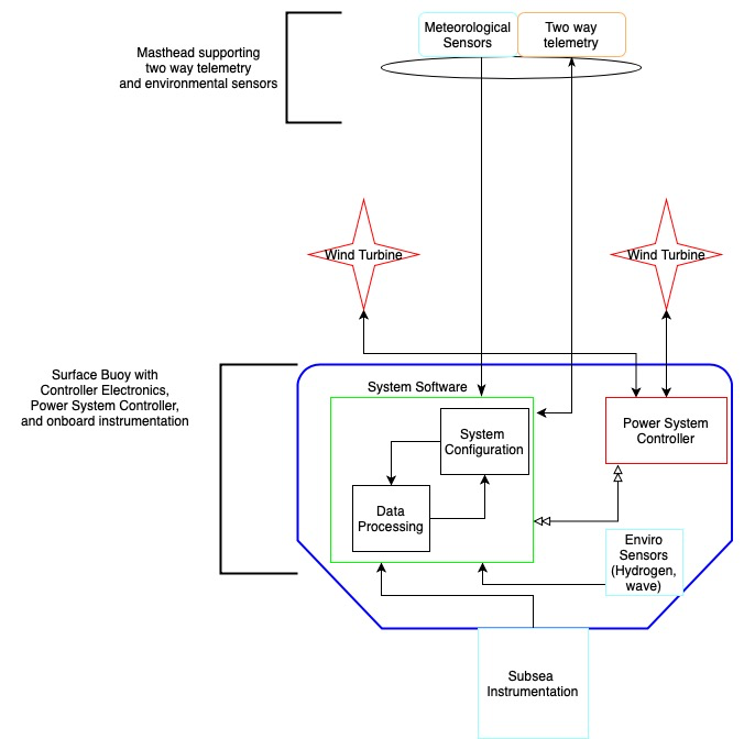 Software flow diagram created by OOI Integration Engineer Alex Franks[/caption]
The unforgiving environment and long duration deployments of OOI moorings lead to occasional system issues that require intervention. Huge storms, for example, can build waves so high that they threaten wind turbines on the moorings. At the Irminger Sea Array, ice can accumulate so much as to drastically increase the weight of the masthead, and with subsequent buoy motion, risk dunking the masthead and instruments. Other mooring functions require constant attention. The charging system must be monitored to ensure system voltages stay at safe levels and hydrogen generation within the buoy itself is kept within safe limits. Two-way satellite communication allows operators to handle decision making from shore using the most up-to-date information from the buoy.
“Since starting in 2015 and following multiple mooring builds and deployments, I’ve realized that issues can rapidly arise at any time of the day or night. I started thinking about what the buoys can do for themselves, using the data being collected onboard,” Franks said.
One of the game-changing upgrades implemented by Franks was to read environmental data and make automated buoy safety decisions in real-time that were previously performed by the team manually. For example, previously, the team would need to monitor weather forecasts and decide preemptively whether changes to buoy operations were advisable. With recent software changes, the system can now change its configuration based on a variety of sensor inputs. These variables include system voltage, ambient temperature, hydrogen levels inside the buoy well, wind speed, and buoy motion (for sea state approximation). In addition to the software updates, the engineering team redesigned the power system controller. They added charge control circuits and the ability to stop the wind turbines from spinning. The software and electrical upgrades now provide redundant automated safeguards against overcharging situations, hydrogen generation, and turbine damage, maximizing buoy operability in harsh environments.
[caption id="attachment_22946" align="alignleft" width="650"]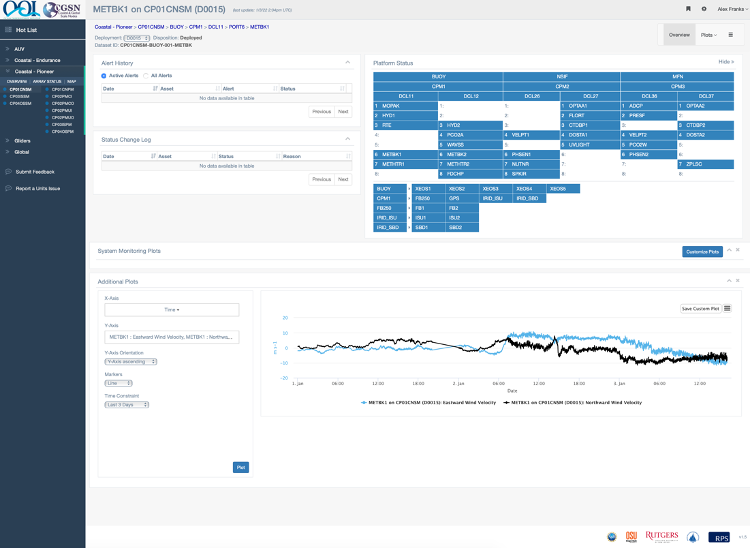 Onshore engineers are able to keep track of Irminger Sea buoys and instrumentation on this new new dashboard.[/caption]
With a largely independent system, operators also needed a way to easily monitor status of the buoys and instrumentation. The software team created a new shoreside dashboard that allows operators to set up custom alerts and alarms based on variables being collected and telemetered by the buoy. While the buoy systems can now operate autonomously, alerts and alarms maintain a human-in-the-loop component to ensure quality control.
As operations and management of the moorings have progressed, the operations team has found opportunities to fine tune how operators and the system handle edge cases of how the system responds to hardware failures and extreme weather. In the past, sometimes conditions changed faster than the data being transmitted back to shore. This new sophisticated software automates some of the buoy’s responses to changing conditions in real time, which helps to ensure their continued operation even under challenging conditions. The decreased response time to environmental and system events using an automated system, coupled with the ability to monitor and interact remotely, has increased the reliability and survivability of OOI moorings.
Read MoreTwo Artists at Sea
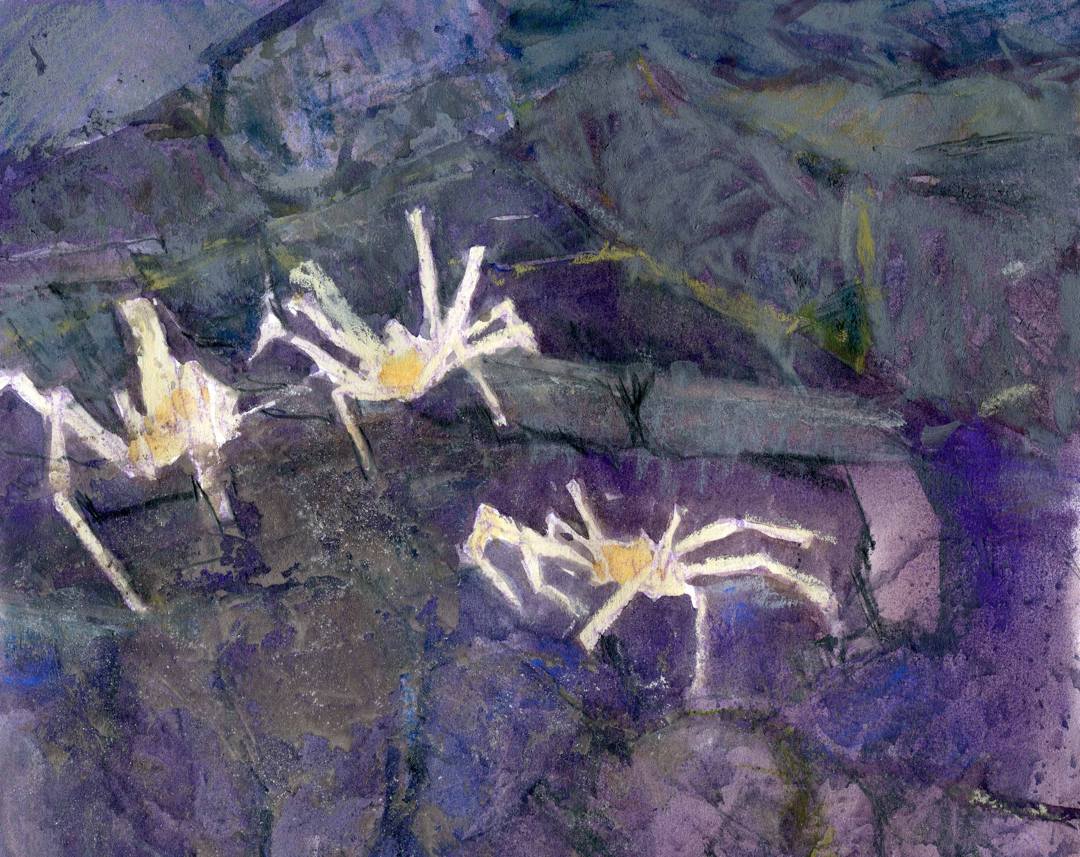
Two artists were aboard the R/V Thomas G. Thompson during this summer’s OOI Regional Cabled Array VISIONS’21 cruise. Undergraduate student Genevieve Kent was leaving the Thompson for Leg 1 of the four-week cruise. Professional artist and lifelong learner, Catherine Gill, was was onboard for Legs 3 and 4 of the summer expedition, including an extra two days at sea while the Thompson was diverted for a rescue mission of two Ocean Exploration Trust remotely operated vehicles (ROVs).
While their physical paths didn’t cross aboard the ship, each spent their time similarly while onboard – serving as a member of the scientific party, taking regular shifts to ensure samples were collected and underwater footage from the ROV Jason was catalogued and archived. They also spent whatever free time they had capturing their experiences in creative endeavors.
Catherine Gill
Because of space limitations on the ship, Gill came equipped with only those supplies that would allow her to draw and paint in very limited space. As a plein air painter, Gill has painted everywhere from in a kayak to in the forest canopy, so she knew what kind of supplies she would need. She brought with her the basics – a standing tripod easel and a small palette. She also brought with her a very small kit that she could keep on her lap and create 5×7 paintings.
“It’s very busy on these legs, but whenever I could find an hour, maybe an hour and a half, I would find a spot on the ship. And I’d set up and do paintings of whatever was happening, putting the new profiler in or pulling up the old one, or capturing some of the very cool stuff on cameras being broadcast by the ROV Jason,” she said. “’I’m sitting there in the Jason control van and watching these scenes that are amazing. There’s different sea life coming from all over the place. The ROV lands on the bottom and you see chimneys and all of the amazing sea life that is down there. It was just incredible.”
Gill painted as things unfolded aboard the Thompson and took screen shots of Jason scenes so she would have a point of reference later on. Regional Cabled Array Principal Investigator Deb Kelley also provided Gill with Jason video that Gill took home to her studio to create bigger paintings of the sea life and Jason operations after she left the ship.
But Gill recounted that she was most at home aboard the ship, painting the experience in real time in “plein air.”
“Because I paint on location, not just from photographs, I know there’s a real difference when you paint from life than when you paint from a photograph. The marks you make are more convincing. If you feel the cold, if you’re aware of the silence, if the wind is blowing on you, you give your painting more than just what your eyes can see,” she explained. But I couldn’t get down to the seafloor to actually paint on location, so having access to video is the next best thing. Having high-definition video to paint from, I can get the feel of what that weird fish is doing, better understand the complexity of those tube worms and deep-sea critters all moving and doing their things, and watch that hydrothermal vent smoking and interacting with the seawater.”
Gill created 13 drawings and paintings while onboard. After her return, she has created another eight to 10 larger-scale paintings. More of her work can be seen on her website, Instagram, and Facebook (Catherine Gill).
Genevieve Kent
Kent, a third-year undergraduate student studying marine biology at the University of Washington, merged her passion for marine science with her artwork while aboard the Thompson. Her interest in marine science was sparked during a seminar class on hydrothermal deep sea vents taught by Kelley. Kent took advantage of the opportunity to participate in a shipboard experience that she learned about in this class to see if she really wanted to pursue a career in marine science.
Kent was accepted to participate in VISIONS’20, but student participation was postponed until 2021 due to COVID restrictions. So, she jumped at the opportunity to sail on the Thompson a year later as part of the VISIONS’21 student contingent.
Her favorite part of the experience was doing shifts in the control van, where her job was to log everything that was happening with Jason as it was used to recover and deploy equipment plugged into the Regional Cabled Array. “I really liked being able to be a part of what was happening. It reminded me a lot of when I was a stage manager for live theater, being in the hot seat and you have to know your role in everything. But it was also really amazing to watch the monitors in real time and see all that was happening there, live and being a part of it.”
Kent works in many mediums from water colors to acrylic paints, to markers, but for this project she chose water colors because they fit the theme of the ocean and can help evoke its many changing moods. While Kent is not a professionally trained artist, she is naturally talented. She used her time in the control van to sketch with colored pencils and capture images of marine life on the bottom that she painted when she returned to her in-home studio.
Once home from the cruise, Kent immediately sat down and started to capture her experiences in watercolors. She used her sketches and images as source material. She is spending as much time as possible on her artwork, as she resumed classes and labs as a full-time student. She has completed several paintings of marine life and has many others in varying stages of completion. Kent can be contacted here.
Plans are in the works to have both artists show their creations at an exhibit at the University of Washington later this spring. A sneak preview is provided below:
[gallery size="large" ids="28987,28988,28989,28990,28991,28992,28993,28994,28995,28996,28997,28998,28999,29000,29001"]
Read More