
News
Array Enhanced Understanding of Complex Southern Ocean
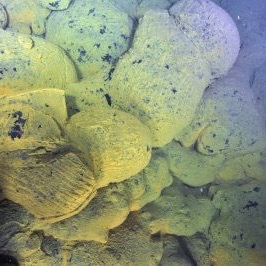
Five years of data have made a significant difference in understanding of the complex processes occurring in the remote and hostile conditions of the Southern Ocean. In its five years of deployment, OOI’s Southern Ocean Array has provided critical data that enhanced weather modeling and forecasting, while providing means to study the mechanisms behind Southern Ocean warming and the storage of carbon at depth.
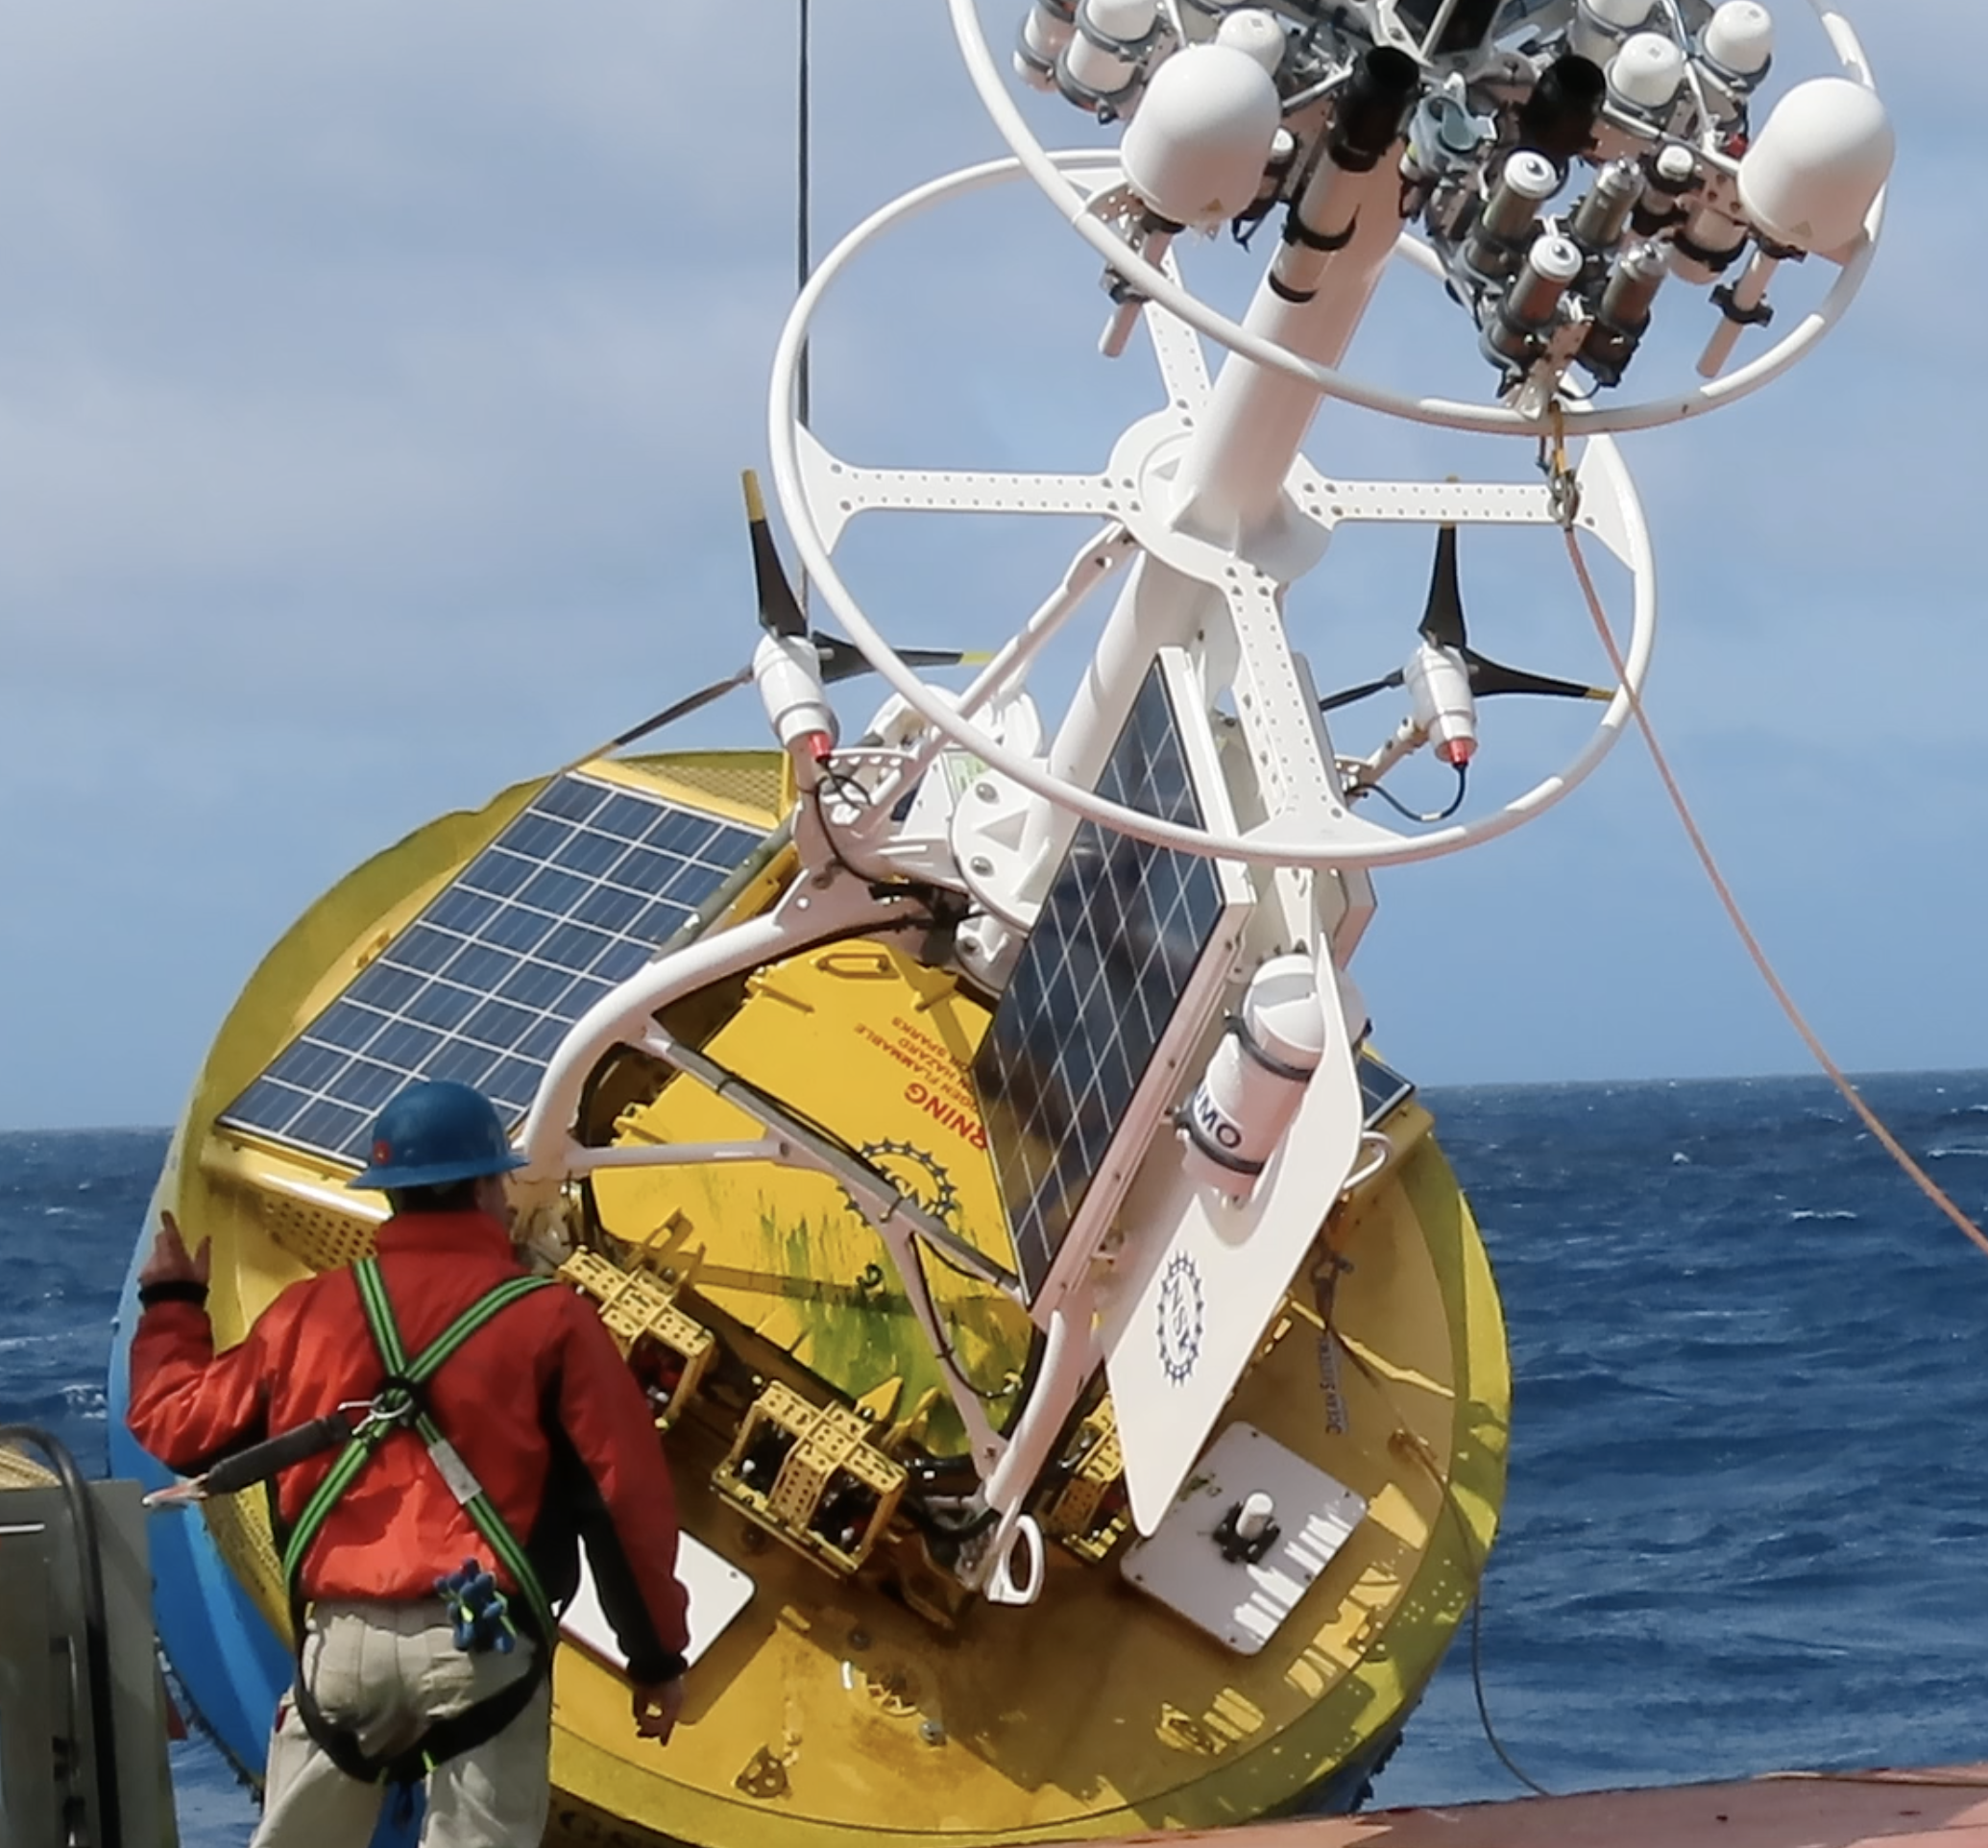
Four OOI moorings were deployed in February 2015 in a very sparsely sampled area in the Southern Ocean (55 degrees South, 90 degrees W) with the goal of helping modelers, forecasters and scientists understand this dynamic and volatile environment. One mooring was decommissioned in 2017. Two bottom halves remained in place through 2018 and a single surface mooring remained in place through January 2020. Collectively, these deployments provided a continual treasure trove of data to scientists, modelers, and forecasters.
This data stream is particularly important because the Southern Ocean is not only warming faster than other parts of the world ocean, it has also been implicated as the major region for ocean uptake of carbon dioxide.
“Collecting continuous data in this sparsely sampled region has provided a groundtruth point to help refine climate models and weather forecasts, and better understand complex processes occurring in the Southern Ocean,” said Dr. Sheri N. White, lead systems engineer for the Coastal Global Scale Nodes of OOI at Woods Hole Oceanographic Institution and chief scientist on the 2018 and 2020 OOI expeditions that recovered the Southern Array.
The benefits of deployment were evident. When the moorings were first deployed in 2015, data were not initially integrated into the World Meteorological Organization’s Global Telecommunication System (GTS). In August 2017, when the data were added to the GTS, making them more easily accessible for weather forecasters and modelers, they had an almost immediate impact on forecasting by the European Centre for Medium-Range Weather Forecasts (ECMWF). In August 2017, for example, OOI’s Surface Buoy picked up a low-pressure system moving through the area. Integrating these data into forecast models, researchers filled in some key spatial gaps in their observational coverage, reducing the error in 24-hour forecasts. With improved data, ECMWF was better able to forecast the next huge Southern Ocean storm with a central pressure around 955 mb that had simultaneous major impacts on southern South America, Drake Passage, and the Antarctic Peninsula.
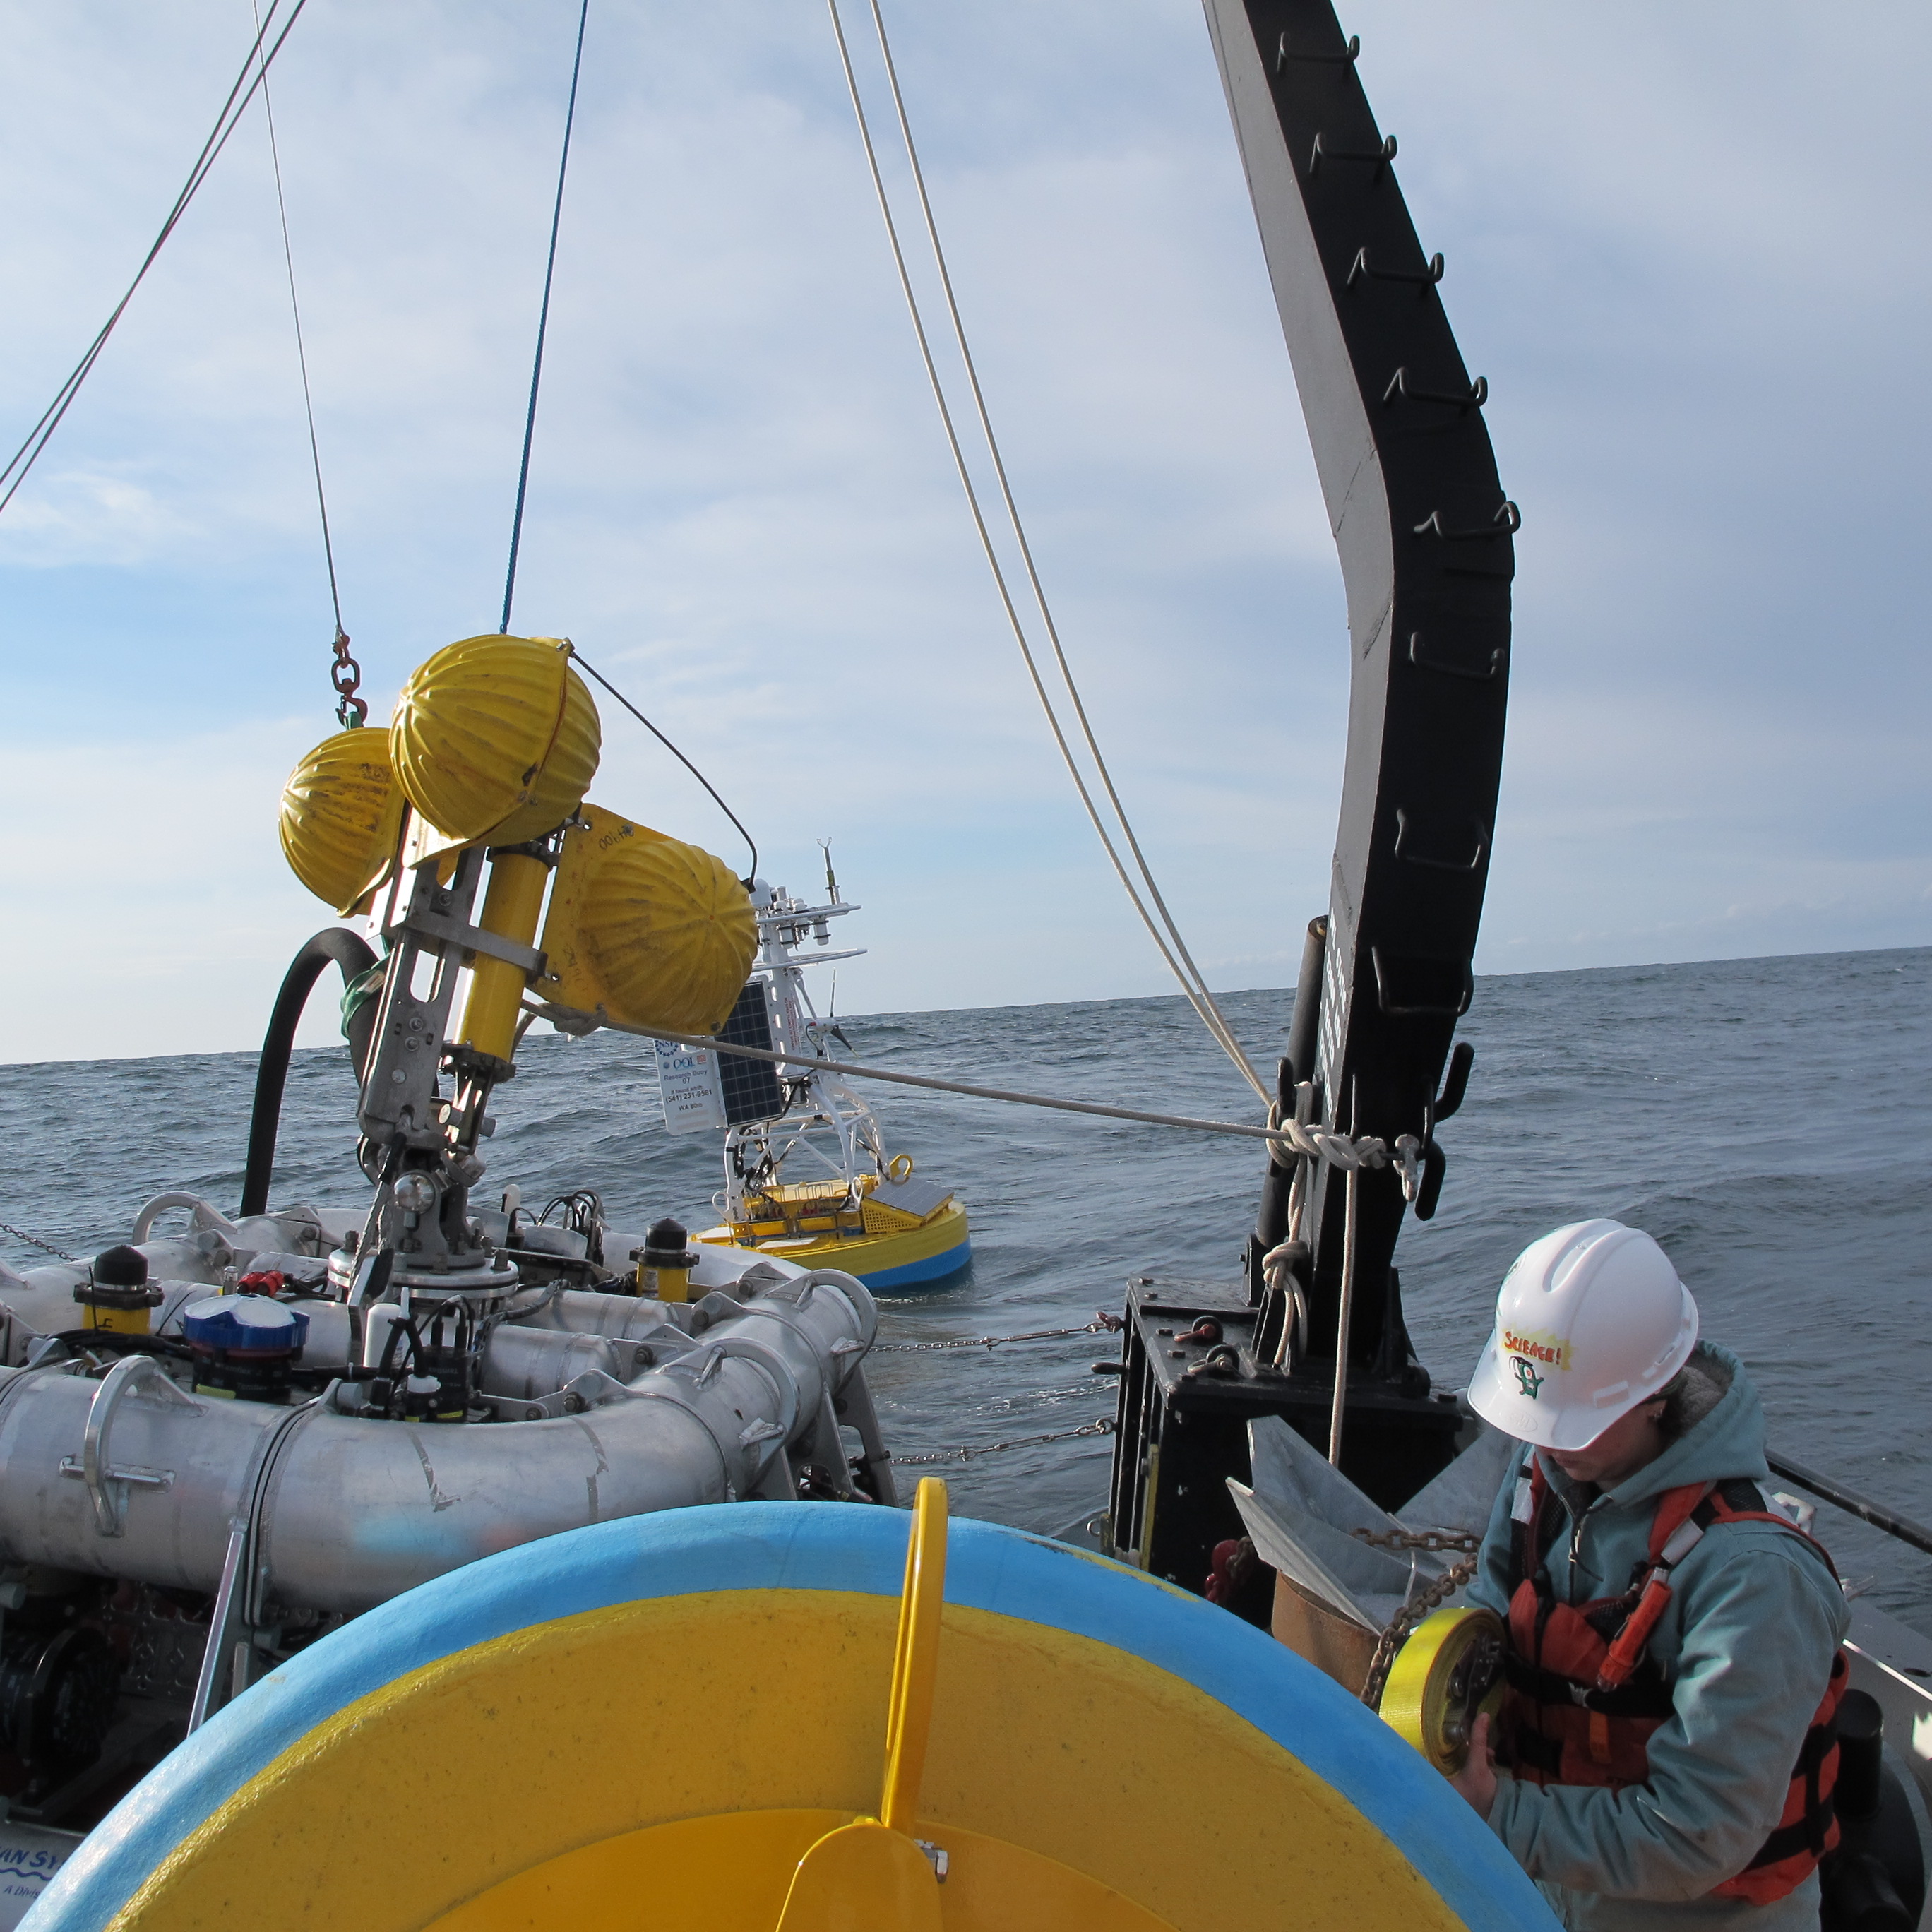
The Southern Ocean Array also provided a platform for interagency and interdisciplinary collaborations. The National Science Foundation and its UK counterpart, the National Environmental Research Council joined forces to support two expeditions in 2018 and 2020. The 2018 expedition recovered the bottom halves of the moorings, while outfitting the surface mooring with equipment to measure silicate and nitrate using “lab-on-a-chip” technology (miniaturized analytical devices that integrate laboratory operations into a single chip on a very small scale.) This work was an investigation undertaken by Dr. Adrian Martin of the UK’s National Oceanography Centre and an investigator for CUSTARD (Carbon Uptake and Seasonal Traits in Antarctic Remineralisation Depth). The sensors and the surface mooring were recovered during the 2020 expedition.
“CUSTARD focuses on how interactions between marine organisms, nutrients in the water and the ocean circulation control the storage of carbon at depth. To do so requires information through the year because of the boom and bust seasonal cycle of phytoplankton,” explained Martin. “The mooring gave us both a variety of important data as well as a platform to deploy some of our own sensors year-round in the challenging environment of the Southern Ocean. The CUSTARD project benefited immensely from our collaboration with OOI. “
The OOI moorings also provided scientists with a means to study the mechanisms behind Southern Ocean warming. In a study led by Sarah Ogle of Scripps Institution of Oceanography, scientists found that just a few extreme storm events drive most of the mixed-layer deepening, suggesting that air-sea heat exchange is a highly episodic process.
“Only the largest storm events each year are able to mix the upper ocean enough to influence the ocean interior,” said Dr. Sarah Gille, also of Scripps and a member of OOI’s Facility Board. “With the removal of OOI, we’ve lost one window into these big events, but from the OOI data, we’ve gained some perspective on what types of measurements need to be collected to understand air-sea exchange in the region. In the future, I hope that we’ll be able to make use of newer autonomous systems to continue the research started in the Southern Ocean with OOI.”
[media-caption type="vimeo" path="https://vimeo.com/398932101" link="#"] Crew members recover the last Southern Array Surface Mooring (9000+ lbs) aboard the RRS Discovery, operated by the Natural Environment Research Council.Video courtesy of Dr. Adrian P. Martin, National Oceanography Centre [/media-caption] Read MoreEndurance Cruise Delayed by COVID-19
The spring 2020 OOI Endurance Operations and Management (O&M) turn cruise has been delayed for at least 30 days due to travel and personnel restrictions imposed to stem the spread of the virus COVID-19.
The 16-day cruise was set to depart on 31 March from Newport, Oregon aboard the R/V Sikuliaq to service the array off the Oregon and Washington coasts. The R/V Sikuliaq is part of the US academic research fleet managed by UNOLS (the University-National Oceanographic Laboratory System). UNOLS imposed a 30-day suspension in fleet operations on 13 March to help ensure the safety of the ship’s crew and science party and to mitigate the risk of virus spread. Rescheduling of activities will commence once the situation stabilizes and UNOLS sees a path forward to re-start research vessel operations safely.
Upcoming O&M cruises for the Pioneer, Irminger, and Papa Arrays also are scheduled aboard UNOLS vessels (R/V Neil Armstrong and R/V Sikuliaq). These cruises fall outside of the UNOLS current 30-day suspension so cruise preparation continues.
We do not anticipate that cruise schedule changes will affect the collection nor dissemination of OOI data, which will continue to be available for users here.
Read More
Metadata Review Improves OOI Data
OOI’s data teams have just completed an extensive, year-long review of critical metadata to ensure the quality and usability of data for OOI data users. The review covered data collected through the end of 2019 and included instrument calibration coefficients, instrument deployment assignments, and deployment dates. Moving forward, all metadata verification will conform to the standards established during the review.
“Our reason for undertaking this review was no more complicated than to make the data better for our data users,” explains Jeffrey Glatstein, Senior Manager of Cyberinfrastructure and OOI Data Delivery Lead. “It is the first time since the inception of the program that we’ve really gone in and looked at the metadata from top to bottom. If there was a calibration that was off, a depth missing, or something misspelled, we found it.
“This intense and deliberative review process brought historic metadata up to current standards to ensure continuity, completeness of records, and consistency in how metadata are reported now and moving forward.”
The data teams used a combination of human review and an automated script development process to identify and correct data issues. The human-in-the-loop (HITL) process ensured that two sets of eyes verified each metadata product, whenever possible, while the scripts performed automated verification and generated reports to pass back into the HITL workflow.
“This initiative is part of ongoing OOI efforts to make its data more accessible, user friendly, and integrated into ongoing science,” adds Glatstein.
Check Previously Downloaded Data
The OOI Data Portal operates on a process-on-demand model, which means that data downloaded prior to the end of 2019 should be checked to see if relevant metadata has been modified.
Users can check to see if changes were made to relevant metadata by clicking here. This link provides a searchable database by array, platform, and instrument to help ensure that previously downloaded data are correct or if they need to be re-downloaded so users are working with the best available data. The OOI data teams are continuing to verify the historical deployment assignments/dates, and the results will be updated accordingly
[feature]A Gargantuan Effort
As part of the transition of OOI to 2.0 in October 2018, the RCA data team initiated a comprehensive audit of all critical metadata to ensure that data products served by the OOI Cyberinfrastructure system meet Quality Assurance/Quality Control standards set by the program and expected from the user community. This daunting task included the examination of over 700 calibration files from 2013 to the present. The results of this audit were used to aid in evaluation of current processes and guide in adapting workflows to improve QA/QC efforts and communication to the users, a vital component to building confidence in the OOI datasets as reliable and valuable resources that can be used in scientific research and education.
Wendi Ruef, Research Scientist, Regional Cabled Array
The CGSN Data Team worked carefully and methodically through thousands of files containing over 30,000 calibration coefficients and other critical metadata. We now have a high level of confidence in past metadata and a strong process for continued review going forward.
Al Plueddemann, Chief Scientist, Coastal Global Scale Nodes
[/feature] Read More
NE Pacific OOI Community Workshop, 23-25 June: Applications by 5 April
The Ocean Observatories Initiative Facility Board (OOIFB) will host a workshop focusing on current and future science addressed by the OOI infrastructure in the northeast Pacific. The workshop is aimed at researchers and resource managers who are using or are considering using OOI data, researchers interested in adding instrumentation to the OOI infrastructure, and educators at all levels interested in OOI’s Cabled, Endurance, and Station Papa Arrays.
The workshop will inform the oceanographic community of the science capabilities and new technologies offered by the OOI and other observatory arrays located in the northeast Pacific. An overview of OOI data products, user interfaces, and system features will be provided along with hands-on demonstrations using a suite of data access tools. OOI Program team members and NSF representatives will be on hand to answer questions and provide information on OOI operations.
This community workshop will provide a forum to facilitate science collaborations and identify strategies for engaging future users of OOI. Workshop participants will have the opportunity to provide feedback on their experiences in working with the OOI systems and data.
The workshop will be held at the OSU Portland Center in Portland, OR on June 23-25, 2020. To apply for the workshop, please complete the on-line application form. Travel support is available, but limited. Broad representation from institutional, geographic, and disciplinary groups is desired and will be considered in participant selection. The deadline for applications is April 5, 2020.
To apply, click here.
Participation by Web Conference will be offered
Please note if you are unavailable to attend this workshop, participation by web-conference will also be possible. Individuals interested in participating virtually are encouraged to complete the on-line application form. This will help us to better understand our participant interests.
Special note: Although we plan to hold the workshop on June 23-25 in Portland, OR, we will continue to monitor news and guidance regarding the Coronavirus (COVID-19) outbreak. Plans for the workshop will be adjusted as needed in consideration of any Center for Disease Control guidance in the coming weeks.
Additional details about the workshop are available here.
Read More
Funding Opportunity to Support Dissemination and Use of OOI data
The Ocean Sciences Division of the National Science Foundation (NSF) issued a “Dear Colleague letter” on 18 February to encourage wider use of the OOI data by supporting workshops, conferences or other training events to introduce researchers and educators to available data and community tools.
NSF is encouraging researchers or educators to propose workshops, conferences or other training events to 1) teach other researchers or educators how to use available tools and data; 2) develop additional community tools or instructional material to use the OOI data; or 3) create communities of practice that use the data for multi-investigator, community-driven research purposes. The goal of such activities is to promote development and dissemination of the OOI data tools and research opportunities.
Two- and four-year U.S. institutions of higher education and U.S. non-profit non-academic organizations are eligible to submit relevant proposals.
NSF intends to support about 15-20 awards in FY2020. Proposals may be submitted at any time, but at least six months prior to the planned event. To be considered for FY2020 funding, proposals should be submitted before May 15th. Submission details are available here.
Read MoreOOI Facility Board Position Open; Application Deadline 20 March 2020
The Ocean Observatories Initiative Facility Board (OOIFB) is soliciting applications to fill one membership position that is currently open. Scientists with experience using scientific observing systems such as OOI are encouraged to apply.
The OOIFB was created in 2017 to provide independent input and guidance regarding the management and operation of the National Science Foundation-funded Ocean Observatories Initiative (OOI). The OOIFB provides a way to expand scientific and public awareness of OOI, and ensure that the oceanographic community is kept informed of developments of OOI.
The responsibilities of the OOIFB may include, but are not limited to, the following:
- Serving as the prime scientific and technical conduit between the oceanographic community and NSF regarding OOI.
- Examining the accomplishments and work flow of the OOI Operator, in order to provide feedback regarding the OOI Annual Work Plans.
- Via workshops, community meetings, and/or other mechanisms, stimulate and engage the user community in keeping the accomplishments of the OOI at the cutting edge of scientific inquiry and technological innovation.
- Developing and implementing strategies to expand scientific and public awareness of the unique scientific and technological opportunities of the OOI.
Facility Board terms of office are three years, with the possibility of re-appointment for a second three-year term. We anticipate up to two in-person meetings per year and one teleconference per month.
Applications should be submitted to Annette DeSilva, at the OOIFB Administrative Support Office, and must include a letter of interest and an academic CV. Applications are due by March 20, 2020. Applications will be reviewed by the OOIFB, who will give due consideration to the qualifications of applicants, as well as to maintenance of career level, disciplinary, and regional balance on the OOIFB.
For more information about OOIFB and its activities, please visit OOIFB’s website or contact Kendra Daly, OOIFB Chair or read the OOIFB Charter.
Read More
Graduate Student Cruise Opportunities
Opportunities abound for graduate students to have hands-on experience aboard the OOI deployment expeditions in 2020. The first opportunity is during the spring Endurance Array deployment aboard the R/V Sikuliaq. as part of the UNOLS Cruise Opportunity Program. The Endurance cruise will run from 31 March-15 April 2020, departing from and returning to Newport, Oregon. Applications to UNOLS are due by 28 February 2020.
Students currently completing (or who have recently completed) a degree in a field of oceanographic research are eligible to apply. Those selected will learn about the functional aspects of seagoing work, while helping to deploy and recover oceanographic moorings, profilers, and gliders off the Washington and Oregon coast. Students also will assist in CTD (conductivity, temperature, depth) casts and acquisition of data while underway. Other specific assignments can be developed based on students’ expertise and interests.
To learn more and to apply for the Spring 2020 Endurance Array cruise, visit UNOL’s Cruise Opportunity Program. Other OOI array deployment cruises are being planned for the fall, so stayed tuned for more exciting opportunities later this year.
Read MoreOOI at Ocean Sciences Meeting

OOI will have a large presence at the upcoming Ocean Sciences Meeting at the San Diego Convention Center, 16-20 February, 2020. Presenters will cover topics ranging from how OOI’s data are contributing to scientific findings, how data are being integrated into college curricula, and how equipment can be added to OOI arrays to meet research needs. To learn more, attend one of the more than 30 sessions, town halls, or poster sessions listed below. Also, please stop by OOI’s booth #433 in the Exhibit Hall to talk directly with OOI Principal Investigators and for demonstrations on how to access and use OOI data.
If you find a session is not listed, please contact dtrewcrist@whoi.edu so that it may be added.
OCEAN OBSERVATORIES INITIATIVE AT OSM
SESSIONS
TOWN HALLS
TALKS
POSTERS
OCEAN OBSERVING-RELATED TALKS AT OSM
WORKSHOPS
SESSIONS
TOWN HALLS
POSTERS
OOI SESSIONS
SESSIONS
Friday 21 February 2020
08:00 – 10:00, SDCC – 11A, UL
IS51A Sustained Ocean Observing: From Events to Assessing Long-Term Ecosystem Patterns
Michael W Lomas, Bigelow Lab for Ocean Sciences, East Boothbay, ME, United States, Richard K Dewey, Univ. of Victoria, Victoria, BC, Canada, John H Trowbridge, WHOI, Woods Hole, MA, United States and Damian Grundle, Bermuda Institute for Ocean Science, St. Georges, Bermuda
TOWN HALLS
Tuesday 18 February 2020
12:45 – 13:45, Town Hall, SDCC – 9, UL
TH23G The Ocean Observatories Initiative: a catalyst for early-career, interdisciplinary research
Sophie Clayton, Old Dominion University, Ocean, Earth, and Atmospheric Sciences, Norfolk, VA, United States, Justin E Stopa, University of Hawaii at Manoa, Ocean and Resources Engineering, Honolulu, HI, United States and Lisa M Clough, National Science Foundation, Washington, DC, United States
Thursday 20 February 2020
12:45 – 13:45, Town Hall, SDCC – 3, UL
TH43A Ocean Observatories Initiative Facility Board Town Hall
Annette M DeSilva, Ocean Observatories Initiative Facility Board – Administrative Support Office, University of Rhode Island, Graduate School of Oceanography, Narragansett, RI, United States, Timothy J Crone, Lamont -Doherty Earth Observatory, Palisades, NY, United States, Lisa M Clough, National Science Foundation, Washington, DC, United States and Bauke H Houtman, National Science Foundation, Arlington, VA, United States
TALKS
Tuesday 18 February 2020
09:00 – 09:15, SDCC – 1A, UL
PC21A-05 Rapid eddy-mediated export of waters formed by boundary convection in the Irminger Sea
Isabela Alexander-Astiz Le Bras1, Fiammetta Straneo1, James Holte1, Femke de Jong2 and N. Penny Holliday3, (1) Scripps Institution of Oceanography, La Jolla, CA, United States, (2) Royal Netherlands Institute for Sea Research, Netherlands, (3) National Oceanography Centre, Southampton, United Kingdom
09:00 – 09:15, SDCC – 11B, UL
ED21A-05 Using Authentic Data from the Ocean Observatories Initiative in Undergraduate Teaching
Hilary I Palevsky, Boston College, Chestnut Hill, MA, United States, Cheryl Lee Greengrove, University of Washington Tacoma Campus, Tacoma, WA, United States, Charles Sage Lichtenwalner, Rutgers University, Marine and Coastal Sciences, New Brunswick, NJ, United States, Anna Pfeiffer-Herbert, Stockton University, Pomona, United States, Silke Severmann, Rutgers University, New Brunswick, NJ, United States, Dax Christian Soule, CUNY Queens College, Flushing, NY, United States, Stephanie Murphy, Consortium for Ocean Leadership, United States, Leslie Smith, Youroceanconsulting, Knoxville, United States and Kristen Yarincik, Consortium for Ocean Leadership, Washington, DC, United States
09:15 – 09:30, SDCC – 11B, UL
ED21A-06 OOI Data Explorations: A Collection of Online Data Visualization Activities to Engage Introductory Undergraduate Students
Charles Sage Lichtenwalner, Rutgers University New Brunswick, New Brunswick, NJ, United States, Janice D McDonnell, Rutgers University New Brunswick, Department of Youth Development, New Brunswick, NJ, United States, Catherine Halversen, University of California Berkeley, Lawrence Hall of Science, Berkeley, CA, United States, Dax Christian Soule, CUNY Queens College, Flushing, NY, United States, Anna Pfeiffer-Herbert, Stockton University, Pomona, United States and Kristin I Hunter-Thomson, Rutgers University, New Brunswick, NJ, United States
09:30 – 09:45, SDCC – 11B, UL
ED21A-07 OOI Data Labs Workshops: Equipping professors with the tools to tap into a fire hose of ocean data for undergraduate education
Anna Pfeiffer-Herbert, Stockton University, Galloway, NJ, United States, Dax Christian Soule, CUNY Queens College, Flushing, NY, United States, Brooke Arlite Love, Western Washington University, Shannon Point Marine Center, Bellingham, WA, United States, Ellen A R Iverson, Carleton College, SERC, Northfield, MN, United States, Ellen Altermatt, Carleton College, Science Education Resource Center, Northfield, MN, United States, Janice D McDonnell, Rutgers University New Brunswick, Department of Youth Development, New Brunswick, NJ, United States, Charles Sage Lichtenwalner, Rutgers University, Marine and Coastal Sciences, New Brunswick, NJ, United States, Catherine Halversen, University of California Berkeley, Lawrence Hall of Science, Berkeley, CA, United States, Kristin I Hunter-thomson, Rutgers University, New Brunswick, NJ, United States and Denise Bristol, Hillsborough Community College, Biological and Earth Sciences, Ruskin, FL, United States
OB23B-01 The seasonal progression of rates of productivity and export from the North Pacific NASA EXPORTS field study as observed by autonomous asset
David P Nicholson, Woods Hole Oceanographic Institution, Department of Marine Chemistry and Geochemistry, Woods Hole, MA, United States, Eric A D’Asaro, Applied Physics Lab, Univ of Washington, Seattle, WA, United States, Andrea J Fassbender, Monterey Bay Aquarium Research Institute, Moss Landing, CA, United States, Craig Lee, Univ Washington, Seattle, WA, United States, Melissa Omand, University of Rhode Island, Graduate School of Oceanography, Narragansett, RI, United States, Mary Jane Perry, University of Maine, Orono, ME, United States and Andrew F Thompson, California Institute of Technology, Physical Oceanography, Pasadena, CA, United States
09:45 – 10:00, SDCC – 11B, UL
ED21A-08Teaching Students Plate Tectonics and Seafloor Magmatism Using Ocean Observing Initiative (OOI) Data and Resources
Benjamin R Jordan, Brigham Young University – Hawaii, Laie, HI, United States and Charles Sage Lichtenwalner, Rutgers University, Marine and Coastal Sciences, New Brunswick, NJ, United States
Thursday 20 February 2020
15:00 – 15:15, SDCC – 11A, UL
IS43A-05 Sustained, High-Resolution Profiler Observations from the Washington Continental Slope
Craig M Risien1, Russell A Desiderio2, Laurie W Juranek1 and Jonathan P Fram1, (1) Oregon State University, College of Earth, Ocean, and Atmospheric Sciences, Corvallis, OR, United States, (2) Oregon State University, College of Earth, Ocean and Atmospheric Sciences, Corvallis, OR, United States
Friday 21 February 2020
08:00 – 10:00, SDCC – Poster Hall C-D; eLightning Theater
ED51A-03Seasonal Phytoplankton Production at the New England Shelf Break Front: Observations Using the Coastal Pioneer Array’s Submarine Gliders
Kyle Ehmann1, Samantha Ferguson1, Cassandra Este Alexander2 and Robert D Vaillancourt3, (1) Millersville University of Pennsylvania, Millersville, United States, (2) Millersville University of Pennsylvania, Millersville, PA, United States, (3) Millersville University, Millersville, PA, United States
08:15 – 08:30, SDCC – 11A, UL
IS51A-02A Review of the Regional Cabled Array in the Northeast Pacific
Rob Fatland, University of Washington Seattle Campus, IT, Seattle, WA, United States
09:00 – 09:15, SDCC – 11A, UL
IS51A-05 Plugged In: Novel Sensor Development by External Researchers for Deployment on the Ocean Observatories Initiative Regional Cabled Array
Michael Vardaro1, Orest Eduard Kawka2, Wendi Ruef2 and Deborah S Kelley3, (1) University of Washington Seattle Campus, Oceanography, Seattle, WA, United States, (2) University of Washington, School of Oceanography, Seattle, WA, United States, (3) University of Washington Seattle Campus, School of Oceanography, Seattle, WA, United States
09:15 – 09:30, SDCC – 11A, UL
IS51A-06 Sustained Observing from the Ocean Observatories Initiative (OOI)
Albert J Plueddemann, Woods Hole Oceanographic Institution, Woods Hole, MA, United States, John H Trowbridge, WHOI, Woods Hole, MA, United States, Edward Paul Dever, Oregon State University, Corvallis, OR, United States, Deborah S Kelley, University of Washington Seattle Campus, School of Oceanography, Seattle, WA, United States and Margaret Brennan-Tonetta, Rutgers University, Office of Economic Development, Piscataway, NJ, United States
11:45 – 12:00, SDCC – 5A, UL
OD52A-06 Echopype: Interoperable and Scalable Processing of Ocean Sonar Data
Wu-Jung Lee, University of Washington, Applied Physics Laboratory, Seattle, WA, United States, Valentina Staneva, University of Washington, eScience Institute, Seattle, WA, United States and Kavin Nguyen, University of Washington, Department of Physics, United States
POSTERS
Monday 17 February 2020
16:00 – 18:00, SDCC – Poster Hall C-D
CT14A-0835 Annual Oxygen Budget for the Subpolar North Atlantic using Air-calibrated Glider and Mooring Data from the Ocean Observatories Initiative Irminger Sea Array
Hilary I Palevsky, Boston College, Chestnut Hill, MA, United States, David P Nicholson, Woods Hole Oceanographic Inst., Woods Hole, MA, United States and Lucy Wanzer, Wellesley College, Geosciences, Wellesley, MA, United States
IS14D-3241 Bottom focused cameras on the OOI Endurance Array and their potential value to ocean ecology
Chris Holm, Oregon State University, CEOAS, Corvallis, OR, United States, Kristin Politano, Oregon State University, Integrative Biology, Corvallis, OR, United States, Jonathan P Fram, Oregon State University, College of Earth, Ocean, and Atmospheric Sciences, Corvallis, OR, United States and Edward Paul Dever, Oregon State University, Corvallis, OR, United States
Tuesday 18 February 2020
16:00 – 18:00, SDCC – Poster Hall C-D
ED24D-3628 Exploring seasonal variability in mixed layer depth with Ocean Observatories Initiative Ocean Data Labs
Rachel Eveleth, Oberlin College, Oberlin, United States, Karin Lemkau, Western Washington University, United States, Ian M Miller, Washington Sea Grant/Peninsula College, Port Angeles, WA, United States and Charles Sage Lichtenwalner, Rutgers University, Marine and Coastal Sciences, New Brunswick, NJ, United States
ED24D-3629 Implementation of Google Earth and OOI Data Exercises into an Introductory Oceanography Class
Cynthia Venn, Bloomsburg University, Environmental, Geographical & Geological Sciences, Bloomsburg University, Bloomsburg, PA, United States
ED24D-3630 Oceans and the Carbon Cycle: What Drives Air-Sea Exchange of CO2? Exploring Large Datasets from the Ocean Observing Initiative (OOI)
Robert C Rhew, University of California Berkeley, Geography Department, Berkeley, CA, United States, Nadia Pierrehumbert, Illinois Mathematics and Science Academy, Aurora, United States, Randal Reed, Shasta-Tehama-Trinity Joint Community College District, Red Bluff, United States, Charles Sage Lichtenwalner, Rutgers University, Marine and Coastal Sciences, New Brunswick, NJ, United States and Anna Pfeiffer-Herbert, Stockton University, Pomona, United States
ED24D-3631 Oceans of Data: Enhancing Data Literacy by Bringing Real Data into Introductory Oceanography Courses
Mikelle Nuwer1, Cheryl Lee Greengrove2, Julie E Masura2 and Deborah S Kelley3, (1) University of Washington, School of Oceanography, Seattle, WA, United States, (2) University of Washington Tacoma Campus, Tacoma, WA, United States, (3) University of Washington Seattle Campus, School of Oceanography, Seattle, WA, United States
ED24D-3632 Solving Challenges of Integrating Large Datasets into Community College Asynchronous Online Science Classes by Using a Scaffolding-Learning Cycle Approach to Teaching and Learning
Denise Bristol, Hillsborough Community College, Biological and Earth Sciences, Ruskin, FL, United States, Jessica Olney, Hillsborough Community College, Earth Sciences, Tampa, FL, United States and Peter A Sleszynski, Hillsborough Community College, Environmental Science and Technology, Plant City, FL, United States
ED24D-3633Using Ocean Observatory Initiative (OOI) Data to Enhance Student Learning about the Factors Affecting Primary Production in the Southern Hemisphere Polar Pacific Ocean.
Dina DiSantis, Montgomery County Community College, STEM Department, Pottstown, PA, United States, Jean Anastasia, Suffolk County Community College, Seldon, United States, Charles Sage Lichtenwalner, Rutgers University, Marine and Coastal Sciences, New Brunswick, NJ, United States and Matthew Iacchei, Hawaii Pacific University, Honolulu, HI, United States
ED24D-3634 Using OOI Datasets to Expand Quantitative Skills in an Introductory Oceanography Course
Elizabeth S Gordon, Fitchburg State University, Earth and Geographic Sciences, Fitchburg, MA, United States
MG24A-2190 Geophysical investigation of exchange between planetary oceans and rocky interior- knowledge from deep sea scenarios on Earth
Donna K Blackman, University of California Santa Cruz, Santa Cruz, CA, United States and Andrew T Fisher, University of California Santa Cruz, Earth and Planetary Sciences, Santa Cruz, CA, United States
IS24A-3273 CHEMINI: CHEmical MINIaturised analyser for in situ monitoring of macronutrients and bioactive metals in marine waters
Agathe Laes-Huon1, Romain Davy1, Léna Thomas1, Julien Legrand2, David Le Piver2, Patrick Rousseaux2, Jean-Yves Coail2, Michel Repecaud1, Karenn Bucas1, Cecile Cathalot3, Nicolas Gayet4, Jozee Sarrazin5 and Pierre-Marie Sarradin6, (1) IFREMER, REM/RDT/LDCM, Plouzané, France, (2) IFREMER, REM/RDT/SIIM, Plouzané, France, (3) IFREMER, REM/GM/LCG, Plouzané, France, (4) IFREMER, centre de Brest, LEP, Plouzané, France, (5) IFREMER, Centre de Bretagne, Plouzané, France, (6) IFREMER, Brest, France
OB24A-0445 Hypoxia in surface coastal waters at the entrance of the Gulf of California and its relation to coastal upwelling
Carlos Alberto Herrera Becerril, National Autonomous University of Mexico, Posgrado en Ciencias de la Tierra, Mexico City, DF, Mexico, Joan-Albert Sanchez-Cabeza, Universidad Nacional Autonoma de Mexico, Unidad Académica Mazatlán, Instituto de Ciencias del Mar y Limnología., Mexico City, SI, Mexico, Andrea Rebeca Lara Cera, National Autonomous University of Mexico, Facultad de Ciencias, México City, DF, Mexico, León Felipe Álvarez Sánchez, Instituto de Ciencias del Mar y Limnología, Universidad Nacional Autónoma de México, Ciudad de México, Unidad de Informática Marina, Mexico City, DF, Mexico, Maria Luisa Machain-Castillo, UNAM National Autonomous University of Mexico, Instituto de Ciencias del Mar y Limnología, Mexico City, DF, Mexico and Ana Carolina Ruiz-Fernández, Universidad Nacional Autonoma de Mexico, Unidad Académica Mazatlán, Instituto de Ciencias del Mar y Limnología, Mazatlán, SI, Mexico
ED24D-3631 Oceans of Data: Enhancing Data Literacy by Bringing Real Data into Introductory Oceanography Courses
Mikelle Nuwer1, Cheryl Lee Greengrove2, Julie E Masura2 and Deborah S Kelley3, (1) University of Washington, School of Oceanography, Seattle, WA, United States, (2) University of Washington Tacoma Campus, Tacoma, WA, United States, (3) University of Washington Seattle Campus, School of Oceanography, Seattle, WA, United States
Wednesday 19 February 2020
16:00 – 18:00, SDCC – Poster Hall C-D
IS34C Sustained Ocean Observing: From Events to Assessing Long-Term Ecosystem Patterns II
Michael W Lomas, Bigelow Laboratory for Ocean Sciences, East Boothbay, ME, United States, Richard K Dewey, Univ. of Victoria, Victoria, BC, Canada, John H Trowbridge, WHOI, Woods Hole, MA, United States and Damian Grundle, Bermuda Institute for Ocean Science, St. Georges, Bermuda
HE34A-1990 Enhancement of ocean and sea ice in situ observations in the Arctic under the Horizon2020 project INTAROS
Agnieszka Beszczynska-Möller1, Hanne Sagen2, Peter Voss3, Mikael Sejr4, Thomas Soltwedel5, Truls Johannessen6, Marie-Noelle Houssais7, Andreas Rogge5, Ian Allan8, Frank Nilsen9, Angelika Renner10, Lars Henrik Smedsrud6, Nicholas Roden6, Jean-Pierre Gattuso11, Laurent Chauvaud12, Claudie Marec12, Bin Cheng13, Andrew King8, Christine Provost7, Marcel Babin14 and Mathilde Sørensen15, (1) Institute of Oceanology Polish Academy of Sciences, Sopot, Poland, (2) Nansen Environmental and Remote Sensing Center, Bergen, Norway, (3) Geological Survey of Denmark and Greenland, København K, Denmark, (4) Aarhus University, Department of Bioscience, Aarhus, Denmark, (5) Alfred Wegener Institute Helmholtz-Center for Polar and Marine Research, Bremerhaven, Germany, (6) University of Bergen, Geophysical Institute, Bergen, Norway, (7) CNRS-LOCEAN, Paris, France, (8 )Norwegian Institute for Water Research, Oslo, Norway, (9) The University Centre in Svalbard, Longyearbyen, Norway, (10)Institute of Marine Research, Tromsø, Norway, (11)CNRS-INSU, Laboratoire d’Océanographie de Villefranche, Villefranche-sur-mer, France, (12) CNRS-UIEM, Brest, France, (13) Finnish Meteorological Institute, Helsinki, Finland, (14) Takuvik Joint International Laboratory, Université Laval & CNRS, Québec, QC, Canada, (15) University of Bergen, Department of Earth Sciences, Bergen, Norway
IS34C-3370 Disentangling human-induced x natural sediment resuspension events in Barkley Canyon, NE Pacific, using cabled observatory, mooring and vessel AIS data
Fabio Cabrera De Leo1,2, Grant Garner2, Pere Puig3 and Sarah Paradis4, (1) Ocean Networks Canada, University of Victoria, Victoria, BC, Canada, (2) University of Victoria, Department of Biology, Victoria, BC, Canada, (3) Inst Ciencies Mar CSIC, Barcelona, Spain, (4)Autonomous University of Barcelona (UAB), Departament de Física and Institut de Ciència i Tecnologia Ambientals, Barcelona, Spain
OB34A-0555 Whittard Canyon: a pathway and sink for organic carbon
Furu Mienis, Sofia Ledin, Marc Lavaleye and Gerard Duineveld, Royal Netherlands Institute for Sea Research, Den Burg, Netherlands
ME34D-0189 Cross-platform Ecosystem Assessment Through Characterization of Prey Habitat Suitability and Predator Occurrence off Newport, Oregon
Liz Ferguson, Ocean Science Analytics, San Diego, CA, United States
IS34A-3339 The Use of Open Source Scripting to Reduce Autonomous System Complexity and Cost
Andrea Rowe, United States and Chad Collett, SubC Imaging, Clarenville, NF, Canada
Thursday 20 February 2020
16:00 – 18:00, SDCC – Poster Hall C-D
AI44C-2440 Protocol for the Assessment and Correction of Moored Surface Water and Air pCO2 Measurements from the Ocean Observatories Initiative Endurance Array I Abstract
Christopher E Wingard, Edward P Dever, Jonathan P Fram and Craig M Risien, Oregon State University, College of Earth, Ocean, and Atmospheric Sciences, Corvallis, OR, United States
AI44A-2411 Event and Seasonal Scale Variability of Surface Heat and Momentum Fluxes off Oregon and Washington I Abstract
Edward Paul Dever1, Jonathan P Fram2, Craig M Risien2, Russell A Desiderio3 and Christopher E Wingard2, (1) Oregon State University, Corvallis, OR, United States, (2) Oregon State University, College of Earth, Ocean, and Atmospheric Sciences, Corvallis, OR, United States, (3) Oregon State University, College of Earth, Ocean and Atmospheric Sciences, Corvallis, OR, United States
IS44A-3404 New Tools for OOI Surface Profiler Data Delivery and Visualization I Abstract
Ian Black, Jonathan P Fram and Craig M Risien, Oregon State University, College of Earth, Ocean, and Atmospheric Sciences, Corvallis, OR, United States
OD44B-3494 Re-training a Joint U-Net-CNN Deep Learning Image Classification Pipeline for the Segmentation of Subsea Macrofauna I Abstract
Mitchell Scott1, Bhuvan Malladihalli Shashidhara2 and Aaron Marburg1, (1) Applied Physics Laboratory University of Washington, Seattle, WA, United States, (2) University of Washington, Seattle, WA, United States
OCEAN OBSERVING-RELATED SCHEDULE
WORKSHOPS
Sunday 16 February 2020
08:30 – 16:00, Marriott Marquis – Solana, L1
Data Labs: Using Ocean Observatory Initiative (OOI) Data to Engage Students in Oceanography
SESSIONS
Monday 17 February 2020
08:00 – 10:00, SDCC – 7B, UL
PI11A Biological Coupling to Physical Forcing on Shallow-Water Ecosystems: Using Observations to Reveal Patterns and Test Mechanisms I
08:00 – 10:00, SDCC – 15B, Mezzanine
PS11ATurbulent Mixing of the Ocean Surface Boundary Layer: Observation, Simulation, and Parameterization I
10:30 – 12:30, SDCC – 7B, UL
PI12A Biological Coupling to Physical Forcing on Shallow-Water Ecosystems: Using Observations to Reveal Patterns and Test Mechanisms II
10:30 – 12:30, SDCC – 15B, Mezzanine
PS12A Turbulent Mixing of the Ocean Surface Boundary Layer: Observation, Simulation, and Parameterization II
12:45 – 13:45, SDCC – 5A, UL
TH13C The NASA Surface Biology and Geology (SBG) mission and the observation of coastal and inland waters from space
14:00 – 16:00, SDCC – Poster Hall C-D; eLightning Theater
IS13B Emerging Ocean Technologies: A Snapchat of New Sensors and Observing Platforms I eLightning
14:00 – 16:00, SDCC – 15B, Mezzanine
PS13B Turbulent Mixing of the Ocean Surface Boundary Layer: Observation, Simulation, and Parameterization III
Tuesday 18 February 2020
08:00-10:00, SDCC – 1B, UL
HE21A Changing Biogeochemical Fluxes, Biodiversity, and Ecological Processes in the Polar Seas, with Special Emphasis on the Coastal Arctic and Sustaining an Integrated Arctic Ocean Observing System I
08:00-10:00, SDCC – 5A, UL
OM21A Advances in Ocean Data Assimilation, Forecasting, and Reanalysis I
14:00—16:00, SDCC – 5A, UL
OM23A Advances in Ocean Data Assimilation, Forecasting, and Reanalysis II
Wednesday 19 February 2020
08:00—10:00, SDCC – 14A, Mezzanine
AI31A Fluxes and Physical Processes Near the Air-Sea Interface: Observations and Modeling (Cosponsored by the AMS Committee on Air-Sea Interaction) I
08:00—10:00, SDCC – 1B, UL
HE31A Changing Biogeochemical Fluxes, Biodiversity, and Ecological Processes in the Polar Seas, with Special Emphasis on the Coastal Arctic and Sustaining an Integrated Arctic Ocean Observing System II
08:00—10:00, SDCC – 5A, UL
OM31A Advances in Ocean Data Assimilation, Forecasting, and Reanalysis III
12:45 – 13:45, Town Hall, SDCC – 11B, UL
TH33H Ocean Science Applications at the European Space Agency
14:00—16:00, SDCC – 14A, Mezzanine
AI33A Fluxes and Physical Processes Near the Air-Sea Interface: Observations and Modeling (Cosponsored by the AMS Committee on Air-Sea Interaction) II
14:00—16:00, SDCC – 5A, UL
OM33A Advances in Ocean Data Assimilation, Forecasting, and Reanalysis IV
Thursday 20 February 2020
08:00—10:00, SDCC – 14A, Mezzanine
AI41A Fluxes and Physical Processes Near the Air-Sea Interface: Observations and Modeling (Cosponsored by the AMS Committee on Air-Sea Interaction) III
08:00—10:00, SDCC – 15A, Mezzanine
Atlantic Ocean Variability in a Changing Climate: Observations, Modeling, and Theories I
10:30—12:30, SDCC – 11A, UL
IS42A Innovation in in Situ Instrumentation, Sensors, and Observation Networks to Advance High-Resolution Data Collection and Biogeochemical Insight in Marine Ecosystems II
10:30—12:30, SDCC – 5A, UL
OD42A New Information Systems Tools for Implementing Autonomous Multisource, Multipoint Observing Systems I
10:30—12:30, SDCC – 15A, Mezzanine
PL42A Atlantic Ocean Variability in a Changing Climate: Observations, Modeling, and Theories II
14:00-16:00, SDCC -11A, UL
IS43A Innovation in in Situ Instrumentation, Sensors, and Observation Networks to Advance High-Resolution Data Collection and Biogeochemical Insight in Marine Ecosystems III
14:00-16:00, SDCC – 15A, Mezzanine
PL43A Atlantic Ocean Variability in a Changing Climate: Observations, Modeling, and Theories III
Friday 21 February 2020
08:00—10:00, SDCC – 11A, UL
IS51A Sustained Ocean Observing: From Events to Assessing Long-Term Ecosystem Patterns I
10:30-12:30, SDCC – 11A, UL
IS52A The Tropical Pacific Observing System: Meeting the Needs of Researchers and Stakeholders I
10:30-12:30, SDCC – 7A, UL
ME52A Biologging Ecology and Oceanography: Integrative Approaches to Animal-Borne Observations in a Changing Ocean I
10:30-12:30, SDCC – 15A, Mezzanine
PS52B Multiscale Oceanic Processes and Air-Sea Interactions in the Kuroshio-Oyashio Extension Region: Observations and Modeling I
10:30-12:30, SDCC – SDCC – 10, UL
SI52A Ocean Renewable Energy and Synergies with Ocean Technologies II
TOWN HALLS
Tuesday 18 February 2020
12:45-13:45, SDCC – 4, UL
TH23B Ocean Partnerships for Sustained Observing: Moving Beyond the Frameworks
12:45-13:45, SDCC – 5A, UL
TH23C Observing Ocean Surface Currents from Local to Global Scales
12:45-13:45, SDCC – 9, UL
TH23G The Ocean Observatories Initiative: a catalyst for early-career, interdisciplinary research
18:30—19:30, SDCC – 9, UL
TH25F Progress Related to Global Deep Ocean Observing
Wednesday 19 February 2020
12:45—13:45, SDCC – 7A, UL
TH33I Expanding Access to Critical Marine Biological Diversity Observations
18:30 – 19:30, SDCC – 3, UL
TH35A NOAA Ocean Satellite Data Products for Science and Applications
18:30 – 19:30, SDCC – 5B, UL
TH35D Data FAIR: Ocean Data Integration – Challenges, Successes, Tools, and Platforms
18:30 – 19:30, SDCC – 9, UL
TH35G Capacity Development: A Major Need for Ocean Observing, Monitoring, Analysis and Forecasting
18:30 – 19:30, SDCC – 1B, UL
TH35H 20 years of the U.S. Integrated Ocean Observing System: Celebrating the successes and charting the future
18:30 – 19:30, SDCC – 8, UL
TH35I Observations for the Present and Future – A Panel of Vendors’ Views on Technology
Thursday 20 February 2020
12:45—13:45, SDCC – 3, UL
TH43A Ocean Observatories Initiative Facility Board Town Hall
12:45—13:45, SDCC -9, UL
TH43G IndOOS-2: A Roadmap to Better Observations and Predictions of the Rapidly Warming Indian Ocean
18:30-19:30, SDCC – SDCC – 7B, UL
TH45E Data FAIR: Ocean Data Viz – Beautiful Data, Understandable Visualizations
18:30-19:30, SDCC – SDCC – 7A, UL
TH45H All-Atlantic Ocean Observing System (AtlantOS program) Town Hall
POSTERS
Monday 17 February 2020
16:00 – 18:00, SDCC – Poster Hall C-D
ED14B Capacity Development: A Key Need for Global Ocean Observing Systems I Posters
16:00 – 18:00, SDCC – Poster Hall C-D
HE14B New Insights into the Beaufort Gyre of the Arctic Ocean: Scientific Questions, Observing Technologies, and Modeling Capabilities I Posters
16:00 – 18:00, SDCC – Poster Hall C-D
IS14B Emerging Ocean Technologies: A Snapchat of New Sensors and Observing Platforms II Posters
16:00 – 18:00, SDCC – Poster Hall C-D
PI14A Biological Coupling to Physical Forcing on Shallow-Water Ecosystems: Using Observations to Reveal Patterns and Test Mechanisms III Posters
16:00 – 18:00, SDCC – Poster Hall C-D
PS14BTurbulent Mixing of the Ocean Surface Boundary Layer: Observation, Simulation, and Parameterization V Posters
Tuesday 18 February 2020
16:00—18:00, SDCC – Poster Hall C-D
16:00—18:00, SDCC – Poster Hall C-D
IS24A Autonomous Observing Systems for Macronutrients and Bioactive Trace Metals in Coastal and Open-Ocean Settings: Present Status, Challenges, and Emerging Technologies I Posters
16:00—18:00, SDCC – Poster Hall C-D
OM24B Advances in Ocean Data Assimilation, Forecasting, and Reanalysis V Posters
16:00—18:00, SDCC – Poster Hall C-D
PL24B Atlantic Ocean Variability in a Changing Climate: Observations, Modeling, and Theories IV Posters
16:00—18:00, SDCC – Poster Hall C-D
PS24B Turbulent Mixing of the Ocean Surface Boundary Layer: Observation, Simulation, and Parameterization IV Posters
Wednesday 19 February 2020
16:00 – 18:00, SDCC – Poster Hall C-D
AI34A Fluxes and Physical Processes Near the Air-Sea Interface: Observations and Modeling (Cosponsored by the AMS Committee on Air-Sea Interaction) V Posters
16:00 – 18:00, SDCC – Poster Hall C-D
HE34A Changing Biogeochemical Fluxes, Biodiversity, and Ecological Processes in the Polar Seas, with Special Emphasis on the Coastal Arctic and Sustaining an Integrated Arctic Ocean Observing System III Posters
16:00 – 18:00, SDCC – Poster Hall C-D
HE34B Changing Biogeochemical Fluxes, Biodiversity, and Ecological Processes in the Polar Seas, with Special Emphasis on the Coastal Arctic and Sustaining an Integrated Arctic Ocean Observing System IV Posters
16:00 – 18:00, SDCC – Poster Hall C-D
IS34B Best Practices for Building a Global Ocean Observing System Responsive to Societal Needs by Linking Basin-Scale Efforts Around the Globe I Posters
16:00 – 18:00, SDCC – Poster Hall C-D
FIS34C Sustained Ocean Observing: From Events to Assessing Long-Term Ecosystem Patterns II Posters
16:00 – 18:00, SDCC – Poster Hall C-D
IS34D The Tropical Pacific Observing System: Meeting the Needs of Researchers and Stakeholders II Posters
16:00 – 18:00, SDCC – Poster Hall C-D
ME34A Biologging Ecology and Oceanography: Integrative Approaches to Animal-Borne Observations in a Changing Ocean II Posters
16:00 – 18:00, SDCC – Poster Hall C-D
ME34E What Are Long-Term Observations Teaching Us About Resilience of Marine Ecosystems? I Posters
16:00 – 18:00, SDCC – Poster Hall C-D
OD34D New Information Systems Tools for Implementing Autonomous Multisource, Multipoint Observing Systems II Posters
16:00 – 18:00, SDCC – Poster Hall C-D
OM34A Advances in Ocean Data Assimilation, Forecasting, and Reanalysis VI Posters
16:00 – 18:00, SDCC – Poster Hall C-D
PL34A Atlantic Ocean Variability in a Changing Climate: Observations, Modeling, and Theories V Posters
16:00 – 18:00, SDCC – Poster Hall C-D
PS34C Observing the Ocean Surface Topography at High Resolution: Opportunities and Challenges for the Future SWOT Mission II Posters
Thursday 20 February 2020
16:00-18:00, SDCC – Poster Hall C-D
AI44A Fluxes and Physical Processes Near the Air-Sea Interface: Observations and Modeling (Cosponsored by the AMS Committee on Air-Sea Interaction) VI Posters
16:00-18:00, SDCC – Poster Hall C-D
IS44A Innovation in in Situ Instrumentation, Sensors, and Observation Networks to Advance High-Resolution Data Collection and Biogeochemical Insight in Marine Ecosystems IV Posters
16:00-18:00, SDCC – Poster Hall C-D
PS44B Multiscale Oceanic Processes and Air-Sea Interactions in the Kuroshio-Oyashio Extension Region: Observations and Modeling II Posters
Read More
ANNOUNCEMENT – OOI Facilities Board Town Hall at the 2020 Ocean Sciences Meeting – Call for Lightning Talks
ANNOUNCEMENT – OOI Facilities Board Town Hall at the 2020 Ocean Sciences Meeting – Call for Lightning Talks
The Ocean Observatories Initiative Facilities Board (OOIFB) will host a Town Hall at the 2020 Ocean Sciences Meeting in San Diego, CA. The Town Hall is scheduled for Thursday, February 20th from 12:45 pm to 1:45 pm at the San Diego Convention Center, 3, UL. The community will have the opportunity to hear the latest information about the OOI facility, meet the OOIFB members, and learn about research using OOI data.
Sign-up now to present a lightning talk – The Town Hall will include a series of lightning presentations where scientists are invited to present one slide in one minute explaining how s/he has used (or plans to use) freely available observatory data in their respective research. In this Town Hall we will expand beyond OOI, and encourage users of other observatories to also share their experiences in applying observatory data in their respective research. We hope you will consider presenting a slide in the lightning session. If you are using observatory data (OOI, NCAR, NEON, etc.) and wish to present a lightning talk during the Town Hall, please sign up at <https://forms.gle/iF7kwarAXiZT2Hga9> by February 9th (time during the Town Hall is limited and we will try to accommodate as many talks as possible).
The Town Hall is aimed at researchers who are using or are considering using OOI data, researchers interested in adding instrumentation to the OOI infrastructure, and educators at all levels interested in the OOI.
Event: OOI Facility Board Town Hall
When: Thursday, February 20th from 12:45 pm to 1:45 pm
Where: San Diego Convention Center, 3, UL – San Diego, CA
Additional information and updates about the OOIFB Town Hall can be found at: https://ooifb.org/meetings/2020-ocean-sciences-meeting-ooifb-town-hall/
Thank you and we hope to see you at the OOIFB Town Hall!
Read More