
Facilitating Observatory-Based Subseafloor Science
Data flowing from the Regional Cabled Array forms an unparalleled foundation to understand the relationships between microbial, hydrological, geochemical, and geophysical processes in active oceanic crust. Proposed Axial drilling will provide a unique opportunity to determine the nature of subseafloor hydrological properties and develop a 3-D understanding of subseafloor processes in unsedimented crust.
Read MoreDiscovery of Axial Seamount Deep Melt-Mush Feeder Conduit
Recent observations at Axial Seamount provide new seismic images of the deep magma plumbing system, revealing a stacked sill complex beneath the main magma reservoir of this submarine volcano. The discovery of this deep melt-mush conduit at Axial, where long-term monitoring observations are supported by the Regional Cabled Array, is providing new understanding of magmatic systems on Earth.
Read MorePythias Oasis: The First-of-Its-Kind Seep in the Oceans
Adapted and condensed by OOI from Philip, et al., 2023, doi: 10.1126/sciadv.add6688.
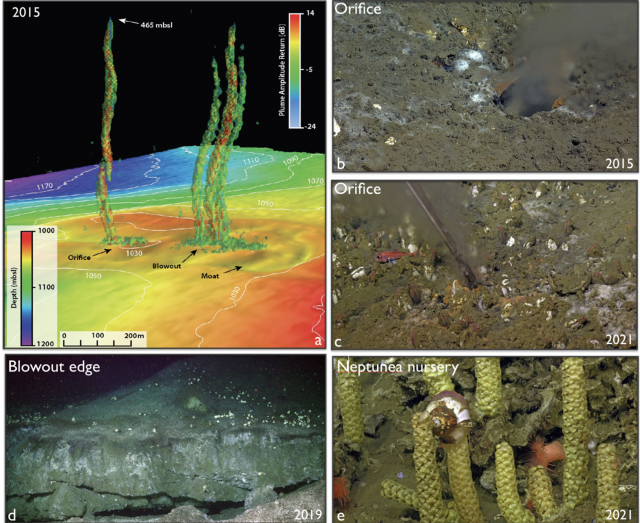
[media-caption path="/wp-content/uploads/2023/01/Screen-Shot-2023-01-26-at-10.21.55-AM.png" link="#"] a) A multibeam sonar image of the methane bubble plumes at Pythias Oasis in 2015. b) Pythias orifice in 2015 showing the fluid-dominated, sediment-rich plume, as first visualized on the discovery dive by the ROV ROPOS. The main orifice has been continuously active since 2015. c) Pythias’ orifice in 2021 with increased biological communities and a small Fe-rich chimney. d) The edge of a large collapse-blowout zone – coring across this area in 2019 recovered substantial methane hydrate. e) A Neptunea snail nursery between the orifice site and the blowout zone.[/media-caption]Pythias Oasis is the first-of-its-kind seep in the oceans, providing a window into controls on megathrust events along the Cascadia Margin. Pythias Oasis, discovered during the 2015 Regional Cabled Array (RCA) Operations and Maintenance Cruise, utilizing the hull-mounted sonar on the R/V Thompson, is unlike any seep site yet described along active margins with unprecedented fluid chemistries (Figure above). It hosts an intense fluid-dominated venting system issuing low-salinity, hydrocarbon-bearing fluids carrying low concentrations of suspended particles from a discrete orifice that has been continuously active since 2015. Detailed sampling, as part of an NSF OCE-funded expedition in 2019 (OCE 16582901), and another dive in 2021 (added onto the RCA 2021 cruise) show that the fresh, warm fluids (four times background temperatures) are venting at the highest discharge rates yet measured within the Cascadia Subduction Zone (CSZ) and that the fluids are extremely enriched in boron lithium and iron.
Pythias Oasis provides a rare window into processes acting deep in the margin with fluid chemistries indicating that the fluids are sourced near the plate boundary in the Central CSZ at minimum temperatures of 150-250°C. The high discharge rates are thought to reflect draining of fluids along an over-pressurized reservoir associated with the subduction zone-perpendicular Alvin Canyon strike slip fault, suggesting that the faults regulate pore fluid pressure and megathrust slip behavior along the Central CSZ.
Results from this work are presented in Philip, B.T., E.A. Solomon, D.S. Kelley, A.M. Tréhu, T.L. Whorley, E. Roland, M. Tominaga, and R.W. Collier (2023) Fluid sources and overpressures within the central Cascadia Subduction Zone revealed by a warm, high-flux seafloor seep. Science Advances (9), doi: 10.1126/sciadv.add6688.
Read MoreVisions’22: Changing Students Lives
From Deb Kelley, UW, in OOI Quarterly Report, 2022.
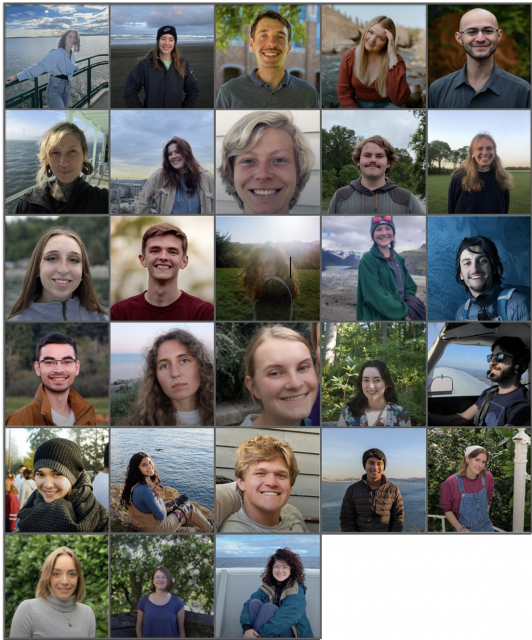
This year, 25 undergraduate students and three graduate students participated on the Regional Cabled Array Operations and Maintenance cruise as part of the VISIONS’22 at-sea experiential learning program. They include students from the US, India, Saudi Arabia, France, and Kazakhstan. They represent a breadth of disciplines spanning Oceanography (11), Engineering (9: Mechanical, Industrial, Bioengineering, Environmental, and Aeronautics and Astronautics), Biology (6: Biology, Marine Biology, and Microbiology), Geology (1), and Policy Studies focused on the United Nations Convention (1). They stood 4 hour-on, 8 hour-off watches in the remotely controlled vehicle, ROPOS control center, learned how to conduct CTD casts and collect and process fluid samples, and worked on deck. Three additional undergraduate student ambassadors, who have participated in past VISIONS’ expeditions (1-3 years), helped mentor the students. All completed cruise blogs on the Interactiveoceans VISIONS’22 Expedition site, and science-engineering and/or engagement projects that will last a quarter to several years. Two students chose projects involving advanced genetic analyses of vent animals and protists for their Senior Thesis in Oceanography. Based on discussions with past students and what they relayed in their blogs, for many this is a life changing experience. Note: two past VISIONS students are now APL engineers as part of the RCA team.
Read More
Axial Seamount Continues to Reveal Its Secrets
Adapted and condensed by OOI from Chadwick et al., 2022, doi:/10.1029/2021GC010153.
Axial Seamount is the longest monitored mid-ocean ridge volcano, providing new insights into the relationships among magma supply, uplift-deflation behavior, and seismicity leading to and follow eruptions. Results are as summarized here.
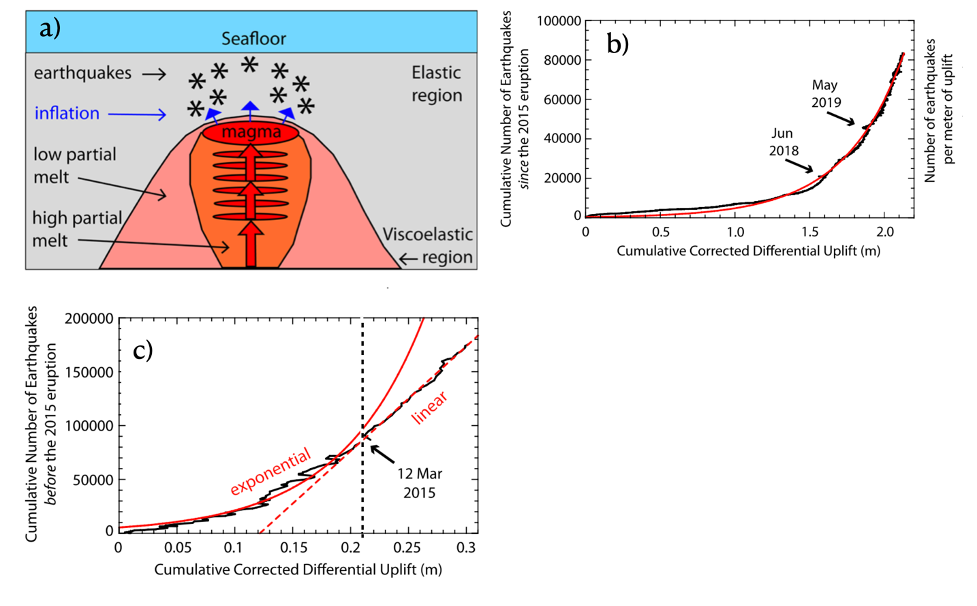
[media-caption path="/wp-content/uploads/2022/02/Axial.png" link="#"]a) Cross section cartoon showing shallow magma chamber beneath Axial fed by a series of stacked sills. Upward migrating of melt through the sills results increases pressure in the shallow chamber causing uplift and associated earthquakes. b) Exponential increase in earthquakes per meter of uplift since the 2015 eruption. c) Earthquakes per meter of uplift before March 12, 2015 follow an exponential increase, while post this day earthquakes follow a linear trend leading up to the April 24, 2015 eruption. (After Chadwick et al., 2022; Figures 6 and 13).[/media-caption]The magma supply rate has changed significantly over periods of months to years. Since the 2015 eruption, the summit of the volcano has been inflating at a decreasing rate. This re-inflation was punctuated by eight discrete short-term deflation events occurring over 1-3 weeks, approximately every 4-6 months from August 2016 to May 2019. These deflation events were coincident with an abrupt decrease in seismic activity, which did not pick up until reinflation resumed. In contrast, the long-term monitoring indicates that there was a surge in magma supply between 2011 and 2015, resulting in the two eruptions closely spaced in time.
Although the summit of the volcano has inflated 85%-90% of its pre 2015 eruption level, the geodetic and seismic monitoring suggests that the magma supply rate has been waning since 2015, pushing the forecast for the next eruption out 4-9 years. The data since 2015 also show that the deformation and seismic activity are tightly coupled, showing an exponential increase in seismic activity per unit of uplift. A significant conclusion from this study is that the transition from an exponential to linear increase in seismic activity to total uplift may indicate impending crustal failure between the shallow magma chamber and the seafloor. In concert, these results may lead to more refined forecasting of future eruptions of this highly active volcano and the testing of hypotheses concerning the short-term deflation events.
__________________________________________________________
Chadwick, W.W., Jr., W.S.D. Wilcock, S.L. Nooner, J.W Beeson, A.M. Sawyer, and T.-K. Lau (2022) Geodetic monitoring at Axial Seamount since its 2015 eruption reveals a waning magma supply and tightly linked rates of deformation and seismicity. Geochemistry, Geophysics, Geosystems, 23, e2021GC01053.
Read MorePI Cabled Instrument Provides Real-Time Sonar Measurements of Hydrothermal Plume Emissions
Adapted and condensed by OOI from Xu et al., 2022, doi:/10.1029/2020EA001269.
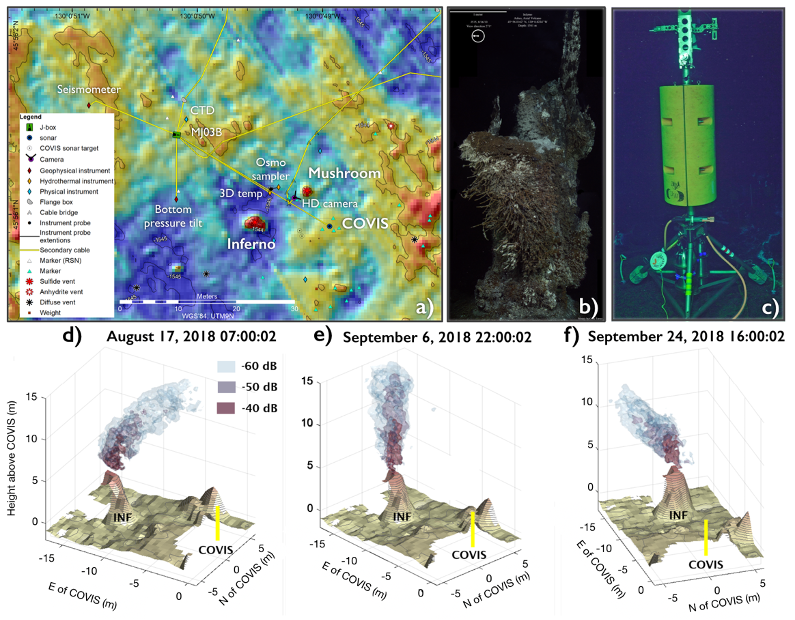
[media-caption path="https://oceanobservatories.org/wp-content/uploads/2021/02/RCA-FOR-SCIENCE-HIGHLIGHTS.png" link="#"]Figure 26. a) Location of the COVIS sonar and RCA infrastructure in the ASHES Hydrothermal Field. Also shown are locations of the active ~ 4 m tall hydrothermal edifices ‘Mushroom’ and ‘Inferno’. c) The COVIS sonar in 2019 (Credit: Rutgers/UW/NSF-OOI/WHOI). The tower is 4.2 m tall and hosts a modified Reson 7125 SeaBat multibeam sonar mounted on a tri-axial rotator. The system was built by the UW Applied Physics Laboratory. d) Selected time-series images from COVIS showing bending of the plume eastward, e) a nearly vertical plume, and f) southward bending of the plume (after Fig. 7 Xu et al., 2020).[/media-caption]The Cabled Observatory Vent Imaging Sonar (COVIS) was installed on the OOI RCA in the ASHES hydrothermal field (Fig. 26 a-c) at the summit of Axial Seamount in 2018, resulting in the first long-term, quantitative monitoring of plume emissions (Xu et al., 2020). The sonar provides 3-dimensional backscatter images of buoyant plumes above the actively venting ‘Inferno’ and ‘Mushroom’ edifices, and two-dimensional maps of diffuse flow at temporal frequencies of 15 and 2 minutes, respectively. Sonar data coupled with in-situ thermal measurements document significant changes in plume variations (Fig. 26 d-f) and modeling results indicate a heat flux of 10 MW for the Inferno plume (Xu et al., 2020). COVIS will provide key data to the community investigating the impacts of eruptions on hydrothermal flow at this highly active volcano.
[1] Xu, G., Bemis, K., Jackson, D., and Ivakin, A., (2020) Acoustic and in-situ observations of deep seafloor hydrothermal discharge: OOI Cabled Array ASHES vent field case study. Earth and Space Science. Note: This project was funded by the National Science Foundation through an award to PI Dr. K. Bemis, Rutgers University – “Collaborative Research: Heat flow mapping and quantification at ASHES hydrothermal vent field using an observatory imaging sonar (#1736702). COVIS data are available through oceanobservatories.org.
Read MoreUnderstanding Factors Controlling Seismic Activity Along the Cascadia Margin
Excerpted from the OOI Quarterly Report, 2022.
The Cascadia Subduction Zone extends from northern California to British Columbia. It has experienced magnitude 9 megathrust events with a reoccurrence rate of every ~500 years over the past 10,000 years [5] and large earthquakes at intervals of ~ 200-1200 years [6]. The last Cascadia megathrust rupture occurred on January 26, 1700 [5]. When the next event occurs, it is estimated that financial losses would be ~ $60 billion USD with substantial loss of life. Hence, there is significant research focused on understanding seismic processes along this ~ 1100 km subduction zone, the generation of slow earthquakes, and causes of variation in seismicity along strike.
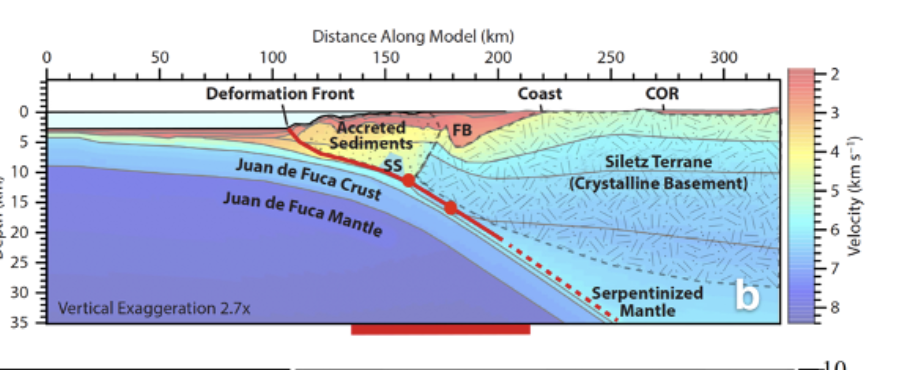
[media-caption path="/wp-content/uploads/2020/10/RCA-science-highlight-pic.png" link="#"]Figure 20. Earthquake generating processes in the central portion of the Cascadia Margin. a) Location of ≥4 magnitude earthquakes (red dots) 1989-August 2017 from the Advanced National Seismic System Comprehensive Earthquake catalog. The short dashed line is the 450°C contour, and short-long dashed line is the updip limit of tremor from 2005-2011 [after 1]. b) Interpreted cross section through the Cascadia Subduction Zone crossing the location of the Regional Cabled Array (RCA) margin sites. Red dots are projected positions of two 4.7-4.8 magnitude earthquakes in 2004 [1]. Basement rocks of the upper plate – the Siletz Terrane – comprise accreted anomalously thick mafic oceanic crust [1-3]. SS indicates the position of a subducted seamount west of the Siletz terrane [1]. c) Detected seismicity (blue dots – 222 earthquakes) approximately centered on the location of RCA ocean bottom seismometers on the Juan de Fuca Plate at Slope Base and on the margin at Southern Hydrate Ridge (purple triangles) [4]. Dot size is proportional to magnitude. A southern cluster centered at depths of ~ 5-10 km, is associated with the location of the subducted seamount, while the northern cluster may be associated with possibly accreted seamount [4].)[/media-caption]Understanding the factors that control seismic events was/is a major driver in the siting of OOI-RCA core geophysical instrumentation on the southern line of the Regional Cabled Array: the RCA is one of the few places in the world where seismic-focused instrumentation occurs on both the down-going tectonic plate and on the overlying margin. The offshore network is especially valuable in determining earthquake source depths that inform on interpolate dynamics [1]. The central section of the Cascadia Margin is the only area that experiences repeat, measurable shallow crustal earthquakes [1-3]. RCA data flowing from the seismic network at Slope Base and Southern Hydrate Ridge, and from the Cascadia Initiative are providing new insights into factors controlling seismicity along this portion of the margin [1,4] (note because the RCA broadband seismometers are buried, they have lower noise levels at higher frequencies than the Cascadia Initiative instruments [1]).
Most recently, Morton et al., [4] examined data from the Cascadia Initiative [7] and the RCA. Shallow earthquakes are focused in the area of a subducted seamount [1-3] and another cluster to the north (Fig. 1b and c). Based on earthquake locations, they suggest that subduction of the seamount produces stress heterogeneities, faulting, fracturing of the overriding Siletz terrane (old oceanic crust) (Fig 1b), and fluid movement promoting seismic swarms. Because this area is the most seismically active area along the Cascadia margin, it is an optimal area to examine the impacts of local earthquakes on, for example, gas hydrate deposits and fluid expulsion.
[1] Tréhu, A.M., Wilcock, W.S.D., Hilmo, R., Bodin, P., Connolly, J., Roland, E.C., and Braunmiller, R., (2018) The role of the Ocean Observatories Initiative in Monitoring the offshore earthquake activity of the Cascadia Subduction Zone. Oceanography, 31, 104-113.
[2] Tréhu, A.M., Blakely, R.J., and Williams, M., (2012) Subducted seamounts and recent earthquakes beneath the central Cascadia Forearc. Geology, 40, 103-106.
[3] Tréhu, A.M., Braunmiller, J., and Davis, E., (2015) Seismicity of the Central Cascadia Continental Margin near 44.5° N: a decadal view. Seismological Research Letters, 86, 819-829.
[4] Morton, Bilek, S.L., and Rowe, C.A. (2018) Newly detected earthquakes in the Cascadia subduction zone linked to seamount subduction and deformed upper plate. Geology, 46, 943-946.
[5] Satake, K.Shimazaki, K., Tsuji, Y., and Ueda, K., (1996) Time and size of a giant earthquake in Cascadia inferred from Japanese tsunami records of January 1700. Nature, 379, 246-249.
[6] Goldfinger, C., Nelson, C.H., Eriksson, E., et al., (2012) Turbidite event history: Methods and implications for Holocene paleoseismicity of the Cascadia Subduction Zone. US Geological Survey Professional Paper (1661-F), 184 pp.
[7] Toomey, D.R., Allen, R.M., Barclay, A.H., Bell, S.W., Bromirski, P.D. et al., (2014) The Cascadia Initiative: A sea change in seismological studies of subduction zones. Oceanography, 27, 138-150.
Read More
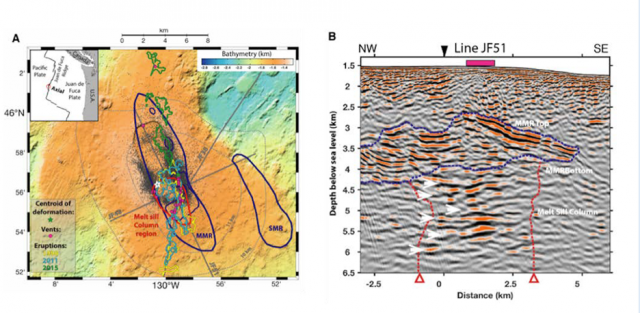
Discovery of the Roots of the Axial Seamount
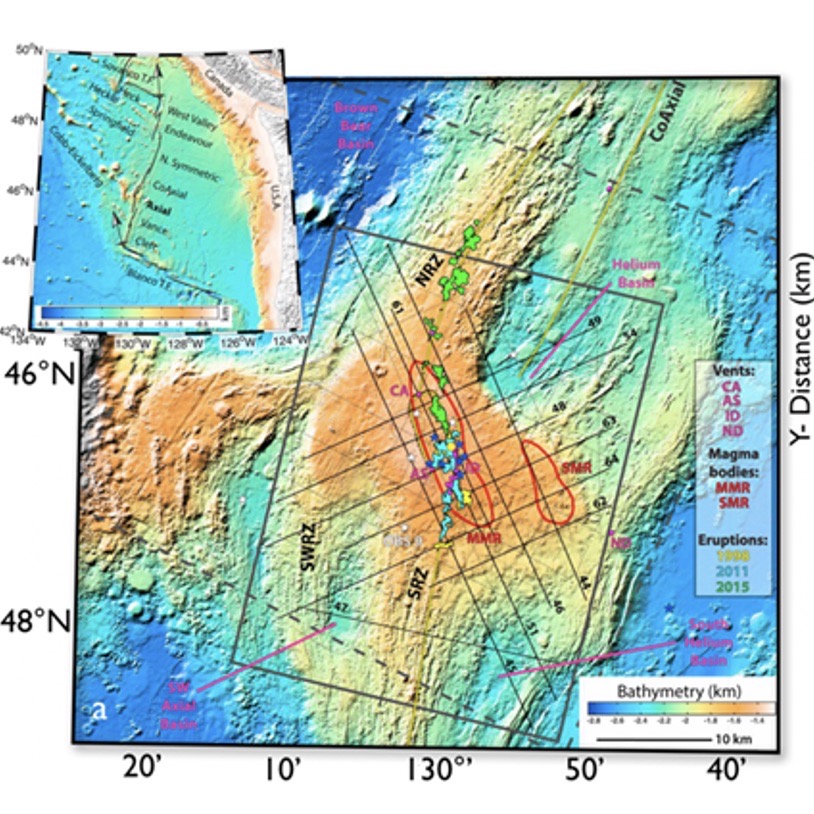
Excerpted from the OOI Quarterly Report, 2020.
[media-caption type="image" class="external" path="https://oceanobservatories.org/wp-content/uploads/2020/09/Screen-Shot-2020-09-17-at-1.21.46-PM.png" alt="Axial Seamount Roots" link="#"]. Figure 14: a) Location of 1998, 2011, and 2015 lava flows at the summit of Axial Seamount, two magma chambers (re outlines MMR & SMR) and seismic lines (after [1]). b) Map view and perspective view of the MMR magma reservoir, seismicity and fault mechanisms from 10/2014 to 9/2015 (after [1]).[/media-caption]Two- and 3D-imaging of Axial Seamount, coupled with real-time monitoring of seismicity and seafloor deformation, is providing unprecedented insights into submarine volcanism, the nature of melt transport, and caldera dynamics (Figure 14) [1-15]. Recently acquired 3D imaging of the volcano [2] and analyses of 1999 and 2002 multichannel seismic data [4-7] have led to the remarkable discovery of a root zone 6 km beneath the volcano [2,5]. Carbotte et al., [5] describe a 3-to-5 km wide conduit that is interpreted to be comprised of numerous quasi-horizontal melt lenses spaced 400-500 m apart. The conduit is located beneath a 14-km-long magma reservoir (MMR) that spans the caldera of Axial Seamount and a secondary, smaller magma chamber (SMR) located beneath the eastern flank of the volcano [1,3]. This smaller reservoir presumably Dymond hydrothermal field hosting up to 60 m-tall actively venting chimneys, which was discovered on a 2011 RCA cruise. Seismicity prior to, during and subsequent to the 2015 eruption delineates outward dipping normal faults in the southern half of the caldera that extend from near the seafloor to 3-3.25 km depth [3,8-9]. In contrast, a conjugate set of inward dipping faults in the northern portion of the caldera extend to depths of ~ 2.25 km. The outward dipping ring faults were active during inflation and syn-eruptive deformation [[3,8-9]. Source fissures for the 1998, 2011, and 2015 eruptions are located within ± 1 km of where the MMR roof is shallowest (<1.6 km beneath the seafloor) and skewed toward the eastern caldera wall [3]. In concert, these studies are changing long-held views of magma chamber geometry and the deep-rooted feeder systems in mid-ocean ridge environments [2,5].
[1] Arnulf, A. F., Harding, A. J., Kent, G. M., Carbotte, S. M., Canales, J. P., and Nedimovic, M. R. (2014) Anatomy of an active submarine volcano. Geology, 42(8), 655–658. https://doi.org/10.1130/G35629.1.
[2] Arnulf, A.F., Harding, A.J., Saustrup, S., Kell, A.M., Kent, G.M., Carbott, S.M., Canales, J.P., Nedimovic, M.R., Bellucci M., Brandt, S., Cap, A., Eischen, T.E., Goulin, M., Griffiths, M., Lee, M., Lucas, V., Mitchell, S.J., and Oller, B. (2019) Imaging the internal workings of Axial Seamount on the Juan de Fuca Ridge. American Geophysical Union, Fall Meeting 2019, OS51B-1483.
[3] Arnulf, A.F., Harding, A.J., Kent, G.M., and Wilcock, W.S.D. (2018) Structure, seismicity and accretionary processes at the hot-spot influenced Axial Seamount on the Juan de Fuca Ridge. Journal of Geophysical Research, 10.1029/2017JB015131.
[4] Carbotte, S. M., Nedimovic, M. R., Canales, J. P., Kent, G. M., Harding, A. J., and Marjanovic, M. (2008) Variable crustal structure along the Juan de Fuca Ridge: Influence of on-axis hot spots and absolute plate motions. Geochemistry, Geophysics, Geosystems, 9, Q08001. doi.org/10.1029/2007GC001922.
[5] Carbotte, S.M., Arnulf, A.F., Spiegelman, M.W., Harding, A.J., Kent, G.M., Canales, J.P., and Nedimovic, M.R. (2019) Seismic images of a deep melt-mush feeder conduit beneath Axial Volcano. American Geophysical Union, Fall Meeting 2019, OS51B-1484.
[6] West, M., Menke, W., and Tolstoy, M. (2003) Focused magma supply at the intersection of the Cobb hotspot and the Juan de Fuca ridge. Geophysical Research Letters, 30(14), 1724. https://doi.org/10.1029/2003GL017104.
[7] West, M., Menke, W., Tolstoy, M., Webb, S., and Sohn, R. (2001). Magma storage beneath Axial volcano on the Juan de Fuca mid-ocean ridge. Nature, 413(6858), 833–836. doi.org/10.1038/35101581.
[8] Wilcock, W.S.D., Tolstoy, M., Waldhauser, F., Garcia, C., Tan, Y.J., Bohnenstiehl, D.R., Caplan-Auerbach, J., Dziak, R., Arnulf, A.F., and Mann, M.E. (2016) Seismic constraints on caldera dynamics from the 2015 Axial Seamount eruption. Science, 354, 1395-399; https://doi.org/10.1126 /science.aah5563.
[9] Wilcock, W.S.D., Dziak, R.P., Tolstoy, M., Chadwick, W.W., Jr., Nooner, S.L., Bohnenstiehl, D.R., Caplan-Auerbach, J., Waldhauser, F., Arnulf, A.F., Baillard, C., Lau, T., Haxel, J.H., Tan, Y.J, Garcia, C., Levy, S., and Mann, M.E. (2018) The recent volcanic history of Axial Seamount: Geophysical insights into past eruption dynamics with an eye toward enhanced observations of future eruptions. Oceanography, 31,(1), 114-123.
[10] Chadwick, W.W., Jr., Nooner, S.L., and Lau, T.K.A. (2019) Forecasting the next eruption at Axial Seamount based on an inflation-predictable pattern of deformation. American Geophysical Union, Fall Meeting 2019, OS51B-1489.
[11] Chadwick, W.W., Jr., Paduan, J.B., Clague, D.A., Dreyer, B.M., Merle, S.G. Bobbitt, A.M. Bobbitt, Caress, D.W. Caress, Philip, B.T., Kelley, D.S., and Nooner, S. (2016) Voluminous eruption from a zoned magma body after an increase in supply rate at Axial Seamount. Geophysical Research Letters, 43, 12,063-12,070; https://doi. org/10.1002/2016GL071327.
[12] Nooner, S.L., and Chadwick, W.W. Jr. (2016) Inflation- predictable behavior and co-eruption deformation at Axial Seamount. Science, 354, 1399-1403; https://doi.org/10.1126/ science.aah4666.
[13] Nooner, S.L., and Chadwick, W.W. Jr. (2016) Inflation- predictable behavior and co-eruption deformation at Axial Seamount. Science, 354, 1399-1403; https://doi.org/10.1126/ science.aah4666.
[14] Hefner, W.L., Nooner, S.L., Chadwick, W.W., Jr., and Bohnenstiehl, D.R. (2020) Magmatic deformation models including caldera-ring faulting for the 2015 eruption of Axial Seamount. Journal of Geophysical Research, https://doi:10.1029/2020JB019356.
[15] Levy, S., Bohnenstiehl, D.R., Sprinkle, R., Boettcher, M.S., Wilcock, W.S.D., Tolstoy, M., and Waldhouser, F. (2018) Mechanics of fault reactivation before, during, and after the 2015 eruption of Axial Seamount. Geology, 46(5), 447-450; https://doi.org/10.1130/G39978.1.
Read More
Axial Seamount: One of the Longest Records for Tsunami Research in the Ocean
Adapted and condensed by OOI from Fine et al., 2020, doi:/10.1029/2020GL087372.
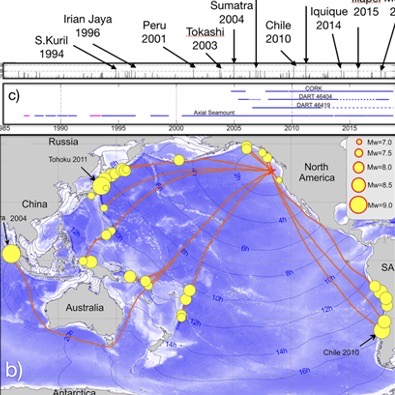
[caption id="attachment_18951" align="aligncenter" width="794"]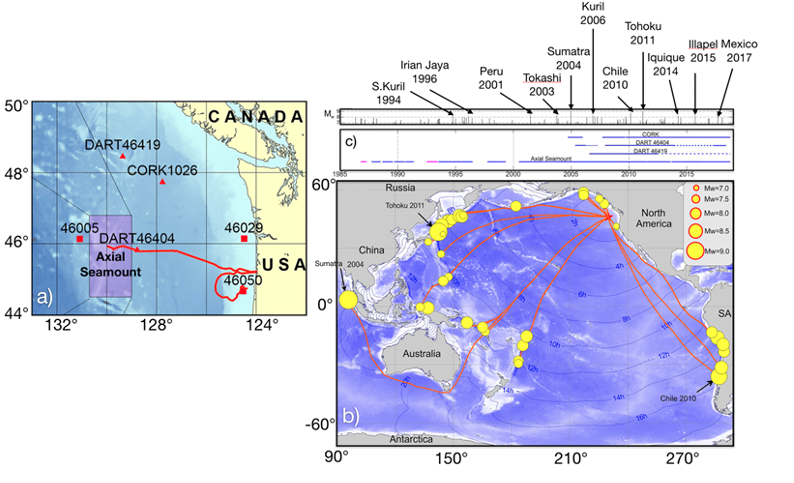 Figure 22. a) Location of bottom pressure recorders (BPRS) at Axial Seamount and vicinity (Cleft segment not shown in this illustration), including DART buoys and an IODP Corked site (after [1]). Most of the pressure data for this investigation were from Axial Seamount. b) Source regionals for the tsunamis recorded at Axial with yellow circles indicating earthquake locations and circle size proportional to magnitudes. The thin blue lines mark the leading edge of tsunamis at 2 hr intervals after an earthquake. c) Temporal coverage of the BPR records and recorded tsunamis at Axial and adjacent areas 1986-2018. Magenta lines are BPR recordings from the Cleft Segment, south of Axial on the Juan de Fuca Ridge.[/caption]This study by Fine et al., [1] examines a 32 year record of high resolution bottom pressure recorder (BPR) measurements made by cabled instruments installed on Axial Seamount in 2014, and uncabled instruments at Axial, the Cleft Segment of the Juan de Fuca Ridge, DART buoys, and an IODP cored observatory (Hole 1026): most of the measurements in this study are from Axial (Figure 22). A total of 41 tsunamis were documented from 1986-2018 with all events associated with tsunamigenic earthquakes with magnitudes of 7.0 or greater. In contrast to coastal tide gauge observations, open ocean measurements by BPRs are advantageous because of the high signal-to-noise ratio. Based on this study, it is possible to forecast the effect of a tsunami originating from a source near a historical source, not only for Axial, but also for locations along the British Columbia‐Washington‐Oregon coast. These results allow a size-frequency model world-wide. The RCA cabled bottom pressure-tilt instruments, with 20 Hz sampling rates and with resolutions of 2 mm of seawater depth, provide especially high-resolution measurements.
[1] Fine, I.V., Thomson, R.E., Chadwick, W.W., Jr., and Fox, C.G., (2020) Toward a universal frequency occurrence distribution for tsunamis: statistical analyses of a 32-year bottom pressure record at Axial Seamount. Geophysical Research Letter, https://doi.org/10.1029/2020GL087372.
Read More
Explosive Bubble Plume Emissions from Southern Hydrate Ridge
From Marcon and Bohrmann, 13, December 2019.
Remarkable changes in seafloor topography and biological communities, quantification of methane flux, and connections from the seafloor to upper water column methanotrophy.
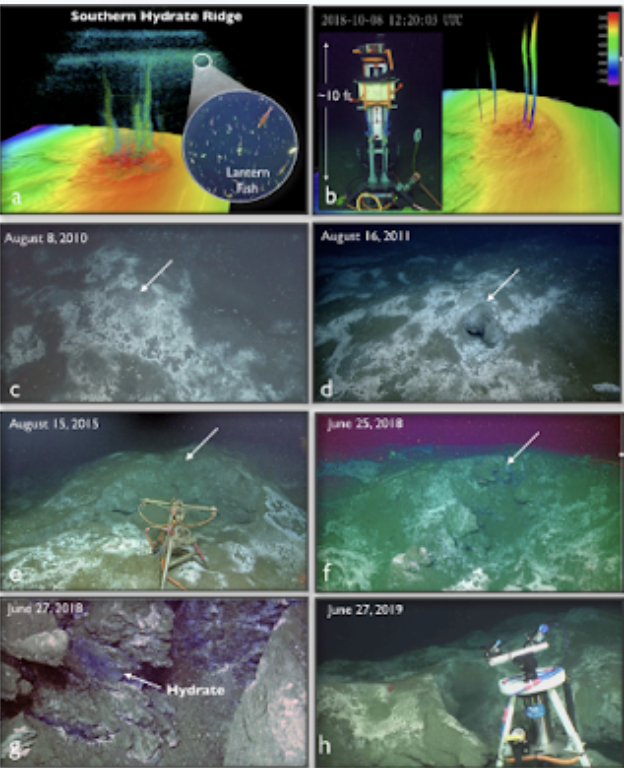
Southern Hydrate Ridge (SHR) is one of the most active and dynamic methane seep sites known. Repeat investigations during Regional Cabled Array (RCA) cruises show that it is highly dynamic, delineated by exceptional changes in seafloor morphology, venting intensity and temporal variability, and by the distribution and density of associated biological communities (Fig. 1) [1-6]: here, AI is being utilized to quantify the areal extent of seeps and classification of organisms [4,7]. Since first imaged in 2010, the summit of SHR has changed remarkably with areas of smooth, gentle hummocks transformed into extensive, highly rugged and steep-sided collapsed pits from which jets and explosions of bubbles occur (Figs. 1c-h). Equally dynamic are changes in the locations and thicknesses of microbial mats that mark more diffuse seepage of methane from the seafloor. Surprisingly, chemical results from continuous measurements from RCA flow meters show an annual net transport of fluid downward into the sediment resulting in the development of new transport models for these seep environments [8]. At the focused RCA experimental site “Einsteins’ Grotto” and at a site to the north, hydrate is exposed at the seafloor within the collapsed pits (Fig. 1d).
Because of OOI, SHR is one of only three places (the others being Ocean Networks Canada Barkley Canyon and Clayoquot Slope sites) in the oceans where time series investigations of methane release are conducted at hour to year time periods utilizing ship and RCA PI cabled multibeam sonars, cameras and an upward-looking ADCP [2, 5-6, 9-11]. Results from a 3-year investigation of SHR show that the locations of seep activity and bubble release remained unchanged, however, the magnitude of gas release was highly variable on hourly time scales (Fig. 1a) [2]. Bubble plumes rise up to ~480 above the seafloor and in several cases exceed the upper limit of hydrate stability by ∼190 m. Here, shallow subsurface waters, where methane disassociates, is marked by high density regions of lantern fish, consistent with increased biological activity associated with the microbial oxidation of the released methane (Fig. 1a) [2].
As a key cabled site on the RCA, SHR has attracted numerous national and international investigators including a several year program funded by the German Federal Ministry of Education and Research to quantify methane flux from the highly active Southern Hydrate Ridge RCA site (G. Bohrmann and Y. Marcon, MARUM, University of Bremen, Germany; “Sonar monitoring of natural release of methane greenhouse gas from the seafloor – A contribution to the understanding of global change.”). In 2018, it was mapped at submeter resolution and the entire site photo mosaicked as part of a Schmidt-funded program (B. Thornton, University of South Hampton). Cabled infrastructure now installed as part of the MARUM project includes an overview multibeam sonar that completes a 360° scan every 2 hrs and spans a distance of 700 m, imaging all sites of bubble plume emissions at SHR (Fig. 1b) [5-6; 10-11]. Other infrastructure includes a multibeam, very high-resolution sonar that quantifies bubble emissions from Einstein’s Grotto, a 4k video and digital still camera that takes 3 images each hour of the explosive hydrate-bearing site – Einsteins’ Grotto (Fig. 1h), and a CTD to examine the impacts of ocean warming and release of methane into the hydrosphere. Automated plume imaging is now utilized for time-series hourly imaging by the RCA digital still camera [5-6]. The images, available through the OOI Data Portal, document remarkable changes of the collapse pit over time and in associated biology.
[blockquote][1] Kelley, D.S. (2016) Real-time multidisciplinary monitoring of a highly dynamic methane seep: The OOI Cabled Array at Southern Hydrate Ridge. Gordon Conference Natural Hydrate Systems. Interfacial science advances towards understanding and monitoring gas hydrate systems. Galveston, February 28 – March 4, 2016.
[2] Philip. B.T., Denny, A.R., Solomon, E.A., and Kelley, D.S. (2016) Time-series measurements of bubble plume variability and water column distribution above Southern Hydrate Ridge. Geochemistry, Geophysics, Geosystems, 17 (3) 10.1002/2016GC006250.
[3] Bigham, K., Kelley, D.S., Solomon, E.A., and Delaney, J.R. (2017) Extreme Morphologic and Venting Changes in Methane Seeps at Southern Hydrate Ridge, Cascadia Margin. American Geophysical Union, Fall Meeting 2017, OS53B-1199.
[4] Bigham, K., Kelley, D.S., Marburg, A., and Delaney, J.R. (2017) Further Interpretation of the Relationship between Faunal Community and Seafloor Geology at Southern Hydrate Ridge, Cascadia Margin: Exploring Machine Learning, American Geophysical Union, Fall Meeting 2017, U21B-09.
[5] Bohrmann, G., and Marcon, Y., (2019) Long-term monitoring of gas emissions at Southern Hydrate Ridge. American Geophysical Union, Fall Meeting 2019. OS51A-04.
[6] Marcon, Y., and Bohrmann, G. (2019) Long-term monitoring of gas emissions at Southern Hydrate Ridge. American Geophysical Fall Meeting 2019, OS51A-04.
[7] Marburg, A., and Bigham, K., (2016) Deep learning for benthic fauna identification, Oceans 16 MTS/IEEE Monterey, 10.1109/OCEANS.2016.7761146.
[8] Whorley, T.L., Solomon, E.A., Kowalski, L., and Centurion, R., (2019) Persistent downward flow of seawater beneath Beggiatoa mat communities at Hydrate Ridge – mechanisms and biogeochemical implications. American Geophysical Union, Fall Meeting 2019, OS43B-1706.
[9] Philip. B.T., Kelley, D.S., Solomon, E.A., and Delaney, J.R. (2016) Monitoring methane emissions at Southern Hydrate Ridge using an OOI Cabled Array Acoustic Doppler Current Profiler. OCEANS 2016 MTS/IEEE Monterey, 10.1109/OCEANS.2016.7761469
[10] Marcon, Y., Sahling, H., von Wahl, T., Spiesecke, U, Vittori, V., Leymann, T., and Bohrmann, G., (2018) M³: Towards Long-Term Acoustic Monitoring of Gas Emissions using Underwater Cabled Observatory Technology. Ocean Sciences Meeting, doi.org/10.1002/essoar.b8ca5006b4256b34.3745ac673d8f4f8a.1.
[11] Marcon, Y., Kopiske, E., Leymann, T., Spiesecke, U., Vittori, V., von Wahl, T., Wintersteller, P., Waldmann, C., and Bohrmann, G., (2019) A rotary sonar for long-term acoustic monitoring of deep-sea gas emissions. OCEANS19 – Marseille, IEEE. 10.1109/OCEANSE.2019.8867218.
[/blockquote] Read More