
Southern Ocean Sea Ice Predictability
Adapted and condensed by OOI from Cerovecki, et al., 2022, doi: /10.1088/1748-9326/ac7d66.
Forecasting Antarctic sea ice conditions, including specifics such as the position of the ice edge in the Southern Ocean, are substantial challenges. As a part of the Polar Prediction Project, there is a focus on improving coupled air-sea-ice prediction models and determining key sources of forecast errors. In a recent study, Cerovecki et al. (2022) show that sea ice forecast skill is linked to the accuracy of the surface forcing, and in particular, the net surface radiation. The goal of the study was to quantify errors that degrade the skill of Southern Ocean sea ice forecasts during the freezing season. They conclude that accurately modeling the surface downward longwave radiation (DLW) component of the net surface radiation is critical to sea ice prediction over the Southern Ocean.
The authors review prior results indicating that climate models have different behaviors in different seasons relative to ground truth. In spring and summer, the models over-estimate the net surface radiation whereas in winter the models under-estimate the net longwave radiation. Recognizing that these issues relate to representations of cloud cover, which can be diagnosed using DLW, the authors also note that some models showed DLW biases of up to 100 W/m2 compared to ground truth. These results were based on comparisons at McMurdo Station, Antarctica, whereas the authors were interested in processes occurring near the ice edge where few direct observations are available.
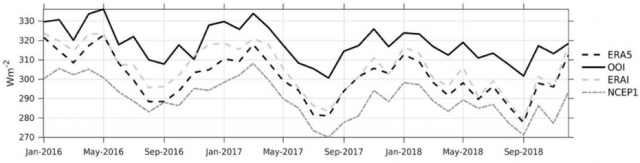
[media-caption path="/wp-content/uploads/2022/11/CGSN-highlight.png" link="#"]Figure 1. Monthly mean downward longwave radiation (DLW) for Jan 2016 – Nov 2018 from the OOI Southern Ocean buoy (solid), and three reanalysis products: ERA5 (black dash), ERA-Interim (long grey dash) and NCEP1 (short gray dash). From Ceroveki et al., 2022.[/media-caption]
The OOI Southern Ocean surface mooring provided a rare source of in-situ air-sea flux data for comparison. The study used DLW from the METBK instrument package on the OOI Southern Ocean buoy to compare with results from the ECMWF Interim reanalysis (ERAI), the ERA fifth- generation reanalysis (ERA5), and the NOAA National Centers for Environmental Prediction reanalysis (NCEP1). Despite some data gaps, the 1 min OOI METBK observations for Jan 2016 – Jan 2020, were critical to determining model biases. Hourly mean DLW data from the two METBK packages were averaged together to create the observational record.
Comparison of the observed monthly mean DLW with reanalysis output showed systematic underestimates by the models relative to the observations. The nature of the offsets is shown in Figure 1 – the reanalysis models do a relatively good job of capturing month to month variability, but with a consistent low bias. The mean offsets range from -13 W/m2 for ERAI to -28 W/m2 for NCEP1. These biases are comparable to those diagnosed at McMurdo Station, and suggest that the ERA5 DLW radiation underestimate is of the order of 20–50 W/m2. This is consistent with the finding that coupled model forecast systems over-estimate sea ice growth.
The authors conclude that a significant deficit in reanalysis DLW, related to the accuracy of cloud representation in the models, is a common problem over the Southern Ocean and impacts the skill of sea ice cover prediction. In particular, the ERA5 reanalysis may underestimate DLW by up to 50 W/m^2 during the during the freezing season. The OOI Southern Ocean data, from the furthest south sustained air-sea flux mooring, proved uniquely valuable in codifying these results.
______________________________
Cerovecki, I, R. Sun, D.H. Bromwich, X. Zou, M.R. Mazloff and S -H.Wang (2022). Impact of downward longwave radiative deficits on Antarctic sea-ice extent predictability during the sea ice growth period. Environ. Res. Lett. 17 084008. DOI: /10.1088/1748-9326/ac7d66.
Read More
Particle Trajectories in an Eastern Boundary Current
Adapted and condensed by OOI from Wong-Ala et al., 2022, doi:/10.1016/j.jmarsys.2022.103757
To study the transport and dispersal of marine organisms during spawning, Wong-Ala* et al. developed and applied a Lagrangian particle tracking (LPT) model to compare and contrast particle drift patterns during the spring transition off the Oregon coast. They studied the Oregon coast as it has distinct upwelling and downwelling regimes and variable shelf width. They contrasted years (2016–18) using Regional Ocean Modeling System (ROMS) with different horizontal spatial resolutions (2 km, 250 m). They found the finer spatial resolution model significantly increased retention along the Oregon coast. Particles in the 250 m ROMS were advected to depth at specific times and locations for each simulated year, coinciding with the location and timing of a strong and shallow alongshore undercurrent that is not present in the 2 km ROMS. Additionally, ageostrophic dynamics close to shore, in the bottom boundary layer, and around headlands not present in the coarser model emerged in the 250 m resolution model. They concluded that the higher horizontal model resolution and bathymetry generated well-resolved mesoscale and submesoscale features (e.g., surface, subsurface, and nearshore jet) that vary annually. These results have implications for modeling the dispersal, growth, and development of coastal organisms with dispersing early life stages.
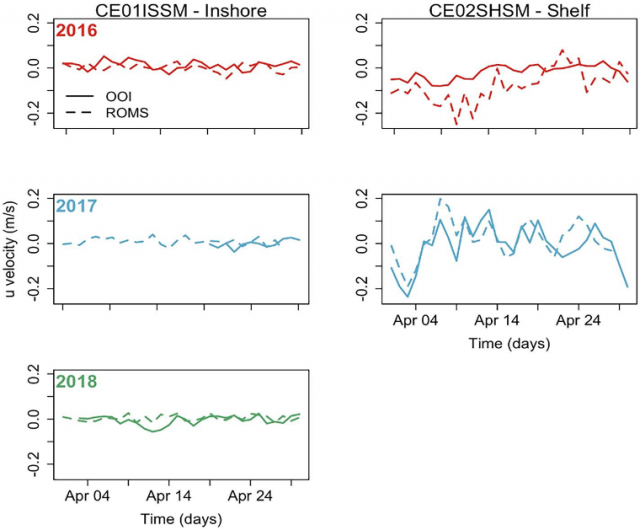
[media-caption path="/wp-content/uploads/2022/11/Endurance-Highlight.png" link="#"]Figure 1: (Fig 9 from Wong-Ala et al. (2022). Comparison of u-velocity (zonal velocity) data between the 250 m ROMS and an inshore mooring and shelf mooring off the Oregon coast collecting data at seven meters depth. The panel is organized by year: 2016 (row 1), 2017 (row 2), 2018 (row 3), and location of data collection: inshore (column 1) and shelf (column 2). In April 2018, there are no data available from the shelf mooring ADCP.[/media-caption]The model applied by Wong-Ala assimilates satellite sea surface temperature and along-track altimetry. Model atmospheric forcing is from the NOAA North American Mesoscale Model (NAM). To validate their model, Wong-Ala et al., used OOI Endurance Array time series data from 2016 to 2018 from the Oregon inshore and shelf moorings (CE01ISSM and CE02SHSM). They compared available OOI zonal and meridional velocities, temperature, and salinity to model output of these parameters for the month of April in each year when they ran their model (Figure 1). They found the modeled currents and temperature from the 250 m ROMS model closely follow the observed data from inshore and shelf moorings compared to the 2 km ROMS. The 250 m ROMS modeled currents and observed currents at the inshore mooring are similar for all three years (Figure 1).
They also found that the 250 m ROMS modeled temperature and observed data are similar in 2017 at the inshore and shelf location. In April 2017 and 2018, the modeled temperature from the 250 m ROMS is about 1 °C cooler than the observed temperatures.
_____________________
*Wong-Ala is a PhD student at Oregon State University. She is a Pacific Islander.
Reference:A. T. K. Wong-Ala, Ciannelli, L., Durski, S. M., and Spitz, Y., Particle trajectories in an eastern boundary current using a regional ocean model at two horizontal resolutions, Journal of Marine Systems, vol. 233, p. 103757, 2022. https://doi.org/10.1016/j.jmarsys.2022.103757.
Read MoreVisions’22: Changing Students Lives

From Deb Kelley, UW, in OOI Quarterly Report, 2022.
This year, 25 undergraduate students and three graduate students participated on the Regional Cabled Array Operations and Maintenance cruise as part of the VISIONS’22 at-sea experiential learning program. They include students from the US, India, Saudi Arabia, France, and Kazakhstan. They represent a breadth of disciplines spanning Oceanography (11), Engineering (9: Mechanical, Industrial, Bioengineering, Environmental, and Aeronautics and Astronautics), Biology (6: Biology, Marine Biology, and Microbiology), Geology (1), and Policy Studies focused on the United Nations Convention (1). They stood 4 hour-on, 8 hour-off watches in the remotely controlled vehicle, ROPOS control center, learned how to conduct CTD casts and collect and process fluid samples, and worked on deck. Three additional undergraduate student ambassadors, who have participated in past VISIONS’ expeditions (1-3 years), helped mentor the students. All completed cruise blogs on the Interactiveoceans VISIONS’22 Expedition site, and science-engineering and/or engagement projects that will last a quarter to several years. Two students chose projects involving advanced genetic analyses of vent animals and protists for their Senior Thesis in Oceanography. Based on discussions with past students and what they relayed in their blogs, for many this is a life changing experience. Note: two past VISIONS students are now APL engineers as part of the RCA team.
Read More
Chlorophyll Enhancement at the Shelfbreak
Adapted and condensed by OOI from Oliver et al., 2022, doi:/10.1029/2021JC017715.
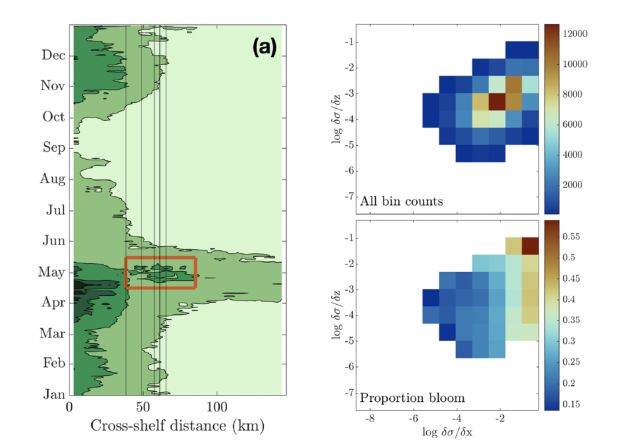
[media-caption path="/wp-content/uploads/2022/08/Screen-Shot-2022-08-18-at-3.10.51-PM.png" link="#"](left) Eighteen-year composite annual cycle of surface chlorophyll concentration from MODIS satellite. Vertical lines indicate the shelfbfreak region (depths 75 to 1,000 m); red box highlights chlorophyll enhancement at the shelfbreak. (right; upper) OOI glider data with more than 100 chlorophyll observations within horizontal and vertical density gradient bins and (lower) proportion of bins with chlorophyll > 2 mg/L, indicating a bloom. From Oliver et al., 2022.[/media-caption]The enhancement of chlorophyll due to phytoplankton blooms is recognized to occur near the frontal boundary of the New England Shelf, but the blooms are ephemeral and not consistently found in satellite remote sensing of ocean color. In a recent study, Oliver et al., (2021) show that enhanced surface chlorophyll concentrations at the shelfbreak are short lived events, and are associated with periods when a surface layer of lighter shelf water moves over denser slope water at the shelfbreak front. Both data and a computational model show that eastward, upwelling-favorable winds are the primary driver of the frontal restratification and localized enhanced surface chlorophyll.
The study used a variety of data sources, including MODIS satellite chlorophyll estimates, shipboard CTD casts from a Shelf-break Productivity Interdisciplinary Research Operation at the Pioneer Array (SPIROPA) cruise and a Pioneer mooring turn cruise, Pioneer glider density and chlorophyll, and atmospheric reanalysis winds after comparison with Pioneer surface mooring winds. A two-dimensional configuration of the Regional Ocean Model System (ROMS) coupled to a nitrogen-phytoplankton-zooplankton-detritus (NPZD) model was used to simulate the wind-driven response.
The eighteen-year time-evolution of the cross-shelf distribution of surface chlorophyll concentration from MODIS showed that shelf-break chlorophyll enhancements were evident in most years, followed an inshore spring bloom in April, and were typically seen during a short period in the spring (mid-April – mid-May; Figure above). For individual years, the shelf-break chlorophyll enhancements were short-lived, typically lasting less than a week. Pioneer Array glider data were used to explore the relationship between enhanced chlorophyll concentrations and both horizontal (assumed to be associated with the shelfbreak front) and vertical density gradients. Near surface (upper 30 m) chlorophyll concentrations were collected in log-transformed density gradient bins and then displayed according to the proportion of bins with chlorophyll > 2 mg/L, indicating a bloom. The “bloom bins” were associated with high horizontal density gradients and a range of vertical density gradients, indicating that frontal restratification is associated with enhanced chlorophyll at the shelfbreak (Figure above).
The study concludes that enhanced surface chlorophyll events at the New England shelfbreak occur consistently in the spring, but are transient, lasting only a few days to a week, and thus not discernible in seasonal climatologies. Periods of enhanced chlorophyll are associated with strong horizontal density gradients and appear to be triggered by the increase in stratification resulting from wind-driven cross-shelf advection of less dense shelf water over denser slope water. This process creates a shallow mixed layer at the front which alleviates light limitation and supports transient surface enhancements of chlorophyll.
Oliver, H., Zhang, W.G., Archibald, K.M., Hirzel, A.J., Smith, W.O. Jr, Sosik, H.M., Stanley, R.H.F and D.J. McGillicuddy Jr (2022). Ephemeral surface chlorophyll enhancement at the New England shelf break driven by Ekman restratification. Journal of Geophysical Research: Oceans, 127, e2021JC017715. https://doi.org/10.1029/2021JC017715.
Read MoreAtlantic Water Influence on Glacier Retreat
Adapted and condensed by OOI from Snow et al., 2021, doi:/10.1029/2020JC016509
The warming of Atlantic Water along Greenland’s southeast coast has been considered a potential driver of glacier retreat in recent decades. In particular, changes in Atlantic Water circulation may be related to periods of more rapid glacier retreat. Further investigation requires an understanding of the regional circulation. The nearshore East Greenland Coastal Current and the Irminger Current over the continental slope are relatively well studied, but their interactions with circulation further offshore are not clear, in part due to relatively sparse observations prior to establishing the OOI Irminger Sea Array and the Overturning in the Subpolar North Atlantic Program (OSNAP).
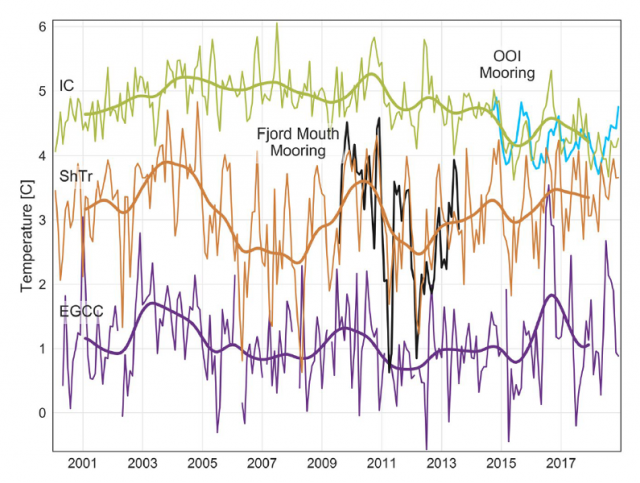
[media-caption path="/wp-content/uploads/2022/04/Pioneer-highlight.png" link="#"]Satellite-derived sea surface temperature after adjustment for the Irminger Current (IC; green), Shelf Trough (ShTr; orange), and East Greenland Coastal Current (EGCC; purple). Monthly values (thin lines) are shown for 2000-2018 with 24-month low-passed records overlain. In situ observations from the fjord mouth (290 m: Black) and OOI flanking mooring FLMA (180 m; blue) are shown for comparison.[/media-caption]
In a recent study (Snow et al., 2021) use in-situ mooring data to validate satellite SST records and then use the 19-year satellite record to investigate relationships between glacier melt and Atlantic Water variability. In order to use the satellite records for this purpose, several adjustments must be made, including accounting for cloud and sea ice contamination, eliminating seasonally-varying diurnal biases, and removing the influence of air temperature. This adjusted satellite SST can be compared to in-situ mooring data during a portion of the record. A coastal mooring near the Sermilik Fjord mouth and the OOI Irminger Sea Array provide useful records during 2009-2013 and 2014-2018, respectively (Figure 24). An interesting aspect is that the temperature record from OOI Flanking Mooring A (FLMA) is useful for this purpose even though the measurements are at 180 m depth. This is because the upper ocean is relatively homogeneous in this region, and the mixed layer is deeper than 180 m during much of the year. The authors find that the adjusted satellite SST is consistent with the in-situ records on monthly to interannual time scales (Figure above). This provided the motivation to investigate relationships between the 19 year satellite record and glacier discharge rates.
The study concludes that warmer upper ocean temperatures as far offshore as the OOI Irminger Sea Array were concurrent with increased glacier retreat in the early 2000s, in support of the idea that Atlantic Water circulation plays a role. However, they also note that this influence is not direct, because of substantial variation in how Atlantic Water is diluted as it flows across the shelf towards Sermilik Fjord. The idea that time-varying dilution of Atlantic Water governs the temperature of water reaching the glacier was not previously understood, and resolving such small-scale, time-varying processes is a challenge for models. The authors conclude that with appropriate adjustments, “[satellite] SSTs show promise in application to a wide range of polar oceanography and glaciology questions” and that the method can be generalized to other glacier outflow systems in southeast Greenland to complement relatively sparse in-situ records.
Snow, T., Straneo, F., Holte, J., Grigsby, S., Abdalati, W., & Scambos, T. (2021). More than skin deep: Sea surface temperature as a means of inferring Atlantic Water variability on the southeast Greenland continental shelf near Helheim Glacier. J. Geophys. Res: Oceans, 126, e2020JC016509. https://doi.org/10.1029/2020JC016509.
Read MoreInitiation of a Marine Heat Wave
Adapted and condensed by OOI from Chen et al., 2022, doi:epdf/10.1029/2021JC017927.
Marine heat waves are sustained, anomalous ocean warming events with significant regional extent. In some cases, these heat waves are driven by heating from the atmosphere. In new work (Chen et al. 2022), it is shown that ocean processes can also be responsible for marine heat waves. In this case, the presence of anomalously high temperatures on the New England shelf was detected by CTD observations made by commercial fishing vessels. The fishing vessel CTD data indicated that the heat wave was a “compound event”, i.e. one with large anomalies in both temperature and salinity. Because atmospheric heating would drive only a temperature anomaly, and because the Gulf Stream derived slope water offshore of the New England shelf is high in both temperature and salinity, it was surmised that this heat wave was driven by ocean advection.
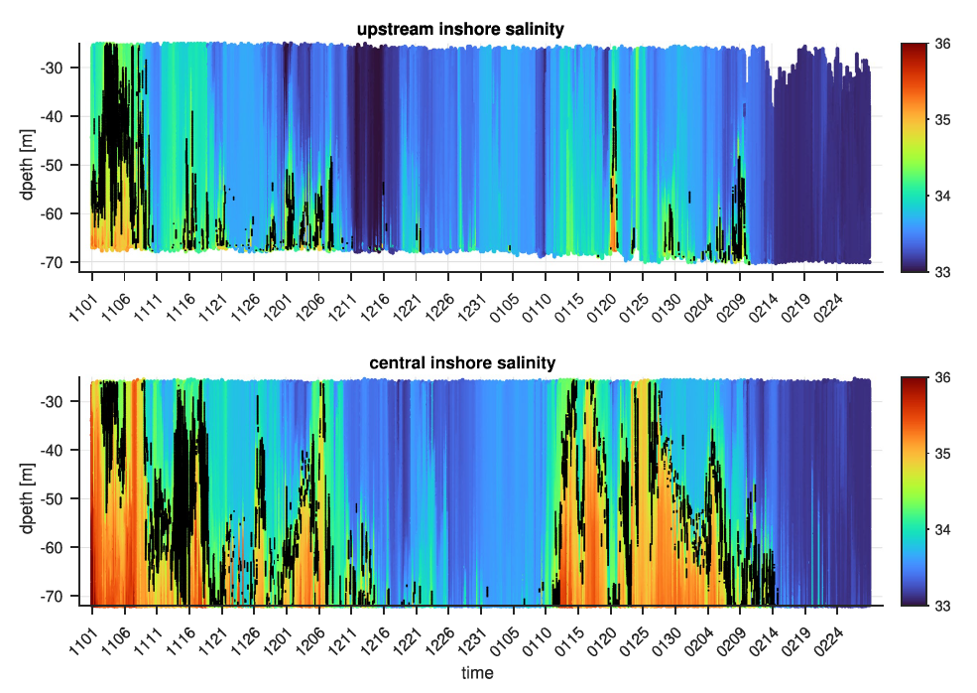
[media-caption path="/wp-content/uploads/2022/02/CGSN1.png" link="#"]Figure 23. Salinity contoured vs. depth and time for the Pioneer Upstream Inshore (PMUI) and Central Inshore (PMCI) profiler moorings from November 2016 to February 2017. The 34.5 isohaline is marked in black to highlight the boundary between the shelf and slope waters.[/media-caption]
The authors used data from Pioneer Array profiler moorings (PMUI and PMCI) to support this ocean advection hypothesis. Salinity records (Figure 23) show high salinity events in Nov/Dec 2016 and Jan 2017. The salinity anomalies are indicative of slope water (S > 34.5), are most intense at the bottom, and are more pronounced further offshore. This is consistent with a bottom intensified intrusion of warm, salty slope water onto the shelf to initiate the heat wave observed by the fishing fleet CTDs in January of 2017.
Further investigation was done to understand the cross-shelf exchange process, which presumably originated at the shelfbreak and penetrated large distances onshore as a bottom intrusion. The principal tool for the additional analysis was a new high-resolution regional model. The model was able to reproduce major features including shelf water properties, the shelf break front, and warm-core rings in the slope sea . Critically, the model showed the presence of cyclonic eddies (opposite in rotation, thinner and smaller than the warm core rings) that were responsible for driving cross-shelf flow and intensifying the front. The authors argue that these processes precondition the outer shelf by bringing warm salty water to the shelf break, i.e. roughly the 100 m isobath.
Another step is necessary to produce the dramatic, bottom intensified intrusion of warm salty water to ~50 m depth, as seen in January 2017. Further examination of the model, including runs with and without wind forcing, indicated that persistent upwelling-favorable winds along with topographic effects were the additional ingredients necessary to cause the dramatic intrusion. Although some onshore penetration results from the standard “two-dimensional” wind-driven upwelling, the authors found that details of the three-dimensional regional topography were critical to extensive slope water penetration in the form of a warm, salty, bottom-intensified tongue.
Identifying the unusually strong intrusion and finding the hints to a slope-sea origin shows the importance of sustained observing, in this case from both the Pioneer Array and the fishing fleet.
Unraveling this remarkable, multi-step process, with pre-conditioning by small-scale cyclonic eddies followed by a topographically-controlled, wind driven response, is a testament to the power of high-resolution models to fill in dynamical gaps in the observing systems. The authors note that “this study provides dynamical explanations of the observed water mass anomalies across the shelf, offers new insights about cross-shelf exchange… and lays the ground work for future studies.”
__________________________________________________________________
Chen, K., Gawarkiewicz, G., & Yang, J. (2022). Mesoscale and submesoscale shelf-ocean exchanges initialize an advective Marine Heatwave. Journal of Geophysical Research: Oceans, 127, doi:epdf/10.1029/2021JC017927.
Read MoreA Case Study for Open Data Collaboration
Recognizing that freely accessible ocean observatory data has the potential to democratize interdisciplinary science for early career researchers, Levine et al. (2020) set out to demonstrate this capability using the Ocean Observatories Initiative. Publicly available data from the OOI Pioneer Array moorings were used, and members of the OOI Early Career Scientist Community of Practice (OOI-ECS) collaborated in the study.
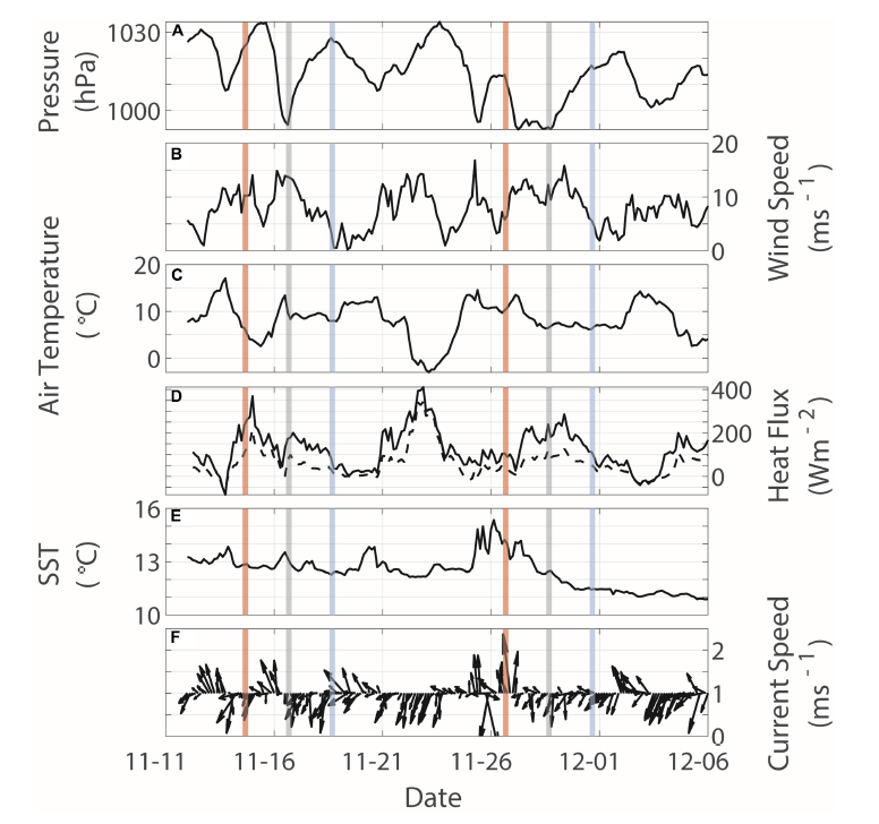
A case study was constructed to evaluate the impact of strong surface forcing events on surface and subsurface oceanographic conditions over the New England Shelf. Data from meteorological sensors on the Pioneer surface moorings, along with data from interdisciplinary sensors on the Pioneer profiler moorings, were used. Strong surface forcing was defined by anomalously low sea level pressure – less than three times the standard deviation of data from May 2015 – August 2018. Twenty-eight events were identified in the full record. Eight events in 2018 were selected for further analysis, and two of those were reported in the study (Figure 24).
[media-caption path="https://oceanobservatories.org/wp-content/uploads/2021/07/CGSN-Highlight.png" link="#"]Figure 24. Two surface forcing events (16 and 27 November) identified from the time series of surface forcing at the Pioneer Central surface mooring. Vertical lines indicate the peak of the anomalous low-pressure events (gray), as well as times 48 h before (red) and after (blue). (A) sea level pressure, (B) wind speed, (C) air temperature, (D) latent (solid) and sensible (dashed) heat fluxes, (E) sea surface temperature, and (F) surface current speed and direction. [/media-caption]The impact of surface forcing on subsurface conditions was evaluated using profile data near local noon on the day of the event, as well as 48 hr before and after (Figure 24). Subsurface data revealed a shallow (40-60 m) salinity intrusion prior to the 16 November event, which dissipated during the event, presumably by vertical mixing and concurrent with increases in dissolved oxygen and decreases in colored dissolved organic matter (CDOM). At the onset of the 27 November event, nearly constant temperature, salinity, dissolved oxygen and CDOM to depths of 60 m were seen, suggesting strong vertical mixing. Data from multiple moorings allowed the investigators to determine that the response to the first event was spatially variable, with indications of slope water of Gulf Stream origin impinging on the shelf. The response to the second event was more spatially-uniform, and was influenced by the advection of colder, fresher and more oxygenated water from the north.
The authors note that the case study shows the potential to address various interdisciplinary oceanographic processes, including across- and along- shelf dynamics, biochemical interactions, and air-sea interactions resulting from strong storms. They also note that long-term coastal datasets with multidisciplinary observations are relatively few, so that the Pioneer Array data allows hypothesis-driven research into topics such as the climatology of the shelfbreak region, seasonal variability of Gulf Stream meanders and warm-core rings, the influence of extreme events on shelf biogeochemical response, and the influence of a warming climate on shelf exchange.
In the context of the OOI-ECS, the authors note that the study was successfully completed using open-source data across institutional and geographic boundaries, within a resource-limited environment. Interpretation of results required multiple subject matter experts in different disciplines, and the OOI-ECS was seen as well-suited to “team science” using an integrative, collaborative and interdisciplinary approach.
______________________________________________________________________________________________
Levine, RM, KE Fogaren, JE Rudzin, CJ Russoniello, DC Soule, and JM Whitaker (2020) Open Data, Collaborative Working Platforms, and Interdisciplinary Collaboration: Building an Early Career Scientist Community of Practice to Leverage Ocean Observatories Initiative Data to Address Critical Questions in Marine Science. Front. Mar. Sci. 7:593512. doi: 10.3389/fmars.2020.593512.
Read MoreAssimilative Model Assessment of Pioneer Array Data
Adapted and condensed by OOI from Levin et al., 2020, doi:/10.1016/j.ocemod.2020.101721.
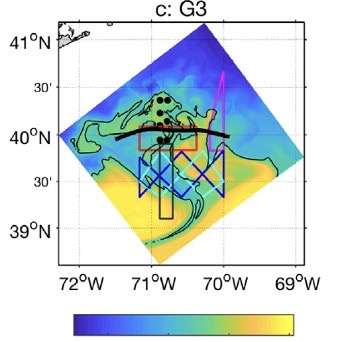
[caption id="attachment_21009" align="alignnone" width="974"]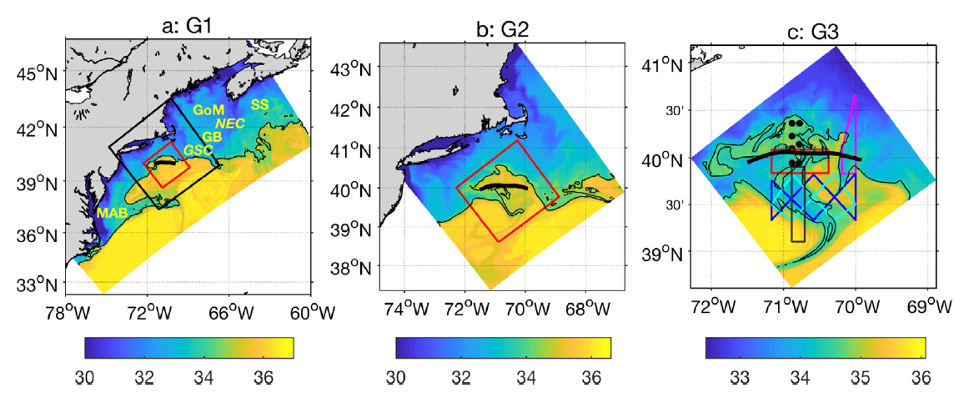 Fig. 1. Color contours of sea surface salinity from the model for three nested grids denoted a) G1, b) G2 (black square in (a)) and c) G3 (red square in (a), (b)). An indicator of frontal position (the 34.5 isohaline) is shown as a black contour. Cross-shelf exchange parameters are computed for an along-shelf section (thick black line). The Pioneer Array assets are shown in the G3 figure.[/caption]
Among the detailed analyses undertaken in this two-part study was quantification of the impact of observations on the reduction of RMS error for estimates of the volume transport across an along-front transect (Fig. 1). Temperature and salinity data from moorings and gliders were impactful for the larger grids (G1, G2). As the grid resolution was increased (G3), submesoscale motions were resolved and velocity data from the moorings became more important for reduction of error variance. An analysis of the sensitivity of shelf-slope exchange indices (e.g. volume transport) to removal of an observation, compared to the direct impact of the observation, showed that the majority of observed variables (e.g., SST, SSH, T, S, U, V) were “synergistic” – providing value to the assimilation through their connection with other variables as represented in the model dynamics. For the highest resolution estimates (G3 grid), the Pioneer Array observing assets were more impactful than other observations (e.g., remote sensing, NDBC and IOOS buoys) in reducing uncertainty, with velocity data being the major contributor. This is not a complete surprise, since the Pioneer Array was “tuned” to these scales. Still, it is gratifying to see that the impact on model fidelity is quantifiable.
The two-part study undertaken by Levin et al. provides a wealth of additional information about the performance of assimilative models as well as the utility of in-situ observations for modeling and prediction. As the authors state, they have “just begun to scratch the surface” of approaches that can be applied to the assessment of model performance as well as the management of observing systems.
Levin J., H.G. Arango, B. Laughlin, E. Hunter, J. Wilkin, and A.M. Moore, 2020. Observation impacts on the Mid-Atlantic Bight front and cross-shelf transport in 4D-Var ocean state estimates: Part I – Multiplatform analysis,Ocean Modeling, 156, 101721, 1-17, doi 10.1016/j.ocemod.2020.101721.
Read More
PI Cabled Instrument Provides Real-Time Sonar Measurements of Hydrothermal Plume Emissions
Adapted and condensed by OOI from Xu et al., 2022, doi:/10.1029/2020EA001269.
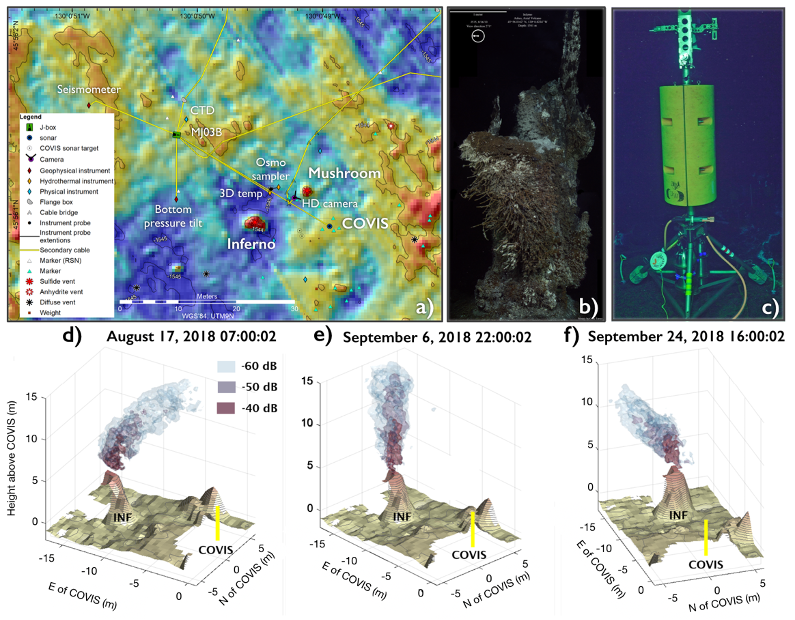
[media-caption path="https://oceanobservatories.org/wp-content/uploads/2021/02/RCA-FOR-SCIENCE-HIGHLIGHTS.png" link="#"]Figure 26. a) Location of the COVIS sonar and RCA infrastructure in the ASHES Hydrothermal Field. Also shown are locations of the active ~ 4 m tall hydrothermal edifices ‘Mushroom’ and ‘Inferno’. c) The COVIS sonar in 2019 (Credit: Rutgers/UW/NSF-OOI/WHOI). The tower is 4.2 m tall and hosts a modified Reson 7125 SeaBat multibeam sonar mounted on a tri-axial rotator. The system was built by the UW Applied Physics Laboratory. d) Selected time-series images from COVIS showing bending of the plume eastward, e) a nearly vertical plume, and f) southward bending of the plume (after Fig. 7 Xu et al., 2020).[/media-caption]The Cabled Observatory Vent Imaging Sonar (COVIS) was installed on the OOI RCA in the ASHES hydrothermal field (Fig. 26 a-c) at the summit of Axial Seamount in 2018, resulting in the first long-term, quantitative monitoring of plume emissions (Xu et al., 2020). The sonar provides 3-dimensional backscatter images of buoyant plumes above the actively venting ‘Inferno’ and ‘Mushroom’ edifices, and two-dimensional maps of diffuse flow at temporal frequencies of 15 and 2 minutes, respectively. Sonar data coupled with in-situ thermal measurements document significant changes in plume variations (Fig. 26 d-f) and modeling results indicate a heat flux of 10 MW for the Inferno plume (Xu et al., 2020). COVIS will provide key data to the community investigating the impacts of eruptions on hydrothermal flow at this highly active volcano.
[1] Xu, G., Bemis, K., Jackson, D., and Ivakin, A., (2020) Acoustic and in-situ observations of deep seafloor hydrothermal discharge: OOI Cabled Array ASHES vent field case study. Earth and Space Science. Note: This project was funded by the National Science Foundation through an award to PI Dr. K. Bemis, Rutgers University – “Collaborative Research: Heat flow mapping and quantification at ASHES hydrothermal vent field using an observatory imaging sonar (#1736702). COVIS data are available through oceanobservatories.org.
Read MoreLow Dissolved Oxygen off Washington and Oregon Coast Impacted by Upwelling in 2017
In the summer of 2020, the Rutgers University Ocean Data Labs project worked with the Rutgers Research Internships in Ocean Science to support ten undergraduate students in a virtual Research Experiences for Undergraduates program. Rutgers led two weeks of research methods training and Python coding instruction. This was followed by six weeks of independent study with one of 13 research mentors.
Dr. Tom Connolly (Moss Landing Marine Labs, San Jose State University) advised Andrea Selkow from Austin College, Texas on her study of dissolved oxygen (DO) off the Washington and Oregon coasts using the OOI Endurance Array.
Selkow evaluated DO data from Endurance Array Surface Moorings during 2017 and 2018. She presented this work as a poster at the conclusion of her summer REU. Selkow focused on the question: Are there similarities in the dissolved oxygen concentrations off the coast of Oregon and Washington during a known low oxygen event? She also considered why there might exist differences based on the spatial variability of wind stress forcing, i.e., do the strong Oregon winds cause dissolved oxygen concentrations to be lower at the Oregon mooring compared to the Washington moorings. Finally, she reviewed the data and tried to answer whether the oxygen data were accurate or affected by biofouling.
She used datasets from the OR and WA Inshore Shelf Mooring time-series and WA Shelf Mooring time-series from Endurance Array. Her focus was on the seafloor data because that is where the lowest oxygen concentrations were expected to be observed.
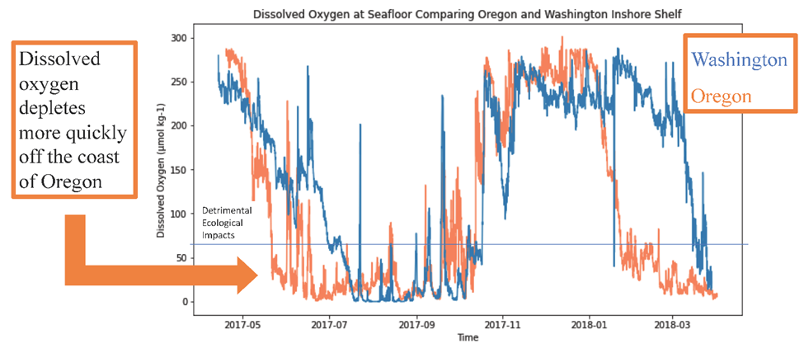
Selkow focused her attention on low DO observed in the summer of 2017. While Barth et al. (2018) presented a report on these data for one event in July 2017, she expanded the analysis to include the Washington shelf and inshore moorings. She plotted time series data and used cruise data to validate these time series. While overall seasonal trends in DO were similar, she found dissolved oxygen is routinely more quickly depleted off the coast of Oregon than Washington during a low oxygen event (Figure 25). She also looked at the cross-shelf variability in DO time series and found dissolved oxygen is more quickly depleted at the shelf mooring than at the inshore shelf mooring. Upwelling is known to drive the low oxygen events and she inferred that the weaker southward winds over the Washington shelf may be why DO decreases at a slower rate off Washington than Oregon.
References
Barth, J.A., J.P. Fram, E.P. Dever, C.M. Risien, C.E. Wingard, R.W. Collier, and T.D. Kearney. 2018. Warm blobs, low-oxygen events, and an eclipse: The Ocean Observatories Initiative Endurance Array captures them all. Oceanography 31(1):90–97,
Selkow, A. and T. Connelly. Low Dissolved Oxygen off Washington and Oregon Coast Impacted by Upwelling in 2017, Accessed 13 Jan 2021.
Read More