
Hypoxic Conditions Over the Oregon Shelf Respond to Wind Forcing on Time Scales of Days

From Barth et al., 9 February 2018
In recent years, hypoxic and even anoxic events have regularly occurred off Washington and Oregon as they have in upwelling regions worldwide [1, 2]. The OOI Endurance Array’s location, platforms and sensors were designed to address major OOI Science Themes with a particular focus on Hypoxia on Continental Shelves and Shelf/Slope Exchange [3]. Since its first full deployment in April 2015, the Endurance Array has maintained oxygen sensors at 6 fixed locations near the surface and near the bottom over the Washington and Oregon shelf and slope. Similar oxygen sensors are found on Endurance Array profilers and gliders and across other OOI arrays.
OOI marine operators, systems engineers and data team members have worked together to continually improve the quality of the OOI dissolved oxygen data products. We have worked with the vendor to improve their calibration of sensors; have compared data to physical samples [4]; and have implemented a UV-based biofouling mitigation [5].
Science Highlight: OOI Endurance Array data [6] describe low-oxygen events off central Oregon. Data from July 2017 illustrate variability on time scales of days as the wind-driven upwelling circulation advects low oxygen waters back and forth across the shelf. (Figure 1).
During this time, near-bottom oxygen levels at the OOI Oregon Inshore Surface mooring were often below the hypoxia threshold. When winds blow to the south, the near-bottom temperature decreases due to coastal upwelling, with a slight lag relative to the wind. During these events, near-bottom oxygen usually decreases (e.g., 23-25 July). Conversely, during low or northward winds the near-bottom temperature and oxygen increase rapidly. These changes are consistent with the upwelling circulation drawing near-bottom cold water low in dissolved oxygen toward the coast during upwelling and pushing warm water containing more oxygen down and away from the coast near the bottom during downwelling. The dissolved oxygen does not follow the winds or temperature as clearly as temperature follows the wind because there are the additional biological processes of photosynthesis and microbial decay that raise or lower dissolved oxygen levels, respectively.
Since this report [6], researchers continue to use OOI data to characterize hypoxia in summer 2018. There is also increasing interest in, and use of, OOI data by mission-oriented agencies such as the Oregon Department of Fish and Wildlife.
[blockquote][1] Grantham, B. A., Chan, F., Nielsen, K.J., Fox, D.S., Barth, J.A., Huyer, A., Lubchenco, A., Menge, B.A. (2004). Upwelling-driven nearshore hypoxia signals ecosystem and oceanographic changes in the northeast Pacific. Nature, 429, 749-754. DOI: 10.1038/nature02605.
[2] Chan, F., Barth, J.A., Lubchenco, J., Kirincich, A., Weeks, H., Peterson, W.T., Menge, B.A. (2008). Novel emergence of anoxia in the California Current System. Science, 319, 920, DOI: 10.1126/science.1149016
[3] ORION Executive Steering Committee (2007). Ocean Observatories Initiative Scientific Objectives and Network Design: A Closer Look. Joint Oceanographic Institutions, Inc. Washington, DC.
[4] Holm, C., R.T. Rohrer, E.P. Dever, and J.P. Fram (2018) Quality Assessment of Moored Near Surface Instrument Time Series on the OOI Endurance Array, Abstract IS14A-2541 presented at 2018 Ocean Sciences Meeting, Portland, OR, 12-16 Feb.
[5] Wingard, C.E., R.A. Desiderio, J.P. Fram, and E.P. Dever (2018) Time Series Measurements of Inherent and Apparent Optical Properties from the OOI Endurance Array, Abstract IS14A-2543 presented at 2018 Ocean Sciences Meeting, Portland, OR, 12-16 Feb.
[6] Barth, J. A., J. Fram, E. P. Dever, C. Risien, C. Wingard, R. W. Collier, and T. D. Kearney, 2018. Warm blobs, low-oxygen events and an eclipse: The Ocean Observatories Initiative Endurance Array captures them all, Oceanography 31(1): 90-97, https://doi.org/10.5670/oceanog.2018.114.
[/blockquote] Read More
Glider Observations Provide Insight into Spatial Patterns in Satellite Bio-Optical Measurements
From Henderikx et al., 9 February 2018
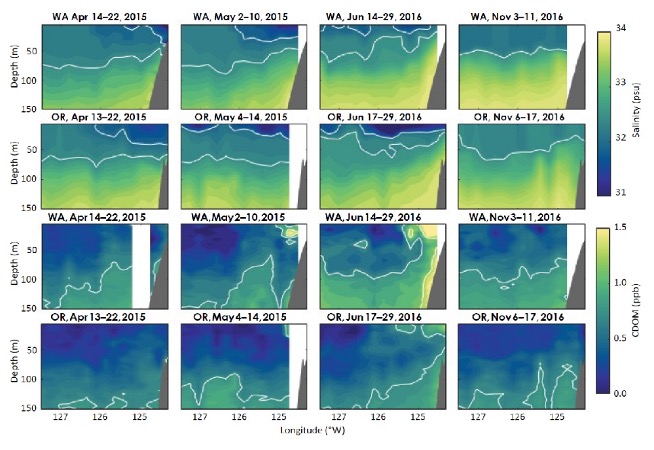
Hendrikx Freitas et al., 2018 compare satellite and Endurance Array glider estimates of chromophoric dissolved organic matter (CDOM) to characterize seasonal patterns and latitudinal and cross-shore gradients in particle concentrations between the Washington and Oregon shelves. While the Oregon and Washington shelves are both highly productive regions of the northern California Current Ecosystem, there are significant differences in the physical processes, with the central Washington shelf generally subject to weaker upwelling and a stronger Columbia River influence. The difference in physical forcing is reflected in satellite estimates of chlorophyll, which show higher concentrations off the Washington coast.
The conclusions from satellites contrast with in situ observations from gliders. Despite the differences in physical forcing, Henderikx et al., 2018 find OOI glider fluorescence based measurements of chlorophyll to be similar in magnitude across the Oregon and Washington shelves. Their research suggests that latitudinal differences in CDOM may be a partial explanation for perceived trends in satellite-derived chlorophyll. The OOI gliders gather simultaneous chlorophyll and CDOM fluorescence from an integrated three-channel sensor. While the glider observations indicate similar levels of chlorophyll fluorescence, they also show an increased presence of suspended sediments and CDOM off WA. The OOI observations, although temporally limited, indicate potential contamination of satellite retrievals of chlorophyll due to CDOM and suspended materials in the water column, particularly off the WA shelf, that should caution further attribution of satellite chlorophyll signals to differences in production.
Read MoreAxial Seamount: First Volcano Where a Submarine Eruption May Be Predicted
Wilcock et al., 16 December 2016
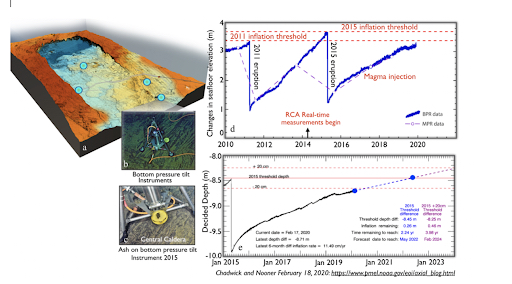
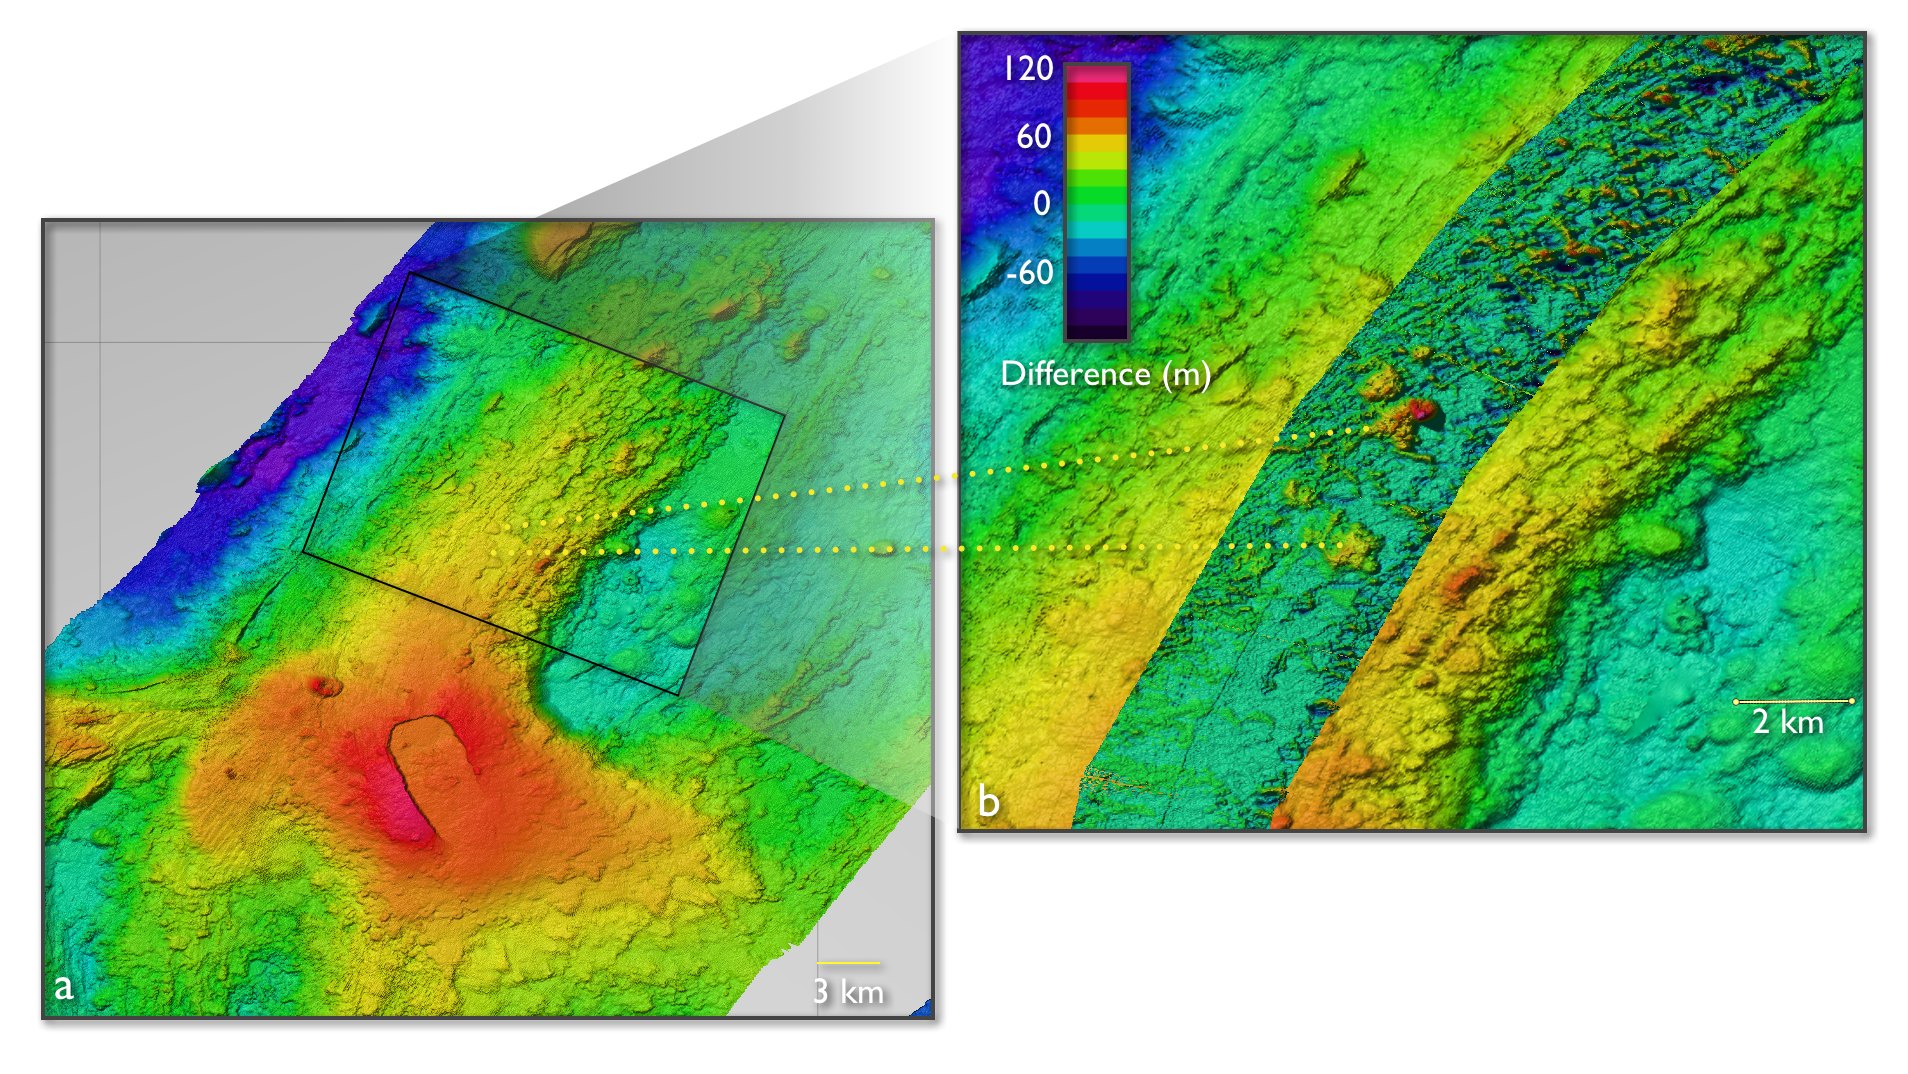
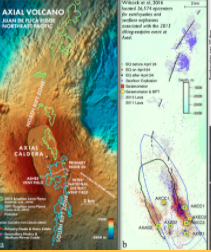
Axial Seamount was chosen as a key site on the Regional Cabled Observatory because it is the most active volcano on the Juan de Fuca Ridge having erupted in 1998, 2011, and 2015 [1-7] and because it has a long history of observations as the site of the first submarine volcanic observatory “NeMO” [1-2; https://www.pmel.noaa.gov/eoi/nemo/index.html]. Axial is also unique because the structure of microbial communities has been examined for over 2 decades, including prior to and immediately following the eruptions [8-11]. Nearly continuous seafloor deformation measurements began in 1998 using battery-powered bottom pressure recorders (BPR’s), augmented by mobile pressure recorders in 2000 [3,12-14]. In 2014, an array of cabled bottom pressure tilt instruments, developed by Chadwick [13,14], were installed within the caldera providing real-time measurements of seafloor inflation caused by magma injection in the subsurface and extremely rapid deflation events coincident with eruptions and draining of the magma chamber [13,14]. In concert, these measurements, coupled with modeling, provide forecasting of when the next eruption may occur [13,14; https://www.pmel.noaa.gov/eoi/axial_blog.html].
The ability to make such forecasts is rare in both terrestrial and submarine environments, however, they are possible at Axial due to the continuous magma supply from the Cobb hotspot plume [12-14]. The subsurface structure of Axial is the best imaged submarine volcano due to multiple seismic imaging programs. In concert, these field programs have resulted in 3-D tomographic imaging of the magmatic system [15-20], providing unparalleled insights into melt distribution and magma flux, which controls seafloor deformation. Two large magma bodies at 1.1 to 2.6 km beneath the seafloor [15-18] and a newly recognized deep 3-5 km wide conduit located 6 km beneath the seafloor have been imaged [18]. The conduit is interpreted to contain a series of stacked melt lenses (sills) with spacings of 300-450 meters, providing melt transport that activated the eruptions in 1998, 2011, and 2015 [18]. The 22-year monitoring of Axial Seamount by Chadwick and Nooner document co-eruption deflation events in the caldera of 2.5-3.2 meters, followed by variable periods of inflation [14]. Based on the long-term time series, the 2015 eruption was forecast within a 1-year time window, seven months in advance of the eruption [14]. Daily updates are provided by the model, and coupled with real-time seismic measurements [e.g. 21], will allow refinement of when the next eruption will occur.
[blockquote][1] Embley Jr., R.W., Chadwick, W.W., Clague, D., and Stakes, D., (1999) The 1998 Eruption of Axial Volcano: multibeam anomalies and seafloor observations. Geophysical Research Letters, 26, 2428– 3425.
[2] Embley, R.W., Baker, E.T., (1999) Interdisciplinary group explores seafloor eruption with remotely operated vehicle. Eos Trans. AGU, 80, 213, 219, 222.
[3] Chadwick, W.W., Jr., Nooner, S.L. Zumberge, M.A.. Embley, R.W., Fox, C.G. (2006) Vertical deformation monitoring at Axial Seamount since its 1998 eruption using deep-sea pressure sensors. Journal of Volcanology and Geothermal Research, 150, 323-327.
[4] Chadwick, W.W., Jr., Paduan, J.B., Clague, D.A., Dreyer, B.M., Merle, S.G. Bobbitt, A.M. Bobbitt, Caress, D.W. Caress, Philip, B.T., Kelley, D.S., and Nooner, S. (2016) Voluminous eruption from a zoned magma body after an increase in supply rate at Axial Seamount. Geophysical Research Letters, 43, 12,063-12,070; https://doi.org/10.1002/2016GL071327.
[5] Caress, D. W., Clague, D. A. Paduan, J. B., Martin, J. F., Dreyer, B. M., Chadwick, W.W., Jr., Denny, A., and Kelley, D.S. (2012) Repeat bathymetric surveys at 1-metre resolution of lava flows erupted at Axial Seamount in April 2011. Nature Geoscience, 5(7), 483–488.
[6] Clague, D.A., Dryer, B.M., Paduan, J.B., Martin, J.F., Chadwick, W.W., Caress, D.W., Portner, R.A., Guilderson, T.P., McGann, M.L., Thomas, H., Butterfield, D.A., Embley, R.W. (2013) Geolgoica history of the summit of Axial Seamount, Juan de Fuca Ridge. Geochemistry Geophysics Geosystems, 14 (10), https://doi.org/10.1002/ggge.20240.
[7] Clague, D.A., Paduan, J.B., Caress, D.W., Chadwick, W.W., Jr., Le Saout, M., Dreyer, B.M. and Portner, R.A. (2017) High-resolution AUV mapping and targeted ROV observations of three historic lava flows at Axial Seamount. Oceanography, 30(4), 82–99; https://doi.org/10.5670/oceanog.2017.426.
[8] Huber, J.A., Butterfield, D.A., and Baross, J.A. (2003) Bacterial diversity in asubseafloor habitiat following a deep-sea volcanic eruption. FEMS Microbiology Ecology, 43, 393-409.
[9] Opatkiewicz, A.D., Butt4erfield, D.A., and Baross, J.A. (2009) Individual hydrothermal vents at Axial Seamount harbor distinct subseafloor microbial communities. FEMS Microbiology Ecology, 70, 413-424. https://doi.org/10.1111/j.1574-6941.2009.0074.x.
[10] Meyer, J.L., Akerman, N.H., Proskurowski, G., and Huber, J.A. (2013) Microbial characterization of post-eruption “snowblower” vents at Axial Seamount, Juan de Fuca Ridge. Frontiers in Microbiology, doi.org/10.3389/fmicb.2013.00153.
[11] Spietz, R.L., Butterfield, D.A., Buck, N.J., Larson, B.L., Chadwick, W.W., Jr., Walker, S.L., Kelley, D.S. and Morris, R.M. (2018) Deep-sea volcanic eruptions create unique chemical and biological linkages between the subsurface lithosphere and the oceanic hydrosphere. Oceanography, 31, 128-135; doi.org/10.5670/oceanog.2018.120.
[12] Nooner, S.L., and Chadwick, W.W., Jr., (2009) Volcanic inflation measured in the caldera of Axial Seamount: Implications for magma supply and future eruptions. Geochemistry, Geophysics, Geosystems, 10(2), doi.org/10.1029/2008GC002315.
[13] Nooner, S.L., and Chadwick, W.W. Jr. (2016) Inflation- predictable behavior and co-eruption deformation at Axial Seamount. Science, 354, 1399-1403; https://science.sciencemag.org/content/354/6318/1399
[14] Chadwick, W.W., Jr., Nooner, S.L., and Lau, T.K.A. (2019) Forecasting the next eruption at Axial Seamount based on an inflation-predictable pattern of deformation. American Geophysical Union, Fall Meeting 2019, OS51B-1489.
[15] Arnulf, A. F., Harding, A. J., Kent, G. M., Carbotte, S. M., Canales, J. P., and Nedimovic, M. R. (2014) Anatomy of an active submarine volcano. Geology, 42(8), 655–658. https://doi.org/10.1130/G35629.1
[16] Arnulf, A.F., Harding, A.J., Kent, G.M., and Wilcock, W.S.D. (2018) Structure, seismicity and accretionary processes at the hot-spot influenced Axial Seamount on the Juan de Fuca Ridge. Journal of Geophysical Research, 10.1029/2017JB015131.
[17] Carbotte, S. M., Nedimovic, M. R., Canales, J. P., Kent, G. M., Harding, A. J., and Marjanovic, M. (2008) Variable crustal structure along the Juan de Fuca Ridge: Influence of on-axis hot spots and absolute plate motions. Geochemistry, Geophysics, Geosystems, 9, Q08001. doi.org/10.1029/2007GC001922.
[18] Carbotte, S.M., Arnulf, A., Spiegelman, M., Lee, M., Harding, A., Kent, G., Canales, J.P., and Nedimovic, M., Stacked sills forming a deep melt-mush feeder conduit beneath Axial Seamount. Geology, 48, (7) 693-697. https://doi.org/10.1130/G47223.1.
[19] West, M., Menke, W., and Tolstoy, M. (2003) Focused magma supply at the intersection of the Cobb hotspot and the Juan de Fuca ridge. Geophysical Research Letters, 30(14), 1724. https://doi.org/10.1029/2003GL017104.
[20] West, M., Menke, W., Tolstoy, M., Webb, S., and Sohn, R. (2001). Magma storage beneath Axial volcano on the Juan de Fuca mid-ocean ridge. Nature, 413(6858), 833–836. doi.org/10.1038/35101581.
[21] Wilcock, W.S.D., Tolstoy, M., Waldhauser, F., Garcia, C., Tan, Y.J., Bohnenstiehl, D.R., Caplan-Auerbach, J., Dziak, R., Arnulf, A.F., and Mann, M.E. (2016) Seismic constraints on caldera dynamics from the 2015 Axial Seamount eruption. Science, 354, 1395-399;
https://doi org/10.1126 /science.aah5563.
[/blockquote] Read More
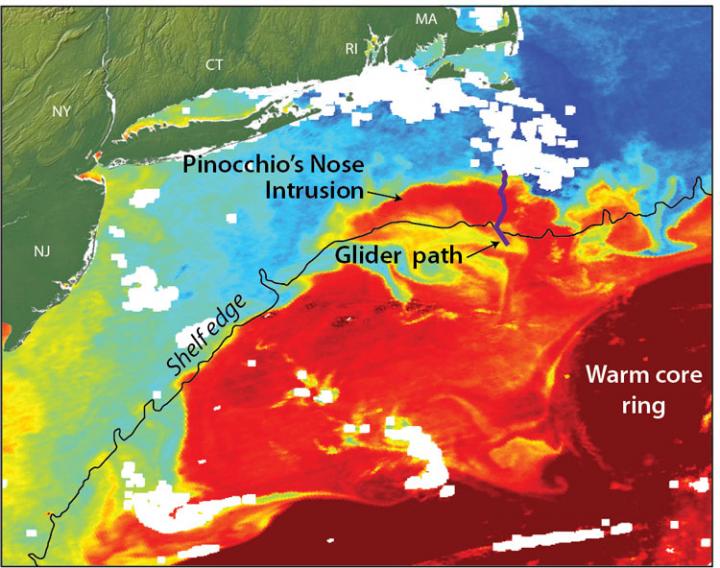
Gulf Stream Ring Water Intrudes onto Continental Shelf Like “Pinocchio’s Nose”
Ocean robots installed off the coast of Massachusetts have helped scientists understand a previously unknown process by which warm Gulf Stream water and colder waters of the continental shelf exchange. The process occurs when offshore waters, originating in the tropics, intrude onto the Mid-Atlantic Bight shelf and meet the waters originating in regions near the Arctic. This process can greatly affect shelf circulation, biogeochemistry and fisheries.
In 2006, scientists using satellite imagery observed an elongated body of warm water from a Gulf Stream warm-core ring intruding along the shelf edge, extending hundreds of miles from Massachusetts towards Cape Hatteras, NC.
“A lot of people were surprised by this,” said Weifeng ‘Gordon’ Zhang, associate scientist at Woods Hole Oceanographic Institution (WHOI), and lead author of the study published today in Geophysical Research Letters. “Normally, the Gulf Stream water, which is very warm and buoyant, doesn’t come in direct contact with the water on the continental shelf, which is much colder. There is a cascade of potential implications that need further study.”
Until now, scientists had been unable to study the phenomenon because satellites can only sense the ocean surface, and no data about the structure of the intrusion water below the surface were available. However, in April 2014, water column data in this area became available from preliminary deployments from the National Science Foundation-funded Ocean Observatories Initiative (OOI). Specifically, autonomous vehicles called “gliders” that collect data along a pre-defined path in the ocean, were deployed at the OOI Pioneer Array site south of Cape Cod. Zhang and his colleagues used preliminary glider data, collected from April through June 2014 and publicly available on the OOI website, to generate the first profile of the complex, layered masses of water at this vital point in the ocean.
“The edge of the continental shelf is a key location where dense, nutrient rich water ‘upwells’ to the surface, stimulating growth at the base of the food web,” said co-author Glen Gawarkiewicz, a senior scientist at WHOI. “This water is normally sandwiched between colder, fresher water on the shelf and warmer Gulf Stream waters offshore. Understanding changes in this region has important societal and economic implications.”
Satellite imagery shows five similar-looking intrusion events have occurred between 2007-2014 in the winter and spring seasons. Zhang and Gawarkiewicz have dubbed the events “Pinocchio’s Nose Intrusions” (PNI) because the warm water intrudes onto the shelf and continues to “grow” for hundreds of miles, moving in the opposite direction from the northeastward movement of the Gulf Stream.
Until this new research was conducted, one proposed explanation was that the warm waters were swept up in the shelf break jet, a current that moves toward the southwest direction along the shelf edge. Zhang calls this “the deception or lie” of the Pinocchio’s Nose Intrusion. “If the intrusion was caused by the shelfbreak jet,” said Zhang, “this feature would most likely be a very thin, superficial feature on the surface.” In contrast, thanks to the data collected by the OOI Pioneer Array gliders before and after the PNI formed, the scientists determined these intrusions are nearly 100 meters deep, extending almost to the seafloor.
Rotating warm core rings form in the deep ocean and eventually pinch off from the Gulf Stream, heading in a northwest direction onto the shallower continental slope. The outer limbs of the rings hit the slope first, and are squeezed by the rising sea floor. Once reaching the shelf, they follow the shelf edge extending to the southwest forming the long nose shape. Eventually, the extension stops, and thin filaments coming out of the north side of the nose penetrate further onto the shelf.
The OOI Pioneer Array data also allowed scientists to understand the complexities of what is driving the density of the various water masses at this unique location. Under normal conditions, the density in the region is controlled by the salinity. The shelf water is fresher than offshore water and therefore more buoyant than saltier offshore water. However, during a PNI event, the shelf water is less buoyant than the offshore water because of a huge temperature difference–approximately 25-30 degrees Fahrenheit–between the shelf waters and the intrusion waters.
“Because the Gulf Stream water is so outrageously warm, density now is controlled by the temperature, and the intrusion water is more buoyant, despite being saltier,” said Zhang.
The changes in temperature, density and circulation all have major implications for the fisheries in the area.
“I showed the glider data to a group of commercial fisherman back in April, in Rhode Island, and they were very surprised,” said Gawarkiewicz. “They couldn’t believe the temperature can change by that much, that quickly.”
The scientists believe the PNI process might assist in the transport of young fish, like American eel, across the shelfbreak barrier and onto the shelf, where they can swim toward coastal estuaries. For American eels, this is an important step of their reproductive migration journey and crucial for their survival. The baby eels have to make it from the spawning ground in the tropics to their estuarine and freshwater habitats on the US northeast coast in the first year of their life. The direct intrusion of the Gulf Stream water onto the shelf can help them reach their destination without being swept away, and may increase their survival rate. But for other species, the intrusion might bring in the low nutrient Gulf Stream surface water and suppress the upwelling of cold, dense, nutrient-rich water, and thereby reduce biological productivity in a region that is otherwise known for its fertile fishing grounds.
“I just find it extraordinary that the Pioneer Array gliders were out for a month, and we have already identified a new shelf break exchange process,” said Gawarkiewicz. “It just goes to show how much more we have to learn in the shelf-wide ecosystem.”
“I am very proud of our WHOI scientists, Weifeng Zhang and Glen Gawarkiewicz,” said Representative William Keating (D-MA). “Their discovery serves as a reminder of the critical need for continued and more frequent ocean observation, as well as the interconnectedness of the health of our oceans and the health of our marine ecosystems. WHOI has long been an international leader in oceanography, with groundbreaking research unveiling countless discoveries that have changed the field. This breakthrough is no different. As we continue to study and understand the magnitude and impacts of the changes of ocean temperatures and circulation, WHOI’s research and resources will be invaluable.”
###
The research was funded by the National Science Foundation.
The Woods Hole Oceanographic Institution is a private, non-profit organization on Cape Cod, Mass., dedicated to marine research, engineering, and higher education. Established in 1930 on a recommendation from the National Academy of Sciences, its primary mission is to understand the ocean and its interaction with the Earth as a whole, and to communicate a basic understanding of the ocean’s role in the changing global environment. For more information, please visit http://www.
OOI Team First to See April 24, 2015 Eruption of Axial Seamount
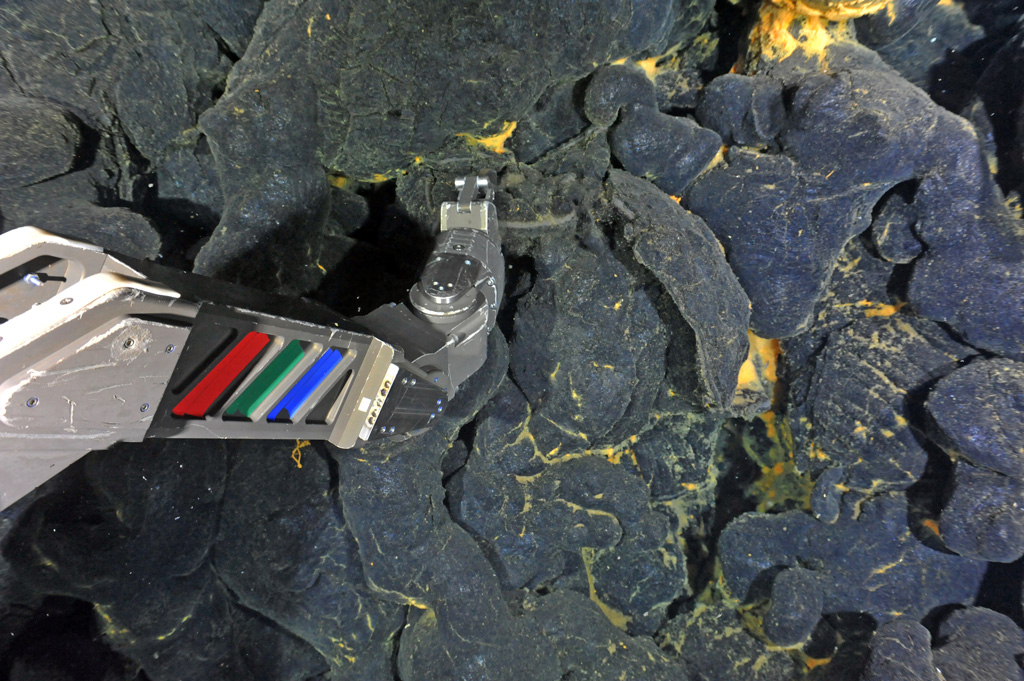
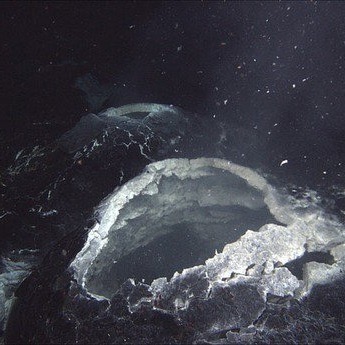
At 7:33 p.m. PST on July 26th, 2015, after descending ~1840 m beneath the oceans surface, the remotely operated vehicle ROPOS and the University of Washington OOI Cabled Array team set first eyes on the April 24th, 2015 voluminous eruption of Axial Seamount during the VISIONS’ 15 cruise.
Read MoreAxial Eruption Site Identified – Bathymetric Survey Data Available Online
On April 24th, 2015, the Axial Volcano, situated on the Juan de Fuca plate 300 miles offshore, erupted one-mile deep in the ocean and we saw it.
Read MoreFollowing the Eruption and Evolution of a Submarine Volcano Live
An outstanding RCA science success has been the unprecedented insights into submarine volcanism (which accounts for >70% of the volcanism on Earth) through cabled instrumentation at Axial Seamount [1-5; 10-22].
Read MoreNew Research to Help Scientists Better Predict Underwater Volcanic Eruptions
A team of scientists studying last year’s eruption of Axial Seamount now says that the undersea volcano some 250 miles off the Oregon coast gave off clear signals hours before the eruption.
Read More