
Posts Tagged ‘Axial Seamount’
Long-Term Monitoring of Gas Emissions at Southern Hydrate Ridge
Identifying the parameters that control or influence seabed methane release is important to refining understanding of the carbon cycle. Data from the Regional Cabled Array are providing time-series required to quantify the flux of methane from the seafloor.
Read MoreFacilitating Observatory-Based Subseafloor Science
Data flowing from the Regional Cabled Array forms an unparalleled foundation to understand the relationships between microbial, hydrological, geochemical, and geophysical processes in active oceanic crust. Proposed Axial drilling will provide a unique opportunity to determine the nature of subseafloor hydrological properties and develop a 3-D understanding of subseafloor processes in unsedimented crust.
Read MoreDiscovery of Axial Seamount Deep Melt-Mush Feeder Conduit
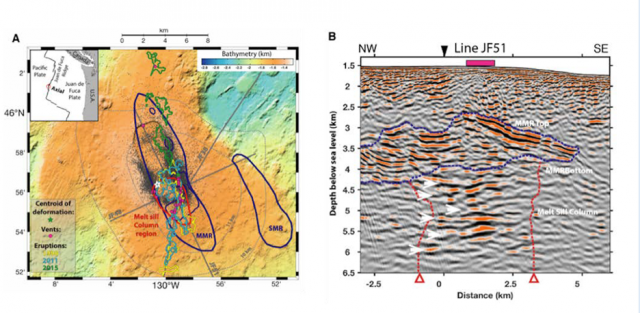
Recent observations at Axial Seamount provide new seismic images of the deep magma plumbing system, revealing a stacked sill complex beneath the main magma reservoir of this submarine volcano. The discovery of this deep melt-mush conduit at Axial, where long-term monitoring observations are supported by the Regional Cabled Array, is providing new understanding of magmatic systems on Earth.
Read MoreAxial Seamount Helping Scientists Forecast Eruptions
On March 20, 2023, Oregon Public Radio reported about scientists work at Axial Seamounts, a seamount and submarine volcano on the Juan de Fuca Ridge, about 480 kilometers off the coast of Oregon. The story details how bottom pressure recorders connected to OOI’s Regional Cabled Array are helping reveal the inner workings of the Axial Seamount and helping scientists forecast when it might erupt next. Featured are Oregon State University Professor Bill Chadwick, University of North Carolina Professor Scott Nooner, Oregon State University Assistant Professor Jeff Beeson, and College of Charleston Assistant Professor Haley Cabannis.
Access the article here.
Read MoreStudent Videos Give Inside Look at Research and Safety
Four students from Queens College were aboard the R/V Marcus G Langseth for a recent ten-day research expedition to the Axial Seamount, a submarine volcano in the northeast Pacific Ocean that erupted in 1998, 2011, and 2015. The students were assisting a National Science Foundation Research team that is deploying autonomous ocean-bottom seismometers on OOI’s Regional Cabled Array as part of a two-year experiment taking place within the predicted time window of the next eruption.
The NSF-funded project is led by William Wilcock from the University of Washington and co-led by Felix Waldhauser, Columbia Climate School’s Lamont-Doherty Earth Observatory, who served as chief scientist on this expedition, Maya Tolstoy (UW), and Yen Joe Tan from the Chinese University of Hong Kong, who also was onboard.
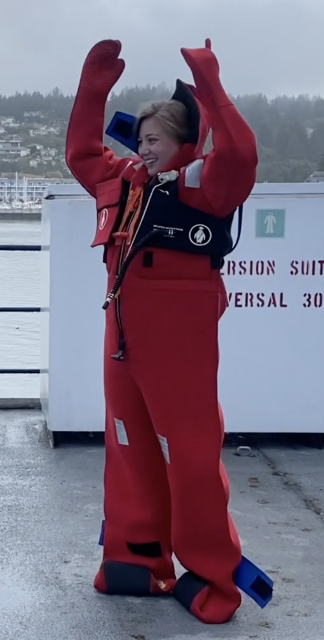
Queens college graduate student Jacqueline Singer was onboard to further work towards her master’s degree. She teamed up with undergraduates Rania Taib, Hema Muni, and Julia Sandke to create two videos – one explains their research, while the other provides an insider’s look at safety issues at sea. In the first video, the students give an in-depth look at how they deployed 15 autonomous ocean-bottom seismometers and how they work. In the second video, the students explain the importance of survival suit training, followed by a humorous look at the complex movements needed to successfully suit up in a “Gumby suit.”
Columbia University PhD candidate Theresa Sawi also provides a written account of the expedition here.
https://vimeo.com/user110037220/studentsataxialseamount
https://vimeo.com/user110037220/gumbysuitdemo
Read MoreCatching the Next Eruption of Axial Seamount
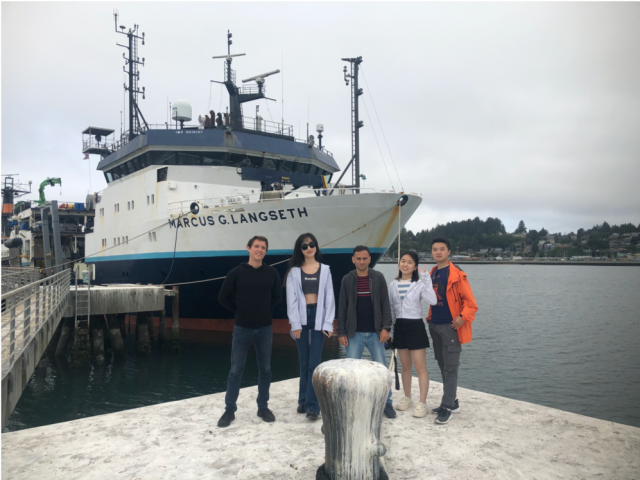
Theresa Sawi, a PhD student in Columbia’s Department of Earth and Environmental Sciences and the Lamont-Doherty Earth Observatory, shares her reflections and more about the science behind a six-day research expedition to Axial Seamount. She gives a behind the scenes look as researchers from Columbia University on the R/V Marcus G Langseth deployed 15 autonomous ocean-bottom seismometers atop Axial Seamount, a submarine volcano in the northeast Pacific Ocean that erupted in 1998, 2011, and 2015. The research expedition was part of a two-year experiment taking place within the predicted time window of the next eruption.
The seismometers were added to OOI’s Regional Cabled Array. To read Sawi’s account, click here.
[media-caption path="/wp-content/uploads/2022/09/Langseth.png" link="#"]15 scientists were onboard the Langseth, with ranks ranging from professor to undergraduate researcher. Credit: Theresa Sawi.[/media-caption]Read More
Axial Seamount Continues to Reveal Its Secrets
Adapted and condensed by OOI from Chadwick et al., 2022, doi:/10.1029/2021GC010153.
Axial Seamount is the longest monitored mid-ocean ridge volcano, providing new insights into the relationships among magma supply, uplift-deflation behavior, and seismicity leading to and follow eruptions. Results are as summarized here.
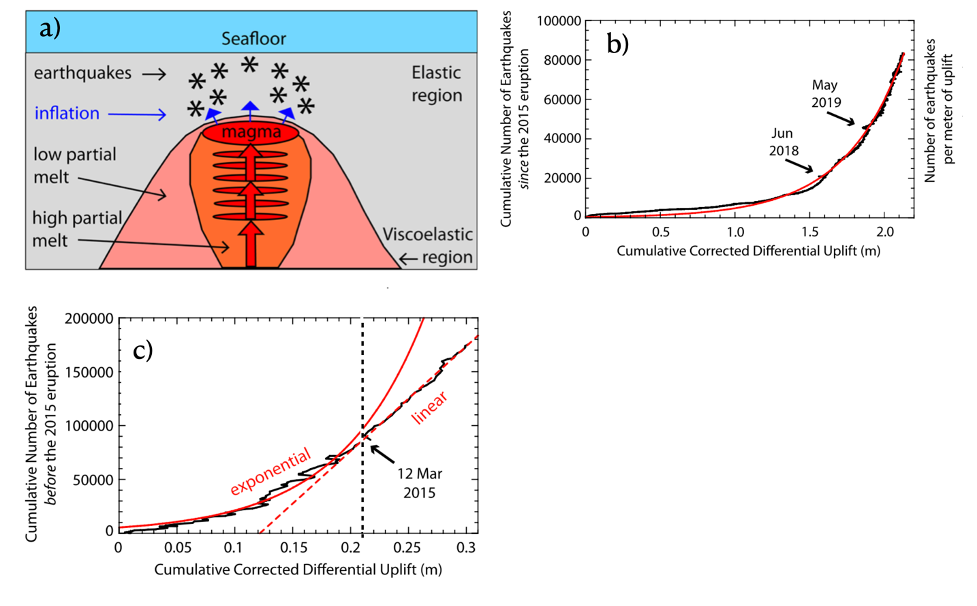
[media-caption path="/wp-content/uploads/2022/02/Axial.png" link="#"]a) Cross section cartoon showing shallow magma chamber beneath Axial fed by a series of stacked sills. Upward migrating of melt through the sills results increases pressure in the shallow chamber causing uplift and associated earthquakes. b) Exponential increase in earthquakes per meter of uplift since the 2015 eruption. c) Earthquakes per meter of uplift before March 12, 2015 follow an exponential increase, while post this day earthquakes follow a linear trend leading up to the April 24, 2015 eruption. (After Chadwick et al., 2022; Figures 6 and 13).[/media-caption]The magma supply rate has changed significantly over periods of months to years. Since the 2015 eruption, the summit of the volcano has been inflating at a decreasing rate. This re-inflation was punctuated by eight discrete short-term deflation events occurring over 1-3 weeks, approximately every 4-6 months from August 2016 to May 2019. These deflation events were coincident with an abrupt decrease in seismic activity, which did not pick up until reinflation resumed. In contrast, the long-term monitoring indicates that there was a surge in magma supply between 2011 and 2015, resulting in the two eruptions closely spaced in time.
Although the summit of the volcano has inflated 85%-90% of its pre 2015 eruption level, the geodetic and seismic monitoring suggests that the magma supply rate has been waning since 2015, pushing the forecast for the next eruption out 4-9 years. The data since 2015 also show that the deformation and seismic activity are tightly coupled, showing an exponential increase in seismic activity per unit of uplift. A significant conclusion from this study is that the transition from an exponential to linear increase in seismic activity to total uplift may indicate impending crustal failure between the shallow magma chamber and the seafloor. In concert, these results may lead to more refined forecasting of future eruptions of this highly active volcano and the testing of hypotheses concerning the short-term deflation events.
__________________________________________________________
Chadwick, W.W., Jr., W.S.D. Wilcock, S.L. Nooner, J.W Beeson, A.M. Sawyer, and T.-K. Lau (2022) Geodetic monitoring at Axial Seamount since its 2015 eruption reveals a waning magma supply and tightly linked rates of deformation and seismicity. Geochemistry, Geophysics, Geosystems, 23, e2021GC01053.
Read MoreRCA Recording Swarm of Earthquakes in Real Time

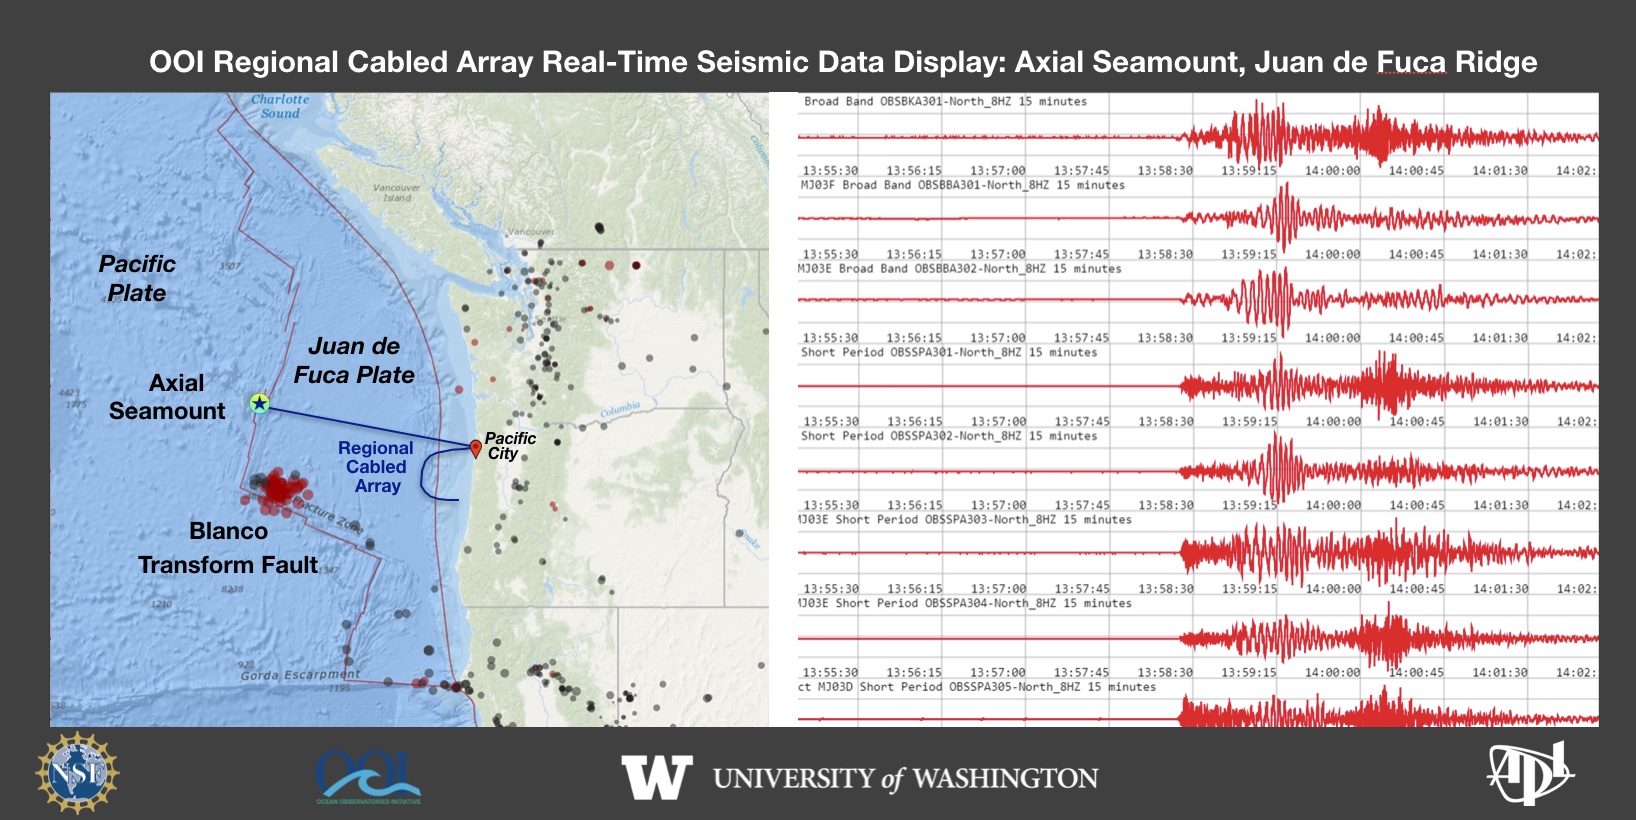 On December 7, 2021 a swarm of earthquakes began on the Blanco Transform Fault, a major plate boundary at the southern end of the Juan de Fuca Plate. The ongoing seismic swarm is being tracked live by the National Science Foundation’s underwater observatory, the Regional Cabled Array (RCA). The RCA is a component of NSF’s Ocean Observatories Initiative and is operated and maintained by the University of Washington. It includes ~900 km of high power and high bandwidth submarine fiber optic cables that stretch from Pacific City, OR out to the most active volcano off the coast “Axial Seamount” that erupted in 1998, 2011 and again in 2015. A second cable heads south along the Cascadia Subduction Zone and turns east along the Cascadia Margin off Newport, OR. Over 150 instruments on the seafloor and on instrumented moorings provide real-time data flow to shore at the speed of light. A suite of seismometers at the summit of Axial Seamount lit up on December 7, 2021 as the seismic swarm began along the Blanco. This live feed was developed by the UW Applied Physics Laboratory.
Read More
PI Cabled Instrument Provides Real-Time Sonar Measurements of Hydrothermal Plume Emissions
Adapted and condensed by OOI from Xu et al., 2022, doi:/10.1029/2020EA001269.
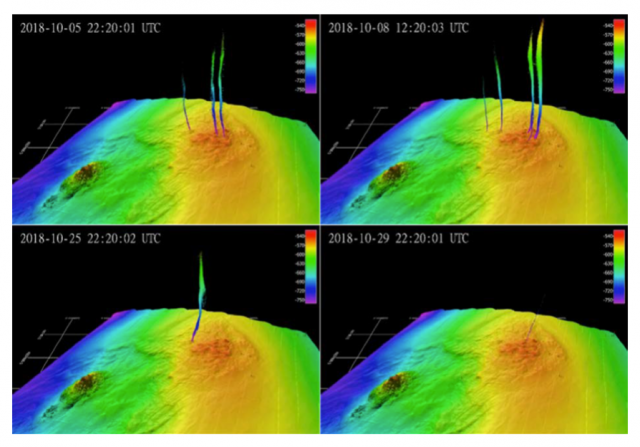
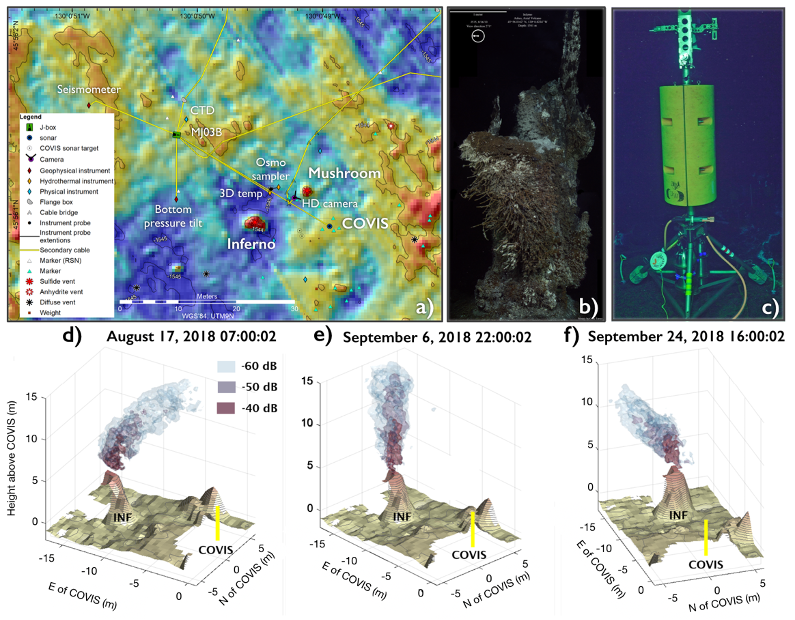
[media-caption path="https://oceanobservatories.org/wp-content/uploads/2021/02/RCA-FOR-SCIENCE-HIGHLIGHTS.png" link="#"]Figure 26. a) Location of the COVIS sonar and RCA infrastructure in the ASHES Hydrothermal Field. Also shown are locations of the active ~ 4 m tall hydrothermal edifices ‘Mushroom’ and ‘Inferno’. c) The COVIS sonar in 2019 (Credit: Rutgers/UW/NSF-OOI/WHOI). The tower is 4.2 m tall and hosts a modified Reson 7125 SeaBat multibeam sonar mounted on a tri-axial rotator. The system was built by the UW Applied Physics Laboratory. d) Selected time-series images from COVIS showing bending of the plume eastward, e) a nearly vertical plume, and f) southward bending of the plume (after Fig. 7 Xu et al., 2020).[/media-caption]The Cabled Observatory Vent Imaging Sonar (COVIS) was installed on the OOI RCA in the ASHES hydrothermal field (Fig. 26 a-c) at the summit of Axial Seamount in 2018, resulting in the first long-term, quantitative monitoring of plume emissions (Xu et al., 2020). The sonar provides 3-dimensional backscatter images of buoyant plumes above the actively venting ‘Inferno’ and ‘Mushroom’ edifices, and two-dimensional maps of diffuse flow at temporal frequencies of 15 and 2 minutes, respectively. Sonar data coupled with in-situ thermal measurements document significant changes in plume variations (Fig. 26 d-f) and modeling results indicate a heat flux of 10 MW for the Inferno plume (Xu et al., 2020). COVIS will provide key data to the community investigating the impacts of eruptions on hydrothermal flow at this highly active volcano.
[1] Xu, G., Bemis, K., Jackson, D., and Ivakin, A., (2020) Acoustic and in-situ observations of deep seafloor hydrothermal discharge: OOI Cabled Array ASHES vent field case study. Earth and Space Science. Note: This project was funded by the National Science Foundation through an award to PI Dr. K. Bemis, Rutgers University – “Collaborative Research: Heat flow mapping and quantification at ASHES hydrothermal vent field using an observatory imaging sonar (#1736702). COVIS data are available through oceanobservatories.org.
Read MoreRCA Video Shared via Oregon Coast Beach Connection
The Oregon Coast Beach Connection reports:
(Newport, Oregon) – There’s a whole lotta Sci-Fi-like action taking place off the Washington and Oregon coast, and no one really knows. Think the movie “Sphere” with a touch of “The Abyss,” throw in some X-Files and even a handful of high seas adventures, and you may have what’s going on with the Ocean Observatories Initiative (OOI), its enormous cabled array around the ocean floor, and the occasional research vessel – all studying the Axial Mount undersea volcano and the entirety of that area where the two tectonic plates meet…
Read More