
Posts Tagged ‘Cabled Array’
Student Videos Give Inside Look at Research and Safety
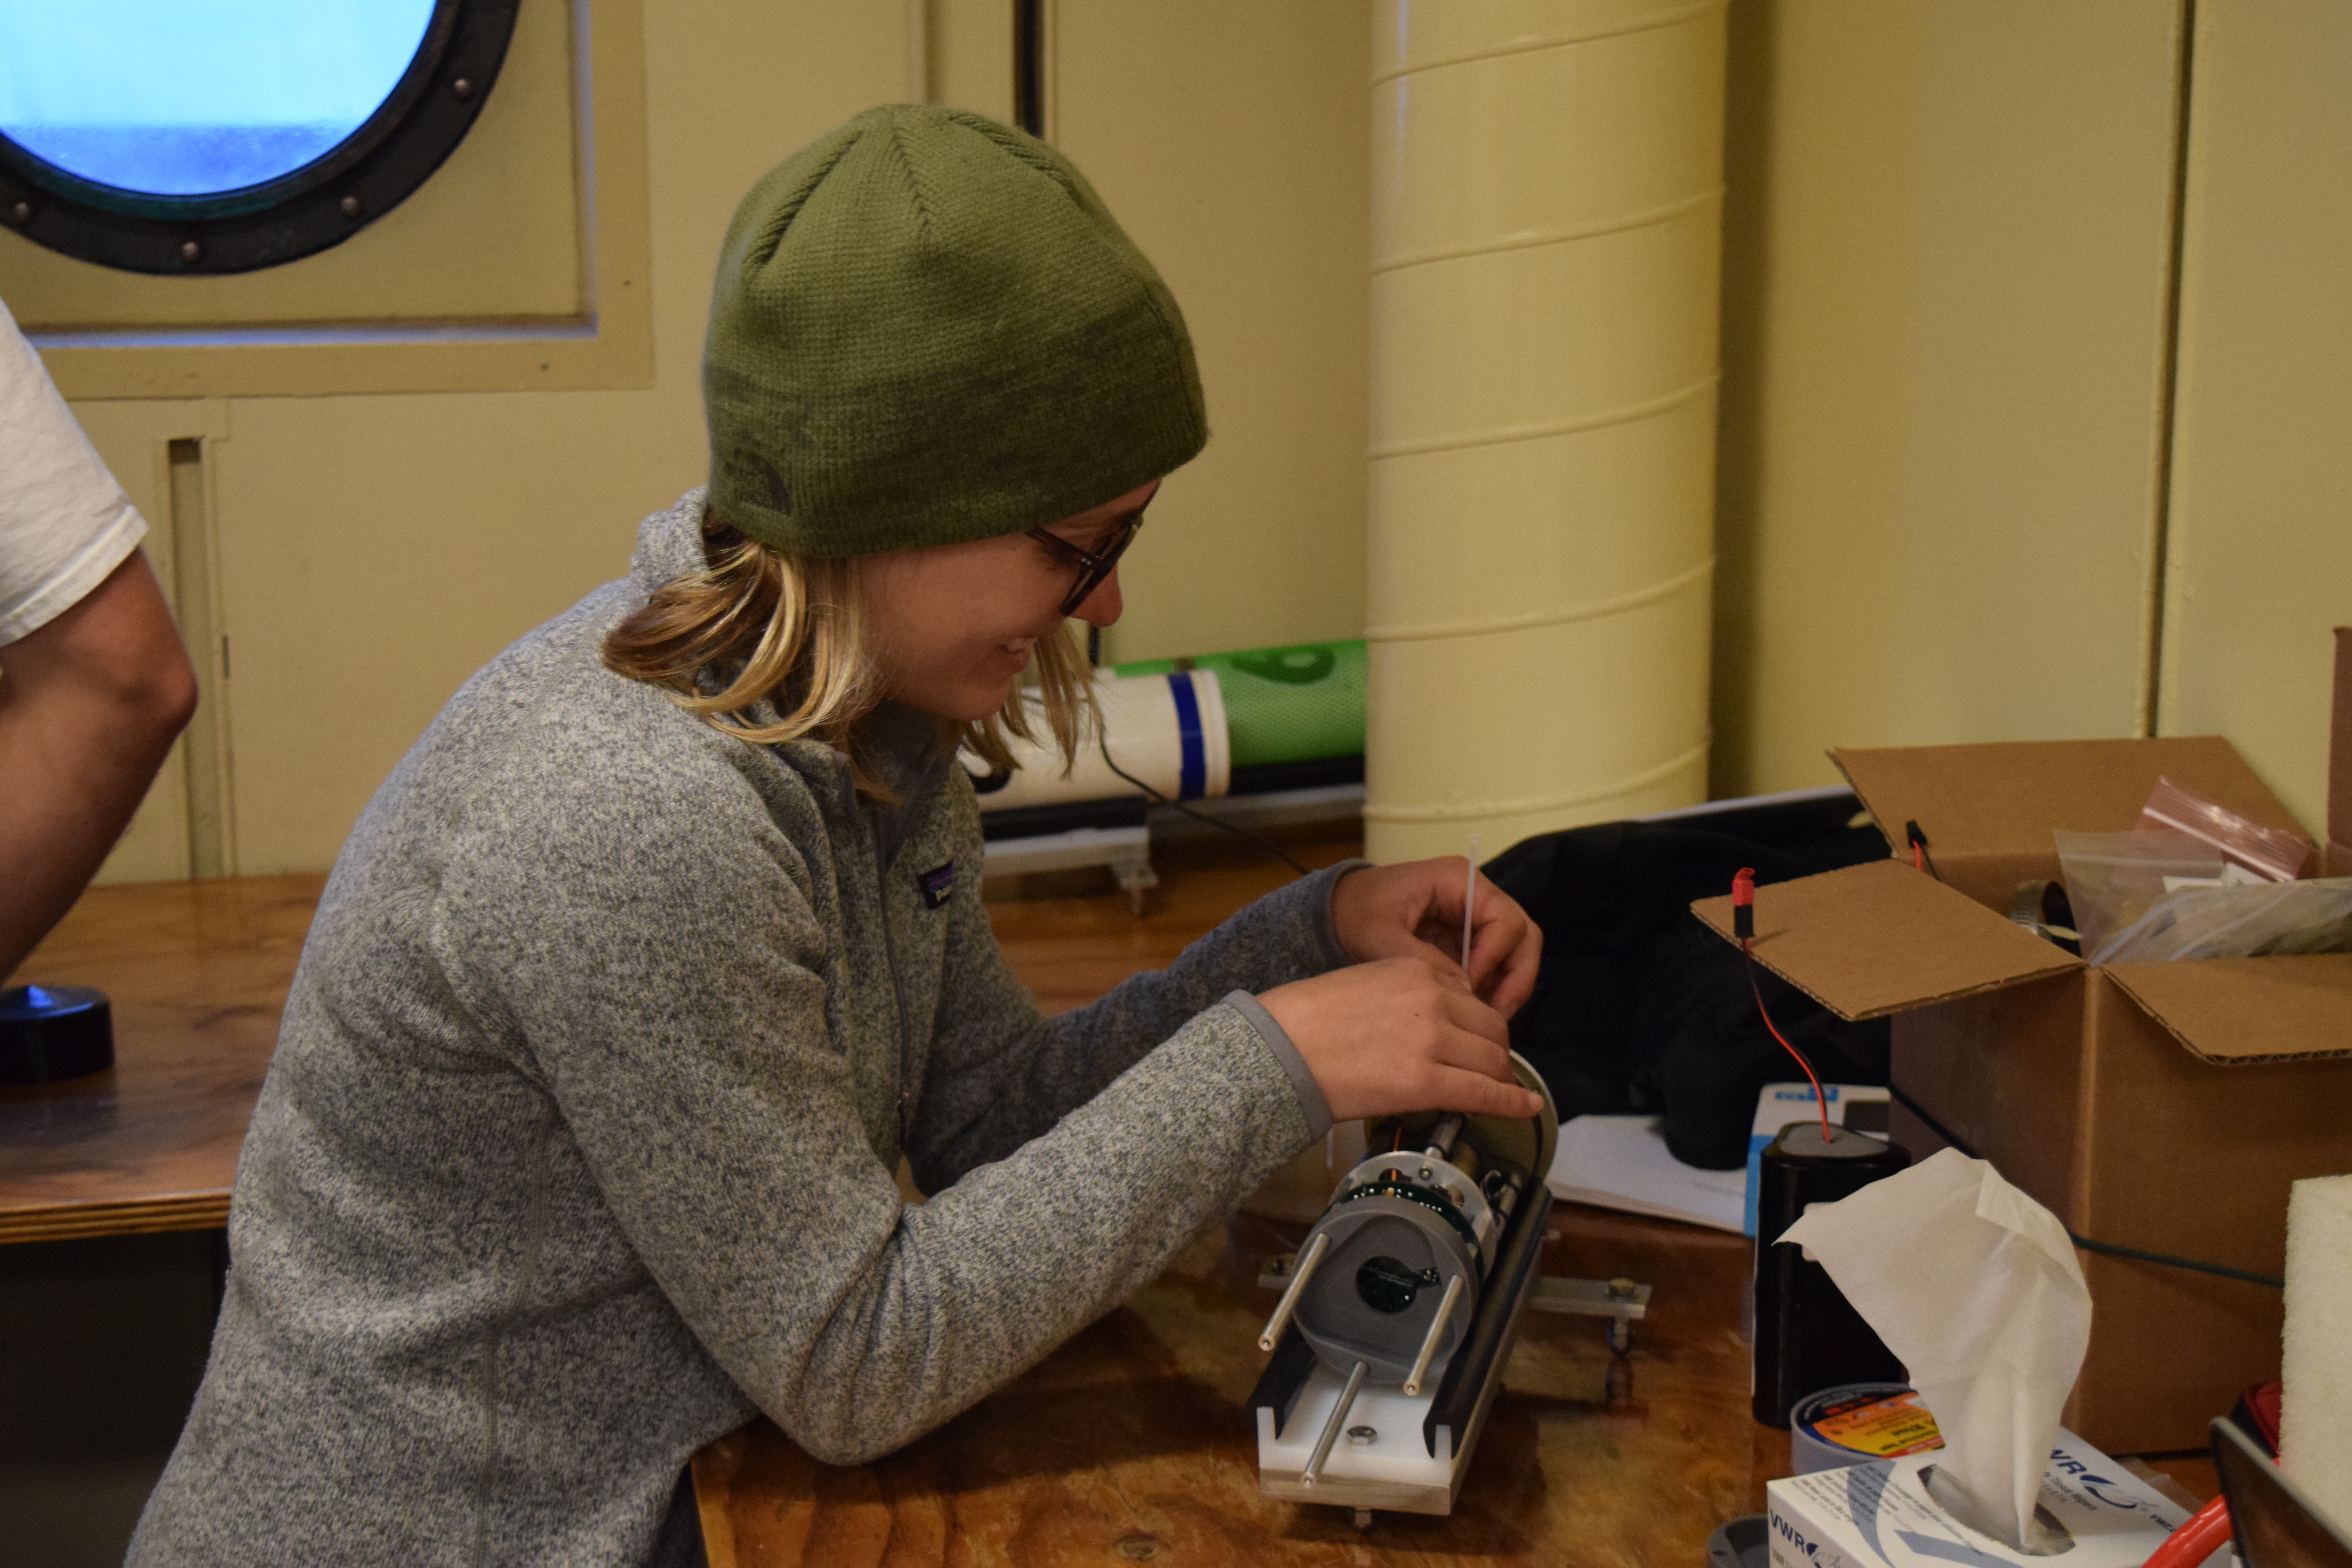
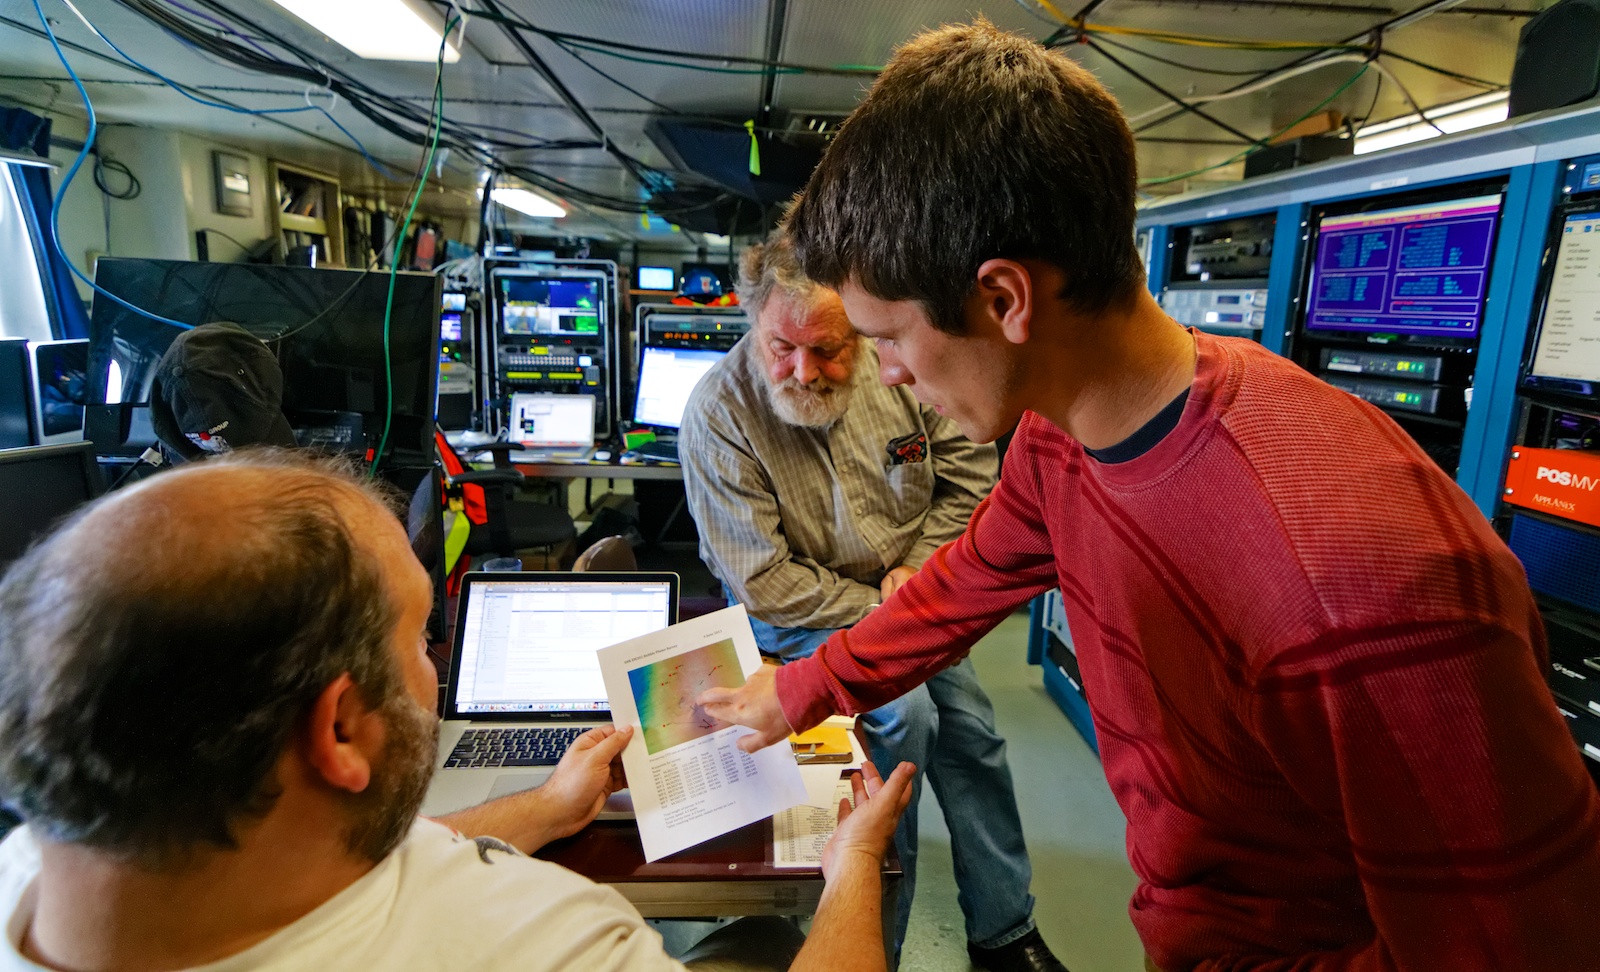
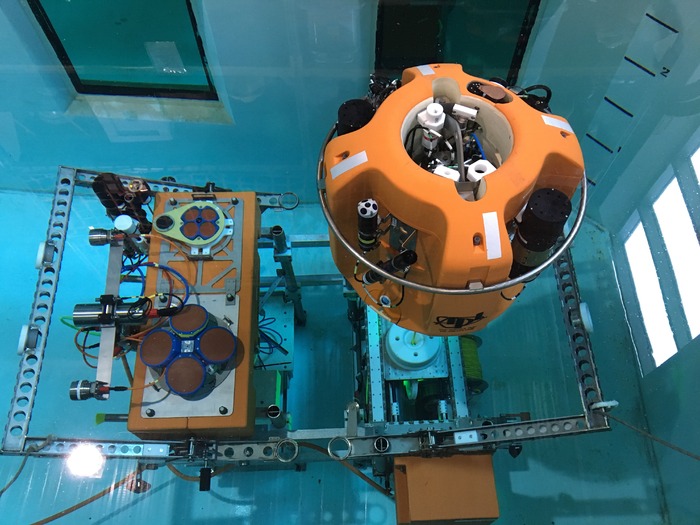
Four students from Queens College were aboard the R/V Marcus G Langseth for a recent ten-day research expedition to the Axial Seamount, a submarine volcano in the northeast Pacific Ocean that erupted in 1998, 2011, and 2015. The students were assisting a National Science Foundation Research team that is deploying autonomous ocean-bottom seismometers on OOI’s Regional Cabled Array as part of a two-year experiment taking place within the predicted time window of the next eruption.
The NSF-funded project is led by William Wilcock from the University of Washington and co-led by Felix Waldhauser, Columbia Climate School’s Lamont-Doherty Earth Observatory, who served as chief scientist on this expedition, Maya Tolstoy (UW), and Yen Joe Tan from the Chinese University of Hong Kong, who also was onboard.
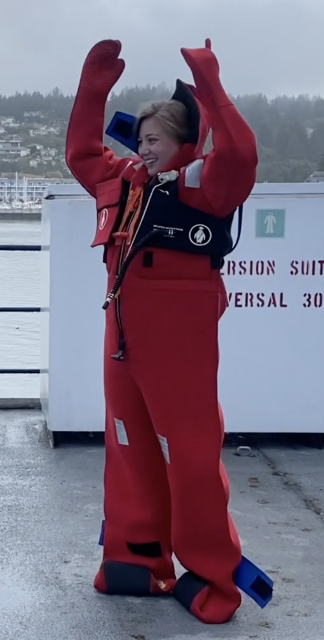
Queens college graduate student Jacqueline Singer was onboard to further work towards her master’s degree. She teamed up with undergraduates Rania Taib, Hema Muni, and Julia Sandke to create two videos – one explains their research, while the other provides an insider’s look at safety issues at sea. In the first video, the students give an in-depth look at how they deployed 15 autonomous ocean-bottom seismometers and how they work. In the second video, the students explain the importance of survival suit training, followed by a humorous look at the complex movements needed to successfully suit up in a “Gumby suit.”
Columbia University PhD candidate Theresa Sawi also provides a written account of the expedition here.
https://vimeo.com/user110037220/studentsataxialseamount
https://vimeo.com/user110037220/gumbysuitdemo
Read MoreCommunity Tools available on the OOI website to examine the Axial Volcano
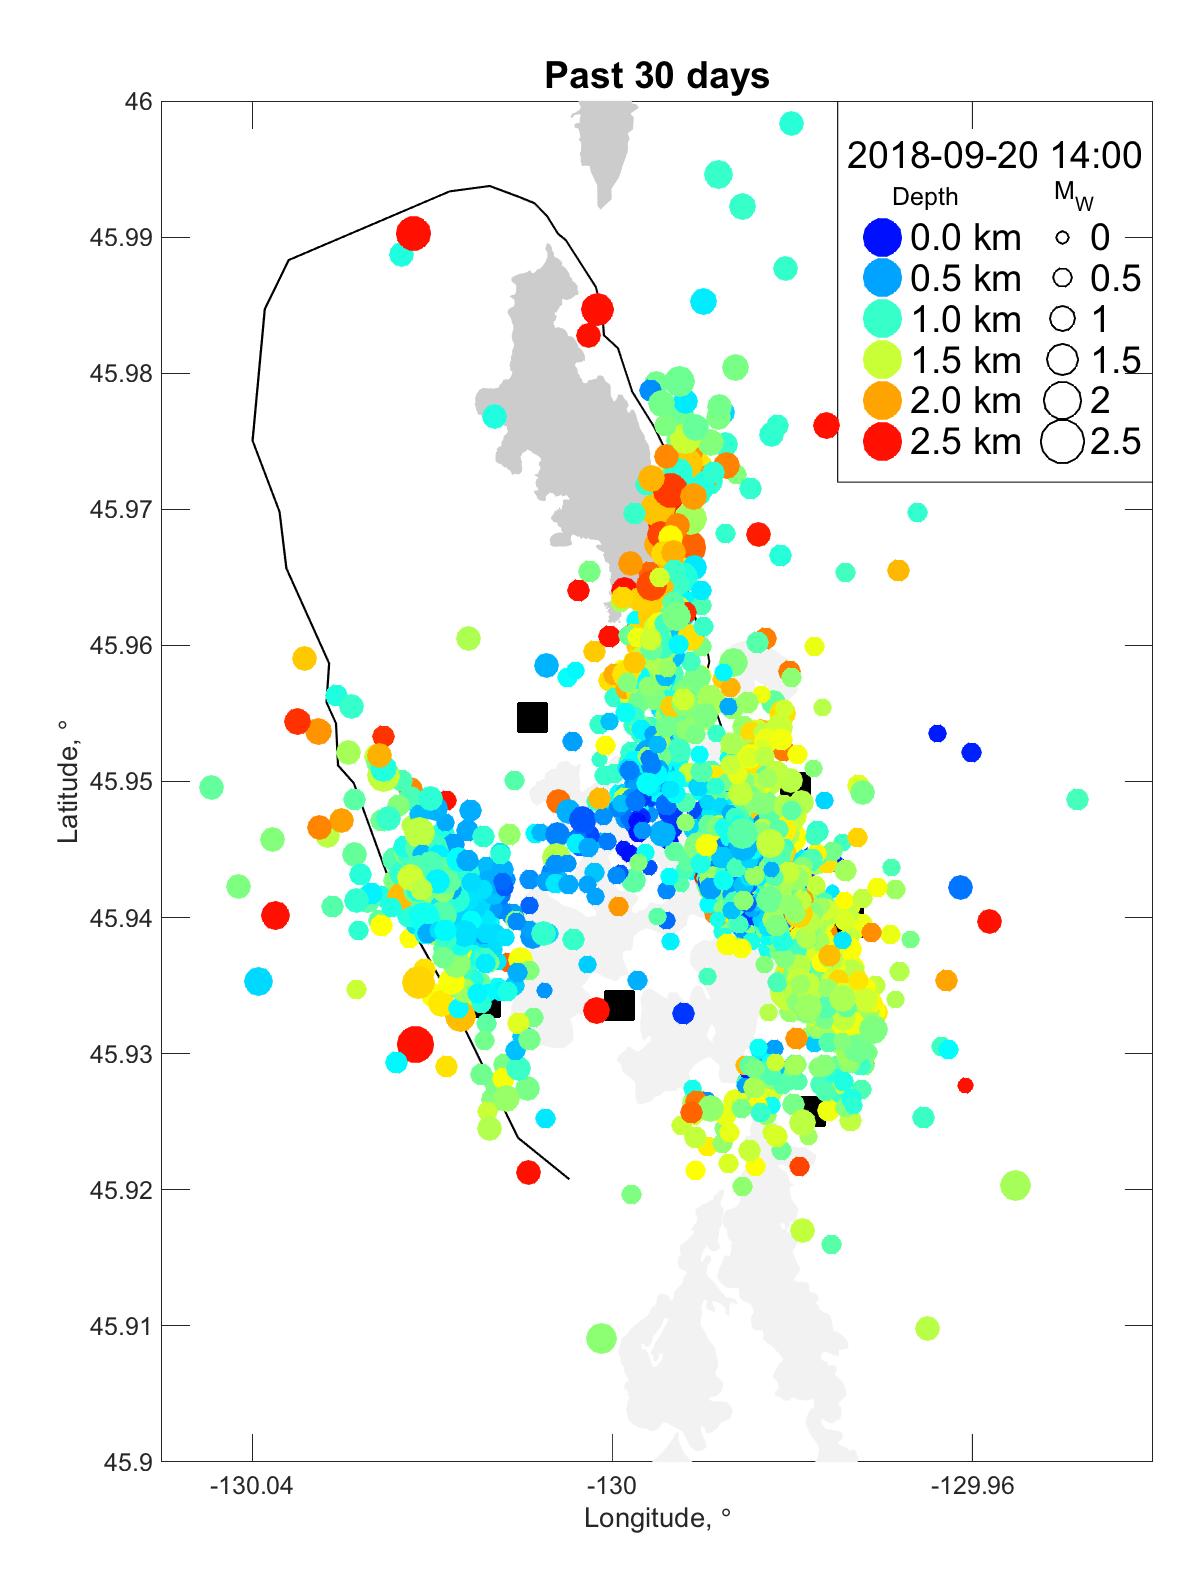
A suite of community generated tools are now available to explore the Axial Seamount. These include a new Inflation Threshold Forecast web page created by Dr. Chadwick (Oregon State University and NOAA/PMEL) and Andy Lau (Oregon State University/CIMRS) and the Axial Seamount Earthquake Catalog created by Dr. William Wilcock (University of Washington).
Read MoreEarly Career Highlight – Haley Cabaniss – Studying Oceans and Volcanos in America’s Breadbasket
“The thing that makes oceanography accessible in Illinois and any place inland,” says Cabaniss, “is that we have these awesome datasets like the OOI. Anyone anywhere in the world can go online, grab these datasets and start playing with them.”
Read MoreEarly Career Highlight – Dax Soule – Using the OOI to Build Paths for Success in His Students and His Research
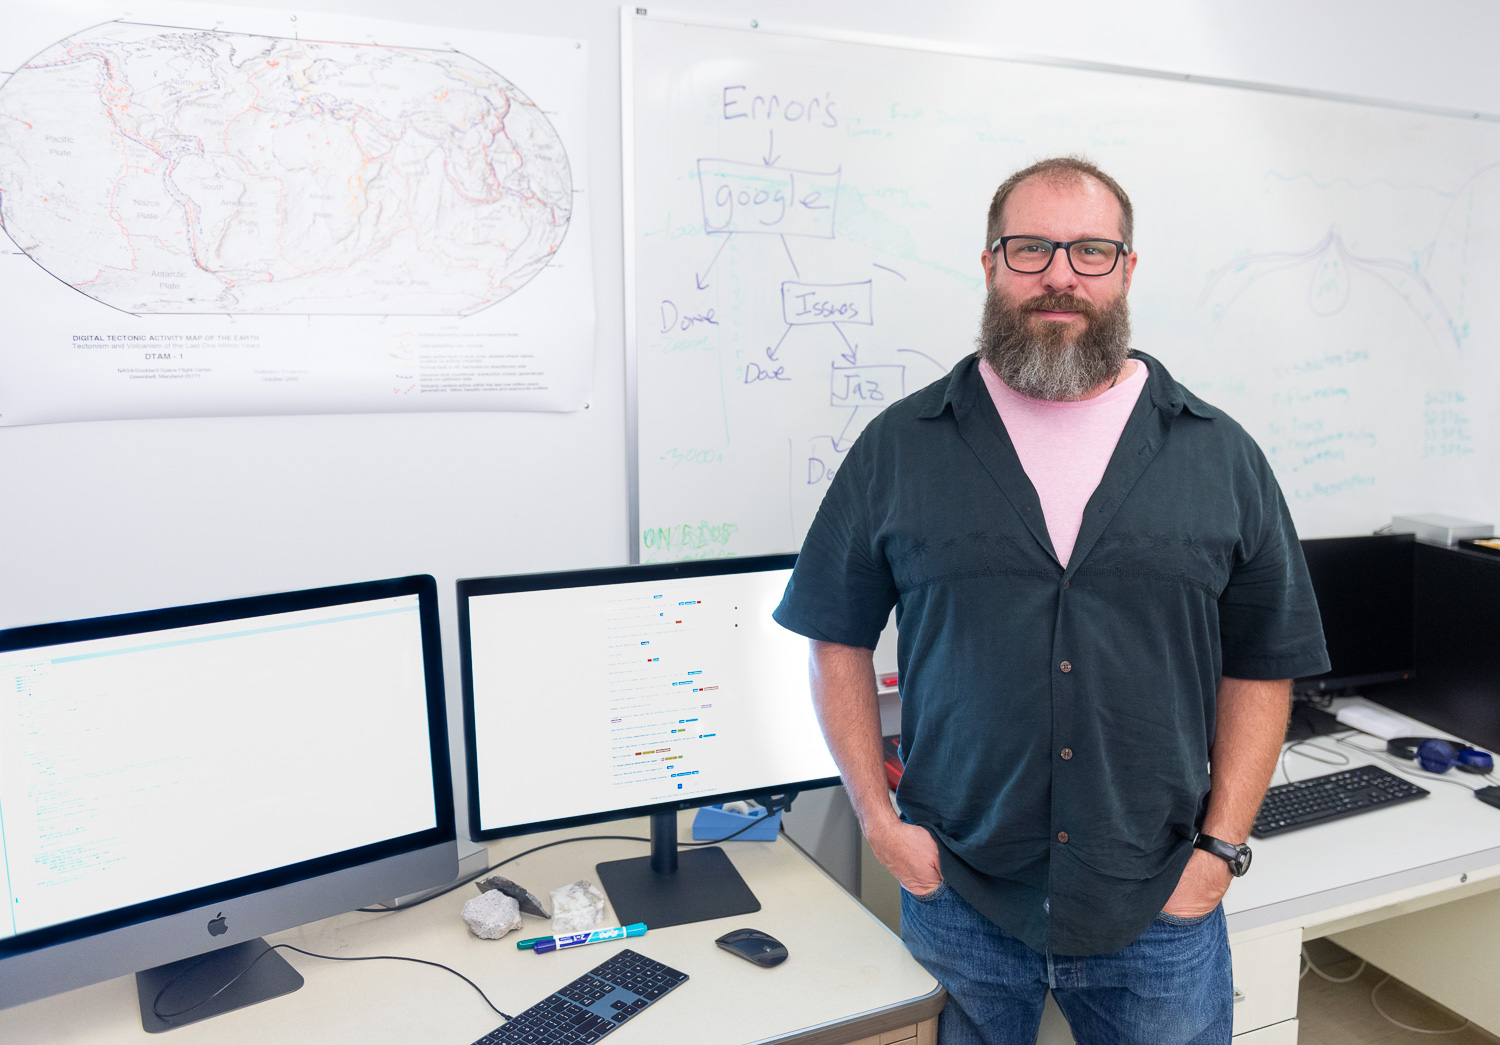
The OOI is like a fire hose with data pouring out,” says Soule. “It’s just there, regardless of whether anyone is using it. If you are brave enough to lean in and just take a sip, just grab a tiny fraction of that data, well that’s enough for a research project right there.”
Read MoreEarly Career Highlight – Wu-Jung Lee’s journey into ocean sound from dolphins to bats and back to the sea

“One of the reasons I first got interested in the OOI data was because it is free and available to the public,” says Lee. “Once I started working with the data, I realized just how special it was. I spent all of my time for several months on the OOI echosounder data.”
Read MoreEarly Career Highlight – Brendan Philip – From a life on the sea surface to exploration of the seafloor
“It’s a 25-year program and you have committed to sailing every year to service your arrays,” says Philip, “that is a tremendous opportunity for students and researchers on board to do research that leverages the OOI instrumentation. The OOI is more than just data streaming to shore, it is also about the additional science you can do while you are out there.”
Read MoreVisions 18 Cruise Underway
On June 19th, the R/V Roger Revelle departed Newport, OR to begin VISIONS’18, a 47-day expedition to replace and maintain elements of the Cabled Array off the coasts of Oregon and Washington as well as to add some novel sensors.
Read MoreThe Economist – Gliders on the storm

(From The Economist / Technology Quarterly)
From sharks to ice shelves, monsoons to volcanoes, the scope of ocean monitoring is widening.
IN NOVEMBER 2016 a large crack appeared in the Larsen C ice shelf off Antarctica (pictured). By July 2017 a chunk a quarter of the size of Wales, weighing one trillion tonnes, broke off from the main body of the shelf and started drifting away into the Southern Ocean. The shelf is already floating, so even such a large iceberg detaching itself did not affect sea levels. But Larsen C buttresses a much larger mass of ice that sits upon the Antarctic continent. If it breaks up completely, as its two smaller siblings (Larsens A and B) have done over the past 20 years, that ice on shore could flow much more easily into the ocean. If it did so—and scientists believe it would—that ice alone could account for 10cm of sea-level rise, more than half of the total rise seen in the 20th century.
The dynamics of the process, known as calving, that causes a shelf to break up are obscure. That, however, may soon change. Ocean Infinity, a marine-survey firm based in Texas, is due to send two autonomous drones under the Larsen C shelf in 2019, the first subglacial survey of its kind. “It is probably the least accessible and least explored area on the globe,” says Julian Dowdeswell, a glaciologist at the University of Cambridge who will lead the scientific side of the project.
The drones set to explore Larsen C look like 6-metre orange cigars and are made by Kongsberg—the same Norwegian firm that runs the new open-ocean fish farms. Called Hugin, after one of the ravens who flew around the world gathering information for Odin, a Norse god, the drones are designed to cruise precisely planned routes to investigate specific objects people already know about, such as oil pipelines, or to find things that they care about, such as missing planes. With lithium-ion-battery systems about as big as those found in a Tesla saloon the drones can travel at four knots for 60 hours on a charge, which gives them a range of about 400km. Their sensors will measure how the temperature of the water varies. Their sonar—which in this case, unusually, looks upwards—will measure the roughness of the bottom of the ice. Both variables are crucial in assessing how fast the ice shelf is breaking up, says Dr Dowdeswell.
The ability to see bits of the ocean, and things which it contains, that were previously invisible does not just matter to miners and submariners. It matters to scientists, environmentalists and fisheries managers. It helps them understand the changing Earth, predict the weather—including its dangerous extremes—and maintain fish stocks and protect other wildlife. Drones of all shapes and sizes are hoping to provide far more such information than has ever been available before.
That’s why it’s hotter under the water
To this end Amala Mahadevan of Woods Hole Oceanographic Institute (WHOI) in Massachusetts, has been working with the Indian weather agencies to install a string of sensors hanging down off a buoy in the northern end of the Bay of Bengal.
A large bank of similar buoys called the Pioneer Array has been showing oceanographers things they have not seen before in the two years it has been operating off the coast of New England. The array is part of the Ocean Observatories Initiative (OOI) funded by America’s National Science Foundation. It is providing a three-dimensional picture of changes to the Gulf Stream, which is pushing as much as 100km closer to the shore than it used to. “Fishermen are catching Gulf Stream fish 100km in from the continental shelf,” says Glen Gawarkiewicz of WHOI. These data make local weather forecasting better.
Three other lines of buoys and floats have recently been installed across the Atlantic in order to understand the transfer of deep water from the North Atlantic southwards, a flow which is fundamental to the dynamics of all the world’s oceans, and which may falter in a warmer climate.
Another part of the OOI is the Cabled Array off the coast of Oregon. Its sensors, which span one of the smallest of the world’s tectonic plates, the Juan de Fuca plate, are connected by 900km of fibre-optic cable and powered by electricity cables that run out from the shore. The array is designed to gather data which will help understand the connections between the plate’s volcanic activity and the biological and oceanographic processes above it.
A set of sensors off Japan takes a much more practical interest in plate tectonics. The Dense Oceanfloor Network System for Earthquakes and Tsunamis (DONET) consists of over 50 sea-floor observing stations, each housing pressure sensors which show whether the sea floor is rising or falling, as well as seismometers which measure the direct movement caused by an earthquake. When the plates shift and the sea floor trembles, they can send signals racing back to shore at the speed of light in glass, beating the slower progress of the seismic waves through the Earth’s crust, to give people a few valuable extra seconds of warning. Better measuring of climate can save lives over decades; prompt measurement of earthquakes can save them in an instant.
Read MoreCabled Array Staff Consultation – Dec 2017
Cabled Array staff will provide an overview of the Cabled Array infrastructure currently deployed as well as engineering specifics including connectors, communication capabilities, testing procedures, and general timeline. The goal of the webinar is to provide researchers interested in adding instrumentation-infrastructure onto the Cabled Array the information required to submit an NSF proposal, which includes a letter from the Cabled Array team on technical feasibility. Awards have been made for addition of infrastructure onto the Cabled Array from NSF, ONR, and International collaborators.
[button link="/staff-consultations/staff-consultations-cabled-array/" bg_color="#004477" window="yes"]View Recording[/button] Read MoreVisions 17 Cruise Underway
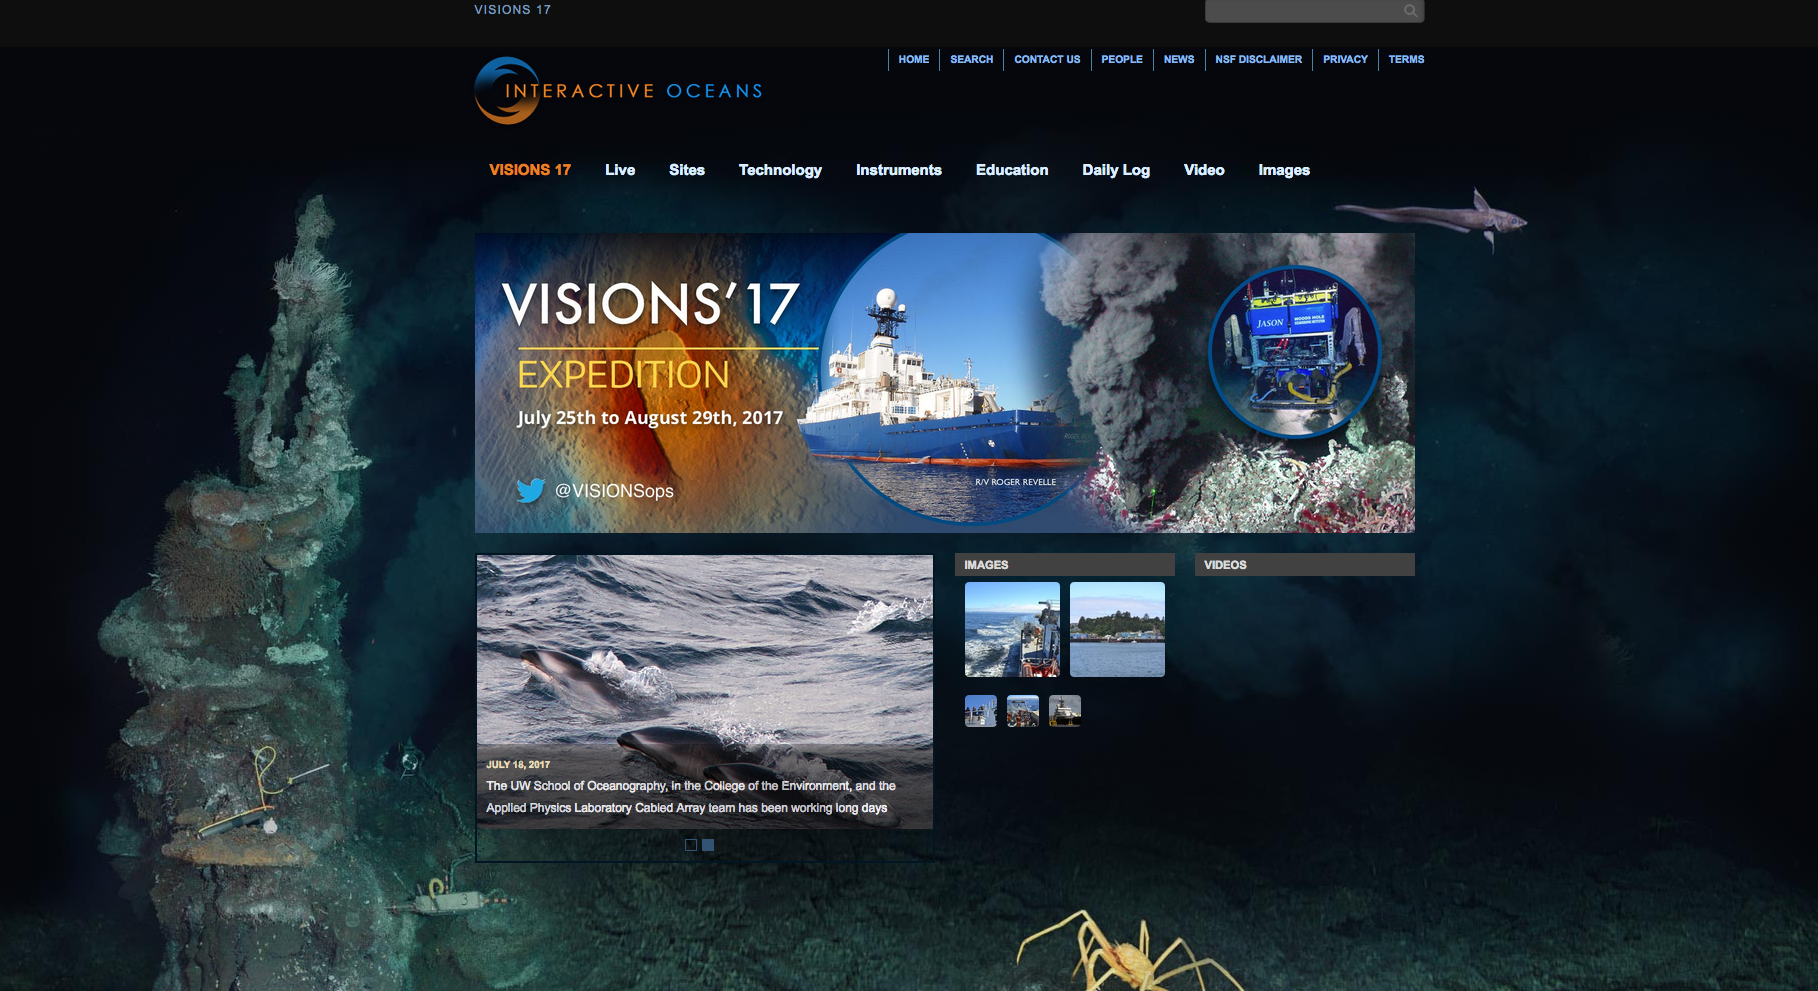
On July 27, the R/V Roger Revelle departed Newport, OR to begin VISIONS’17, a 32-day mission to replace and maintain elements of the Cabled Array off the coasts of Oregon and Washington.
Read More