
Posts Tagged ‘Coastal Endurance Array’
Eighteenth Turn of the Coastal Endurance Array
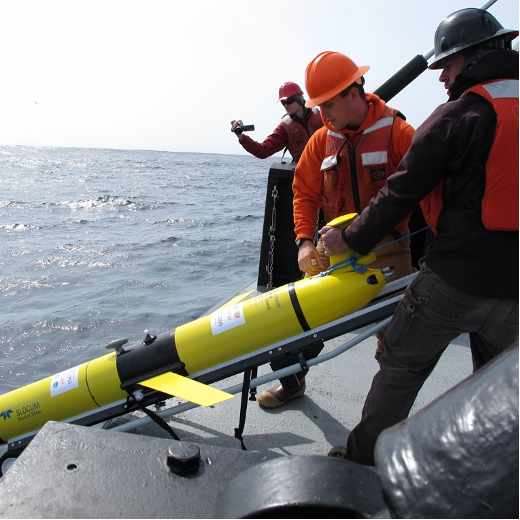
On Tuesday March 7th, 11 hearty scientists and engineers from Oregon State University (OSU) are heading out to the northeast Pacific aboard the R/V Sikuliaq to recover and deploy (turn) the Coastal Endurance Array. For some of the team members, this will be the eighteenth time they have made this journey to ensure that the Coastal Endurance Array continues to report data from this important region.
The array is in an important region with coastal upwelling, where strong winds cause surface waters to be pushed offshore and water from the ocean depths is pulled up – or upwelled – to the surface to take its place. These regions comprise less than 5 percent of the ocean’s surface area, yet account for a quarter of the global fish catch. The Endurance Array has been collecting data in this region since 2016, which scientists have used to examine ocean health issues, including hypoxia, ocean acidification, and how they affect ocean life.
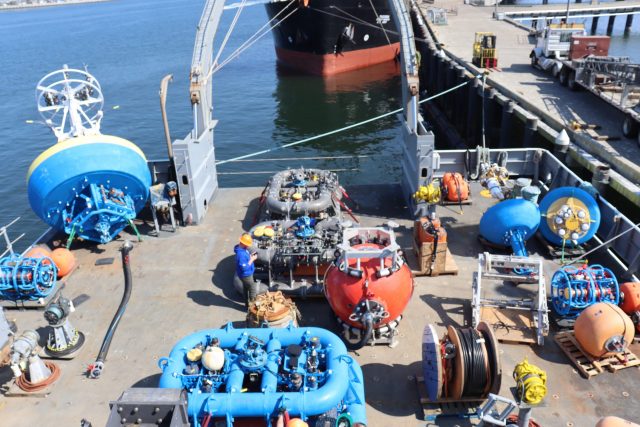
[media-caption path="https://oceanobservatories.org/wp-content/uploads/2023/03/IMG_6460-scaled.jpg" link="#"]The Endurance 18 will be deploying seven moorings, six gliders, and four coastal surface piercing profilers, which requires the expedition to be conducted in two legs because of space limitations on the stern. Credit: Darlene Trew Crist ©WHOI.[/media-caption]The Endurance team will be very busy during their 16-day expedition. Because of the size of the equipment, the expedition will occur in two legs so recovered equipment can be brought back to shore and replaced with equipment to be deployed. They intend to recover and deploy seven moorings and recover two gliders, while deploying a full contingent of six gliders. Three gliders will “fly” at shallow depths of 200 meters across the shelf. Another three will travel at 1000 meters depth offshore. Weather and seas permitting, the team also plans to deploy four coastal surface piercing profilers.
The team will also be conducting water sampling before and after each deployment. They will conduct CTD (conductivity, temperature, and depth) casts at the deployment/recovery sites and carry out shipboard sampling for field validation of the platforms and sensors that will remain in the water for the next six months.
Chief Scientist, Jonathan Fram, who will lead both legs of the expedition, said, “Endurance 18 is happening earlier than our usual spring expeditions, which means we are likely to face rough seas. We have a highly experienced team, the ship has an exceptional crew, and we’ll be on a weather-hardened ship, so we will be able to make the most of our time at sea. Platforms that can be deployed from a smaller vessel may be deferred to spring if there are long weather delays on this end-of-winter expedition.”
The team had already experienced some unexpected weather as a freak snowstorm covered the ocean observing equipment in the storage area in Corvallis. The team had to “clean off the cars,” so to speak, before loading the equipment onto trucks for transport to the dock in Newport, for loading on the ship.
[media-caption path="https://oceanobservatories.org/wp-content/uploads/2023/03/Screen-Shot-2023-03-06-at-10.04.08-AM.png" link="#"]A few days before ocean observing equipment in Corvallis was set to be transported to the dock in Newport for loading onto the R/V Sikuliaq, an unexpected snowstorm made its way to Corvallis, covering the equipment in white. Credit: Jon Fram, OSU.[/media-caption]In addition to OOI’s recovery and deployment operations, during leg two, University of South Carolina researcher Eric Tappa, will lead the recovery and deployment of a sediment trap adjacent to OOI’s Oregon Slope Base site. “This is an example of how OOI tries to maximize ship time by partnering with scientists and other partners and institutions to make full use of the time at sea. We are always open to discussing ways we might advance other scientific objectives,” added Fram. (See How to Participate for more information.)
[media-caption path="https://oceanobservatories.org/wp-content/uploads/2023/03/Screen-Shot-2023-03-06-at-10.06.37-AM.png" link="#"]One technical improvement that will be deployed during Endurance 18 is a new steel frame over the solar polars to prevent damage caused by frequent sea lion visitors. This is one of many incremental technical improvements that are made to OOI arrays to optimize their operations while at sea. Credit: Jon Fram, OSU.[/media-caption]During the expedition, two University-National Oceanographic Laboratory System (UNOLS) cruise volunteers will be onboard as well as two OSU undergraduates who are employed by OOI to help with the refurbishment of moorings. An OSU videographer will also be onboard to share the ongoing work. Bookmark this site and follow along on the journey.
Read More
Visit to West Coast OOI Facilities
A group of Ocean Observatories Initiative (OOI) leaders visited OOI facilities at Oregon State University and the University of Washington last week to get a first-hand look at operations of the Coastal Endurance Array and Regional Cabled Array, respectively. National Science Foundation Program Director George Voulgaris, OOI Principal Investigator Jim Edson and Senior Program Manager Paul Matthias spent five days on the road meeting with their OOI west coast colleagues. The trip was designed to give recently appointed Voulgaris an opportunity to inspect the infrastructure and meet team members who keep the Coastal Endurance and Regional Cabled Arrays operational and reporting back data around the clock. Edson and Matthias seized the opportunity to meet in person with colleagues who they routinely see on the screen.
The following provides a glimpse of some of the activities that occurred during the trip:
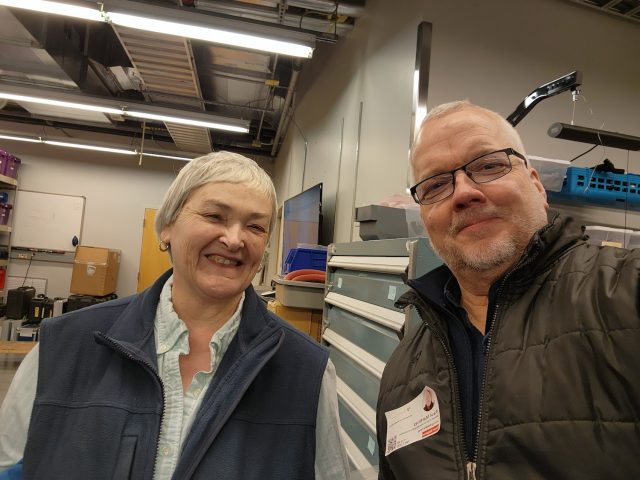
[media-caption path="https://oceanobservatories.org/wp-content/uploads/2023/02/20230207_140014.jpg" link="#"]Grant Dunn, Mechanical Engineer with the Electronic & Photonic Systems Department at UW-APL (left) describes the level-wind system on the RCA profiler mooring to Dr. George Voulgaris during a tour of the RCA laboratory facilities at the University of Washington as RCA Project Manager Brian Ittig looks on. Credit: Paul K. Matthias © WHOI.[/media-caption] [media-caption path="https://oceanobservatories.org/wp-content/uploads/2023/02/20230207_144911.jpg" link="#"]Regional Cabled Array Principal Investigator Deborah Kelley (left) and OOI Senior Program Manager Paul Matthias take a selfie to commemorate their in-person visit during a tour of the RCA facilities at the University of Washington. Credit: Paul K. Matthias © WHOI.[/media-caption] [media-caption path="https://oceanobservatories.org/wp-content/uploads/2023/02/20230207_141656.jpg" link="#"]NSF Program Director George Voulgaris (from left), OOI Principal Investigator Jim Edson look on as Regional Cabled Array technicians Grant Dunn, Mechanical Engineer with the Electronic & Photonic Systems Department at UW-APL, and RCA Chief Engineer Chuck McGuire explain the engineering associated with the RCA profiler mooring during a tour of RCA’s facilities at the University of Washington. Credit: Paul K. Matthias © WHOI.[/media-caption] [media-caption path="https://oceanobservatories.org/wp-content/uploads/2023/02/20230209_123758.jpg" link="#"]NSF Program Director George Voulgaris (left) asks OSU technician Jonathan Whitefield questions about glider operations that provide critical water column data around the moorings of the Coastal Endurance Array. Credit: Paul K. Matthias © WHOI.[/media-caption] [media-caption path="https://oceanobservatories.org/wp-content/uploads/2023/02/20230207_112718.jpg" link="#"]NSF Program Director George Voulgaris (foreground) and RCA Chief Engineer Chuck McGuire discuss the RCA data monitoring systems as OOI PI Jim Edson points to real-time data on the screen being relayed by instrumentation on the Regional Cabled Array. Credit: Paul K. Matthias © WHOI.[/media-caption] [media-caption path="https://oceanobservatories.org/wp-content/uploads/2023/02/20230209_130353.jpg" link="#"]NSF Program Director George Voulgaris (left) gets a hands-on look at the multiple instruments contained on multi-function node that will sit on the bottom of the ocean floor for six months collecting data for the Coastal Endurance Array. Coastal Endurance Array Principal Investigator Ed Dever (middle) and Project Manager Jonathan Fram the functionality of each instrument during the visit to Oregon State University. Credit: Paul K. Matthias © WHOI.[/media-caption]
Read More
Slope and Shelf Flow Anomalies Off Oregon
Slope and Shelf Flow Anomalies Off Oregon Influenced by the El Niño Remote Oceanic Mechanism in 2014–2016
Adapted and condensed by OOI from Kurapov et al., 2022, doi.org/10.1029/2022JC018604.
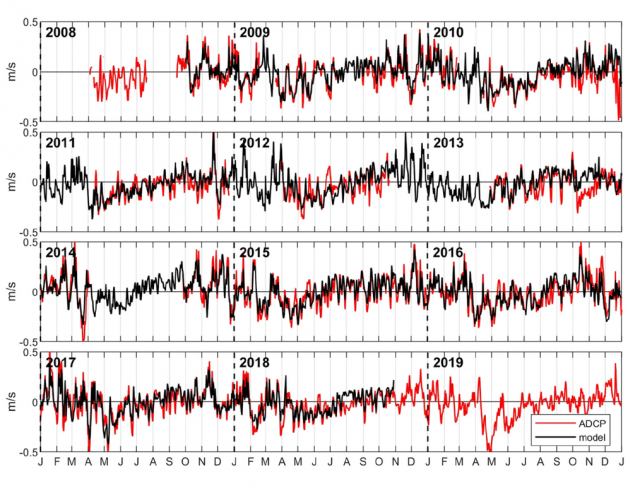
[media-caption path="/wp-content/uploads/2023/01/Endurance-science-highlight-fixed.png" link="#"]Time series of the daily averaged meridional current component at the Oregon shelf location, averaged in the vertical between 60 and 70 m below the surface: (red) ADCP data and (black) model. Data from before 2015 come from various moorings maintained at the NH-10 site. Data after 2015 come from the OOI Oregon shelf site. The model reproduces the observed variability over the entire 10-year period very well, except for episodes in Dec 2010 and Oct 2013. Overall, no systematic biases or trends are found. See Fig. 7 Kurapov et al. (2022).[/media-caption]Kurapov et al. analyze outputs of a regional ocean circulation model to demonstrate the measurable impact of the El Niño remote oceanic forcing mechanism along the US West Coast during the major heat wave period of 2014–2016. The 2-km horizontal resolution model, based on the Regional Ocean Modeling System (ROMS), was run for the period of 2009–2018. Though the model does not assimilate observations, it performs well by comparison with time series data (including OOI data, Figure above) explaining observed variability on temporal scales from several days to seasonal and interannual.
The El Niño-related oceanic anomalies provided by a global state estimate are introduced in the regional model at the southern boundary at 24N. These propagate alongshore with coastally trapped waves (CTWs) and influence the variability off Oregon (41°–46°N). In particular, CTWs are evident in the subsurface along-slope current, vs, and in the depth of the 26.5 kg m3 isopycnal surface over the slope, z26.5. In summer 2014 and 2015, vs anomalies are positive (northward) and z26.5 anomalies are negative (deeper) along the US West Coast. In addition to the CTW patterns, z26.5 anomalies also exhibit slow-moving features associated with undercurrent widening, separation, and subsurface eddy variability. Over the Oregon shelf, El Niño conditions contributed to the sharp weakening of the southward alongshore current throughout the water column in July 2014 and 2015, despite the near-average southward, upwelling-favorable winds.
Kurapov, A. L., Rudnick, D. L., Cervantes, B. T., & Risien, C. M. (2022). Slope and shelf flow anomalies off Oregon influenced by the El Niño remote oceanic mechanism in 2014–2016. J. Geophys. Res.: Oceans, 127, e2022JC018604. doi.org/10.1029/2022JC018604.
Read MoreAlex Wick: Conducting Sea-going Operations
OOI Coastal Endurance Array Deck Lead Alex Wick has been working on ships for more than a decade. He is a classic example of learning the ropes from the bottom up. After receiving a degree in marine biology from the University of Santa Cruz, he took some scuba diving lessons, but really didn’t know what he wanted to do.
Wick started his journey aboard ships in 2012 sorting tools for a marine technician onboard the R/V Point Sur, out of Moss Landing, California. When offered the job, he had no idea what he was getting into. He showed up in shorts, street shoes, with no personal protective gear (PPE) at all, and no at-sea experience.
But he learned quickly and advanced from sorting sockets to needle-gunning the deck, which involves removing all of the old paint with a needle gun before applying a new coat of paint. This activity was when Wick was given his first set of PPE – safety glasses, knee pads, hard hat, and gloves – which gave him a real understanding of their importance during five days of back-breaking work.
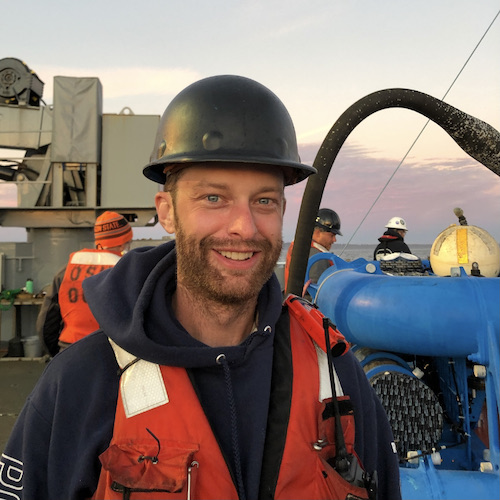
[media-caption path="/wp-content/uploads/2023/01/Alex.jpeg" link="#"]Alex Wick has been deck lead for Endurance Operations since 2018. Credit: Darlene Trew Crist ©WHOI.[/media-caption]
Wick started repainting the deck of the boat. The captain, at the time, recognized Wick’s work ethic and dedication and continued to expose him to shipboard duties. From one cruise as a deck hand, he advanced to an 84-day expedition to Antarctica. He jokes that at the time he didn’t even know how to use a ratchet strap, which is widely used to secure heavy equipment on ships and elsewhere.
“The captain told me to secure a small boat under the A-frame,” said Wick. “I had no idea how to do, but figured it out. With one day of oceanographic experience under my belt, I was off to Antarctica.” As it turned out, it was the best possible hands-on learning experience for Wick, which ultimately led to him spending about 500 days at sea and his role with the Endurance Array team today.
“There was nothing like driving a boat in Antarctica with a guy with a crossbow on the bow of the boat directing me around chasing Minke whales,” added Wick. “We would come up alongside one of them, shoot a crossbow bolt into its dorsal fin to retrieve a bio-sample. I thought it was the coolest thing ever.”
This Antarctica expedition provided Wick with the foundational knowledge he now uses aboard the R/V Thomas G. Thompson during bi-annual recovery and deployment expeditions for the Coastal Endurance Array. His time on the Point Sur taught him how to run winches, use the A and J frames, which support the lifting of heavy equipment in and out of the ocean, and most importantly, how to work on a ship in a safe manner.
After Antarctica, Wick spent six years as a deck hand and marine technician, where he developed an innate understanding of how all the pieces move on deck. Jonathan Fram, who often serves as chief scientist for the Endurance expeditions likens Wick to a symphony conductor. “He directs the operations while always having an eye on each member of the ‘orchestra’ and what they should be doing at certain times. This orchestration is critical to getting the heavy equipment we deal with on and off board without incident.”
Wick moved to Oregon State University when his wife was accepted into a PhD program there. He was hired on as a marine technician on the R/V Oceanus, where he sailed for up to 100 days a year. But, a man of many interests, Wick grew tired of being away from home for such long stretches. He missed his family, mountain bike, fishing, and other activities afforded by living in Oregon. He applied for the job as deck lead with the Endurance Array team and has been on the job since December 2018.
His first trip to the dock in Newport after a fall Endurance expedition, where he saw the massive amount of equipment moved on and off the ship and in and out of the water, provided Wick with his leadership philosophy.
“I think that the person running the deck should be basically completely hands off. That way, we are able to actually observe everything and see the bigger picture of what’s happening,” said Wick. “As we’re doing recoveries or deployments, I’m always thinking of the next pieces of the puzzle. I want the folks on the back deck and on the bridge to know what to expect, so everyone knows what’s ahead and can plan for what they’re going to be doing.”
From the seeds of his earliest experience aboard the R/V Point Sur, Wick is totally committed to overseeing a safe operation. “The deck lead is responsible for everyone’s safety and making sure we’re doing things appropriately,” he explained. “Sure unexpected things can happen, but back deck operations can and should be done safely. I feel a great responsibility for making sure that everybody comes back with all their digits and we all return to shore having successfully completed the job and return to our family and friends.”
Wick’s favorite part of the job is working with the team. He joked, “We are all part of the communal suffering. Doing the same thing together. We have a lot of big toys that we get to play with safely. And, it really is special at sea. It’s cool to see the whales breaching, the dolphins racing the ship, the bioluminescence, and skies filled with stars. No matter how crusty and jaded we might be, it takes a team to put these moorings in the water, and deep down, I think we all really enjoy doing this.”
Wick has served as deck lead for six Endurance expeditions and has overseen the movement, deployment and recovery of 270 tons of scientific equipment. Not a bad record for a kid who started out sorting tools.
[media-caption path="/wp-content/uploads/2023/01/Alex-2.jpeg" link="#"]Wick choreographs the recovery and deployment of the Endurance Array moorings. Credit: Darlene Trew Crist ©WHOI. [/media-caption]
Read More
Improving Reliability and Availability of Dissolved Oxygen Glider Data
OOI’s Coastal Endurance Array Team is making great strides in ensuring the accuracy of glider dissolved oxygen measurements and making these data readily available to researchers. The team has compared glider oxygen data with independent transects and climatologies compiled by west coast colleagues. They are increasing the number of in situ comparisons of glider oxygen data with bottle samples taken in proximity to the gliders. They have built a benchtop system to do two-point calibrations for oxygen sensors to help ensure their accuracy when the gliders are in the water. And, working with OOI colleagues at WHOI, the team is helping to design and test improved sensor mounts to perform in situ air calibrations of glider oxygen measurements.
“A couple of years ago, Endurance Glider Lead Stuart Pearce developed code to put all of the oxygen data collected by our glider fleet into the DAC, the national central database for glider data,” said Ed Dever, Principal Investigator of the Coastal Endurance Array and Professor at Oregon State University. “Prior to doing this, Stuart examined the data and metadata for any gross errors and issues. That was the first of many steps we have taken to ensure OOI oxygen data are reliable and available so they can be trusted and used by researchers. Our effort is paying off. The glider data available on the DAC are identical to that now available on OOI’s Data Explorer. Endurance glider lines off Newport, OR and Grays Harbor, WA will be the backbone for the northern Californian Current part of the nascent Boundary Ocean Observing Network. The OOI glider lines map seasonal development of hypoxic areas off Oregon and Washington from the coast to the edge of the continental shelf.”
[media-caption path="/wp-content/uploads/2022/11/glider.png" link="#"]More than 137 glider missions have occurred along the Newport and Grays Harbor lines since 2014. Credit: Coastal Endurance Array at OSU.[/media-caption]
Collaborations
Enough oxygen data has been collected and shared in the northeast Pacific that is now possible to make high resolution regional climatologies of temperature, salinity and oxygen. Risien et al. (2022) compiled ~20 years of data taken by Jennifer Fisher (NOAA) and many others, to develop analysis ready transects of water property data off Newport, Oregon. These datasets include both climatologies and individual interpolated, quality-controlled, transect data. The Endurance Team compared glider dissolved oxygen with shipboard CTD samples collected by Fisher along the Newport transect in July 2021. Oxygen measurements from the gliders and CTDs samples compared well and provided confidence that glider and shipboard transects can map hypoxic conditions at comparable resolution and accuracy. Added Dever, “We were able to do a side-by-side comparison of the temperature, salinity, and oxygen data collected by the gliders over our Newport hydrographic line with the CTD data sampled by the Fisher’s team using the R/V Elakha. The comparison was quite good and served to validate the quality of the glider data that are an integral part of the Endurance Array.”
Engineering Solutions
A couple years ago, team member Jonathan Whitefield worked with Scripps Institution for Oceanography to build an oxygen Winkler titration rig so the team can titrate its own oxygen samples. The system can be used both in the lab and onboard to validate glider and moored oxygen data. The titration rig has been used to increase the number bottle samples taken during glider deployments and recoveries and to reduce the time between sample acquisition and analysis.
Building on this, Whitefield and others recently assembled in-house two-point calibration baths for pre- and post deployment of oxygen data collected by gliders and moorings. Calibrations are performed at anoxic and near-saturated conditions. The two-point calibration system is based on a similar one used at Scripps Institution for Oceanography (López-García, P., et al., 2022). A sodium sulfite solution is injected into bottle samples to get the low endpoint oxygen calibration point. The high endpoint oxygen calibration point is achieved using a stirred bath at 10°C to get to near saturation. The high endpoint oxygen is measured with replicate Winkler titrations. The calibration baths better ensure accuracy by making it possible to perform routine in-house checks of vendor calibrations on glider and moored sensors as well as identify calibration drift after deployment.
What’s ahead
Oxygen data are reviewed weekly by operators and annotated. Real-time automated quality control using QARTOD tests is in development. In-situ air calibration tests of oxygen optodes are planned for spring 2023. At the suggestion of outside investigators, OOI’s Coastal and Global Scale Node team at Woods Hole Oceanographic Institution modified Slocum glider optode mounts to allow in-situ air calibrations of dissolved oxygen on the Irminger Sea and Pioneer Arrays. The mount, however, affected the flow around gliders with radome fins and caused navigation problems. Modeling done at WHOI showed these problems may be due to vortices of the optode on the starboard side of the fin. The Endurance gliders will test a new mount placement during its upcoming bi-annual operations and maintenance cruise in March of 2023.
“We’re part of the community of practice for glider oxygen calibration and validation,” said Dever. “We engage with colleagues, adopt standard practices and widely share data. This community of users will help all of us get a better handle on ongoing changes in our ocean regions.”
References
Risien et al. (2022) Spatially gridded cross-shelf hydrographic sections and monthly climatologies from shipboard survey data collected along the Newport Hydrographic Line, 1997–2021, https://doi.org/10.1016/j.dib.2022.107922
López-García, et al. (2022) Ocean Gliders Oxygen SOP, Version 1.0.0. Ocean Gliders, 55pp. DOI: http://dx.doi.org/10.25607/OBP-1756. (GitHub Repository, Ocean Gliders Oxygen SOP.
Read More
Particle Trajectories in an Eastern Boundary Current
Adapted and condensed by OOI from Wong-Ala et al., 2022, doi:/10.1016/j.jmarsys.2022.103757
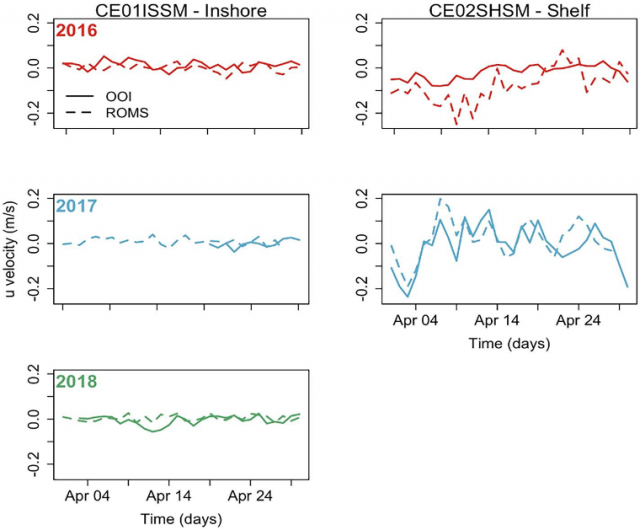
To study the transport and dispersal of marine organisms during spawning, Wong-Ala* et al. developed and applied a Lagrangian particle tracking (LPT) model to compare and contrast particle drift patterns during the spring transition off the Oregon coast. They studied the Oregon coast as it has distinct upwelling and downwelling regimes and variable shelf width. They contrasted years (2016–18) using Regional Ocean Modeling System (ROMS) with different horizontal spatial resolutions (2 km, 250 m). They found the finer spatial resolution model significantly increased retention along the Oregon coast. Particles in the 250 m ROMS were advected to depth at specific times and locations for each simulated year, coinciding with the location and timing of a strong and shallow alongshore undercurrent that is not present in the 2 km ROMS. Additionally, ageostrophic dynamics close to shore, in the bottom boundary layer, and around headlands not present in the coarser model emerged in the 250 m resolution model. They concluded that the higher horizontal model resolution and bathymetry generated well-resolved mesoscale and submesoscale features (e.g., surface, subsurface, and nearshore jet) that vary annually. These results have implications for modeling the dispersal, growth, and development of coastal organisms with dispersing early life stages.
[media-caption path="/wp-content/uploads/2022/11/Endurance-Highlight.png" link="#"]Figure 1: (Fig 9 from Wong-Ala et al. (2022). Comparison of u-velocity (zonal velocity) data between the 250 m ROMS and an inshore mooring and shelf mooring off the Oregon coast collecting data at seven meters depth. The panel is organized by year: 2016 (row 1), 2017 (row 2), 2018 (row 3), and location of data collection: inshore (column 1) and shelf (column 2). In April 2018, there are no data available from the shelf mooring ADCP.[/media-caption]The model applied by Wong-Ala assimilates satellite sea surface temperature and along-track altimetry. Model atmospheric forcing is from the NOAA North American Mesoscale Model (NAM). To validate their model, Wong-Ala et al., used OOI Endurance Array time series data from 2016 to 2018 from the Oregon inshore and shelf moorings (CE01ISSM and CE02SHSM). They compared available OOI zonal and meridional velocities, temperature, and salinity to model output of these parameters for the month of April in each year when they ran their model (Figure 1). They found the modeled currents and temperature from the 250 m ROMS model closely follow the observed data from inshore and shelf moorings compared to the 2 km ROMS. The 250 m ROMS modeled currents and observed currents at the inshore mooring are similar for all three years (Figure 1).
They also found that the 250 m ROMS modeled temperature and observed data are similar in 2017 at the inshore and shelf location. In April 2017 and 2018, the modeled temperature from the 250 m ROMS is about 1 °C cooler than the observed temperatures.
_____________________
*Wong-Ala is a PhD student at Oregon State University. She is a Pacific Islander.
Reference:A. T. K. Wong-Ala, Ciannelli, L., Durski, S. M., and Spitz, Y., Particle trajectories in an eastern boundary current using a regional ocean model at two horizontal resolutions, Journal of Marine Systems, vol. 233, p. 103757, 2022. https://doi.org/10.1016/j.jmarsys.2022.103757.
Read MoreSept 21 Noon Eastern: Live Ship-to-Shore Video from Endurance 17
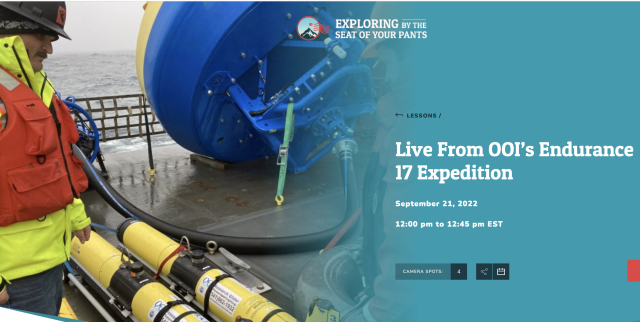
Mark your calendar to tune in to a rare opportunity to see live OOI action from the R/V Thomas G. Thompson: Wednesday September 21 at noon eastern. Exploring by the Seat of Your Pants will be interviewing Chief Scientist Jonathan Fram as he and his team get ready to depart on the 17th recovery and deployment expedition of the Coastal Endurance Array. It should be a fun and informative operation. Register here, then tune in.

Two Decades of Mooring and Ship-Based Observations from the Newport Hydrographic Line
C.M. Risien, M.R. Fewings, J.L. Fisher, B.T. Cervantes, C.A. Morgan, J.A. Barth, P.M. Kosro, J.O. Peterson, W.T. Peterson, and M.D. Levine
In the Northern California Current System (NCCS), during spring and summer months, equatorward winds drive the upwelling of cold, nutrient-rich, and oxygen-poor waters from depth onto the shelf, fueling a highly productive marine ecosystem that supports valuable commercial fisheries. Oceanographic conditions in the NCCS vary on temporal scales from hours to decades. In contrast, grant-funded research typically consists of shorter-term studies (3-5 years). While such studies resolve intra-annual and perhaps inter-annual variability, they do not capture decadal scale variability that is critical for climate studies.
Risien et al. (2022), present two new decadal-scale data products. The first is ~550 gridded, cross-shelf hydrographic sections of temperature, salinity, potential density, spiciness, and dissolved oxygen from data collected biweekly to monthly from March 1997 to present along the Newport Hydrographic Line (NHL; 44.6°N, 124.1–124.65°W) off Newport, Oregon, USA, mostly by NOAA programs. They also present monthly climatologies derived from these observations.
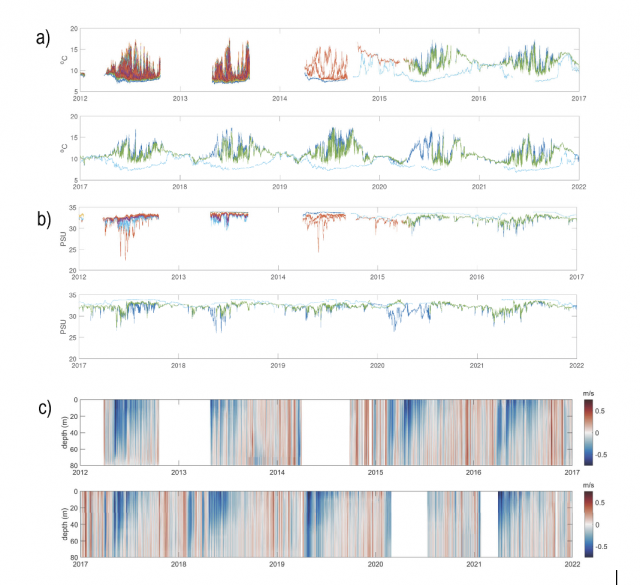
The second data product is 23 years (1999–2021) of mooring temperature, salinity and velocity data — collected by five programs (OSU-NOPP, GLOBEC, OrCOOS, NANOOS/CMOP, OOI) at NH-10 (44.6°N, 124.3°W), 10 nautical miles west of Newport, Oregon along the NHL — that they stitched together into one coherent, quality-controlled data set (see figure above).
Making available such multi-decadal data sets, which they plan to release via public repositories, is essential to enable scientists to characterize natural and anthropogenically-forced variability; resolve cause-and-effect relationships in Earth’s climate and marine ecosystems at intra-seasonal, seasonal, inter-annual and decadal time scales; and verify climate models. These new gridded and concatenated data products show that long-term ocean observing efforts require multi-generational teams with a wide range of skills and a shared vision that is motivated by science and ocean monitoring needs.
Read MoreR/V Oceanus Decommissioned and Celebrated
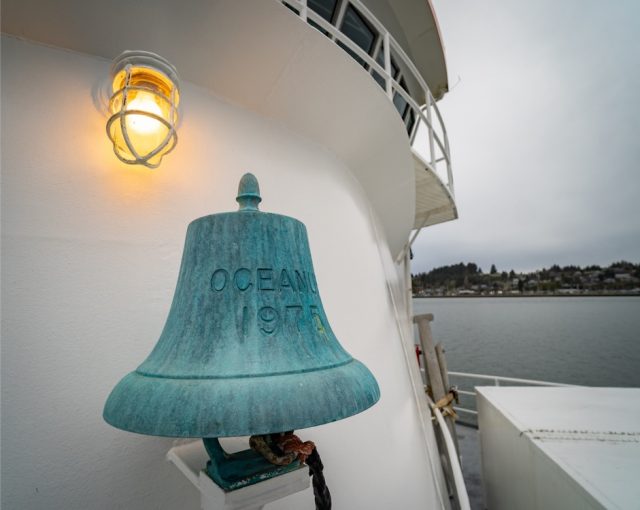
The R/V Oceanus was decommissioned last year, but its 45 years of service to the oceanographic community were celebrated at Oregon State University (OSU) at an event Friday May 6, 2022. The Coastal Endurance Array team used the Oceanus for many recovery and deployment expeditions before her retirement in 2021.
[media-caption path="/wp-content/uploads/2022/05/Picture1-copy.jpg" link="#"]The Oceanus was originally built in 1975 and began its work as a research vessel in 1976. Photo: OSU.[/media-caption]
[media-caption path="/wp-content/uploads/2022/05/graphics-OOI_AST2-DSC_5970.jpg" link="#"]R/V Oceanus departing WHOI on the deployment leg of OOI At-Sea Test 2 (AST-2) on September 22, 2011. Photo: Ken Kostel ©WHOI.[/media-caption]
Prior to its tenure at OSU, the Oceanus was in service at the Woods Hole Oceanographic Institution (WHOI) from 1976-2012. WHOI retired the ship and it was transferred to OSU in 2012. While at WHOI, the ship was used in early test deployments of equipment being evaluated for use in OOI arrays.
“The R/V Oceanus and its sister ship R/V Wecoma remain my favorite research vessels for air-sea interaction research due to their moderate size, uncluttered bows, and streamlined shapes,” said Jim Edson, Principal Investigator of the Ocean Observatories Initiative (OOI). “Research cruises on these vessels led to the development of the direct covariance systems we are using on the OOI surface moorings today.”
The Oceanus will be replaced with a new modern research vessel, the R/V Taani, which is expected to be delivered next year.
The Oceanus’ service in the Pacific is celebrated in this video produced by OSU:
[embed]https://vimeo.com/709661216[/embed]Video remembrance of Oceanus:
[embed]https://www.youtube.com/watch?v=YC2eHJa8Gbs[/embed]Video of departure:
[embed]https://www.youtube.com/watch?v=qRV1IG3rs1o[/embed]Read More
pH and pCO2 Time Series from the Endurance Array
Adapted and condensed by OOI from Dever et al., 2022, and Fassbender et al., 2018 doi://10.5194/essd-10-1367-2018.
The Ocean Observatories Initiative (OOI) Endurance Array makes extensive measurements of collocated physical and biogeochemical parameters throughout the water column. At the recent Ocean Sciences meeting, we reported on moored measurements from 2015 to the present off Washington and Oregon. We focused on spatial and temporal variability of pH and pCO2 and compared the measurements to published values in the region. This information was also presented in a seminar at UC, Santa Cruz on 14 Jan 2022.
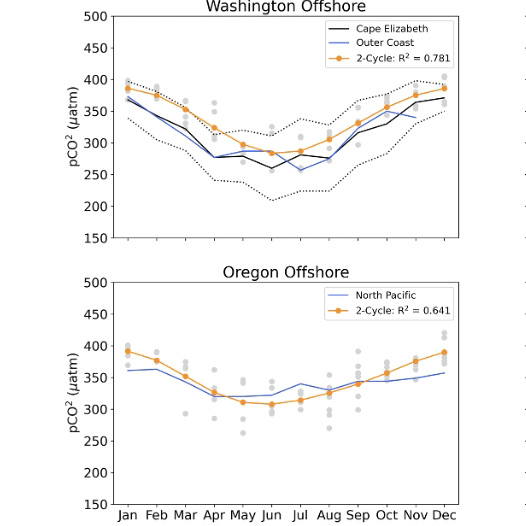
[media-caption path="/wp-content/uploads/2022/04/Endurance-highlight.png" link="#"]OOI (blue, orange) mooring seasonal cycles and monthly averages (gray) for pCO2. For context, OOI mooring cycles are plotted together with Fassbender et al. (2018) (black) regional seasonal cycles. WA moorings are compared with the Fassbender et al. Outer Coast (OC) region. OR moorings are compared with the Fassbender et al. North Pacific (NP) region.[/media-caption]
The quality-controlled biogeochemical time series are self-consistent and in line with other regional measurements. For example, pH and pCO2 have significant onshore-offshore variation and along-shelf differences north and south of the Columbia River. This variability is related to the Columbia River plume, the strength of local upwelling, and mixing with offshore waters. On a seasonal scale, pH and pCO2 is also driven by summer upwelling and winter river inputs. Variability is highest in spring and summer. pCO2 values greatly exceed atmospheric values (~400 μatm) at times in the summer (Figure above). The highest monthly pCO2 averages are seen at the Oregon shelf site.
Dever et al. (2022), pH and pC02 Time Series from the Ocean Observatories Initiative Endurance Array, CBP05, presented at Ocean Sciences Meeting 2022, Honolulu, HI (virtual), 01 Mar 2022.
Fassbender et al. (2018), Earth Syst. Sci. Data, 10, 1367–1401, 2018 https://doi.org/10.5194/essd-10-1367-2018.
Read More