
Posts Tagged ‘Southern Ocean Array’
Southern Ocean Sea Ice Predictability
Adapted and condensed by OOI from Cerovecki, et al., 2022, doi: /10.1088/1748-9326/ac7d66.
Forecasting Antarctic sea ice conditions, including specifics such as the position of the ice edge in the Southern Ocean, are substantial challenges. As a part of the Polar Prediction Project, there is a focus on improving coupled air-sea-ice prediction models and determining key sources of forecast errors. In a recent study, Cerovecki et al. (2022) show that sea ice forecast skill is linked to the accuracy of the surface forcing, and in particular, the net surface radiation. The goal of the study was to quantify errors that degrade the skill of Southern Ocean sea ice forecasts during the freezing season. They conclude that accurately modeling the surface downward longwave radiation (DLW) component of the net surface radiation is critical to sea ice prediction over the Southern Ocean.
The authors review prior results indicating that climate models have different behaviors in different seasons relative to ground truth. In spring and summer, the models over-estimate the net surface radiation whereas in winter the models under-estimate the net longwave radiation. Recognizing that these issues relate to representations of cloud cover, which can be diagnosed using DLW, the authors also note that some models showed DLW biases of up to 100 W/m2 compared to ground truth. These results were based on comparisons at McMurdo Station, Antarctica, whereas the authors were interested in processes occurring near the ice edge where few direct observations are available.
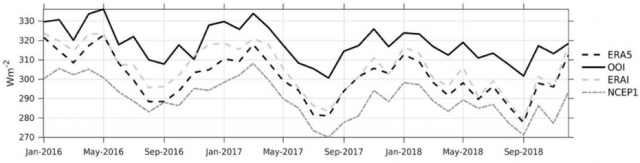
[media-caption path="/wp-content/uploads/2022/11/CGSN-highlight.png" link="#"]Figure 1. Monthly mean downward longwave radiation (DLW) for Jan 2016 – Nov 2018 from the OOI Southern Ocean buoy (solid), and three reanalysis products: ERA5 (black dash), ERA-Interim (long grey dash) and NCEP1 (short gray dash). From Ceroveki et al., 2022.[/media-caption]
The OOI Southern Ocean surface mooring provided a rare source of in-situ air-sea flux data for comparison. The study used DLW from the METBK instrument package on the OOI Southern Ocean buoy to compare with results from the ECMWF Interim reanalysis (ERAI), the ERA fifth- generation reanalysis (ERA5), and the NOAA National Centers for Environmental Prediction reanalysis (NCEP1). Despite some data gaps, the 1 min OOI METBK observations for Jan 2016 – Jan 2020, were critical to determining model biases. Hourly mean DLW data from the two METBK packages were averaged together to create the observational record.
Comparison of the observed monthly mean DLW with reanalysis output showed systematic underestimates by the models relative to the observations. The nature of the offsets is shown in Figure 1 – the reanalysis models do a relatively good job of capturing month to month variability, but with a consistent low bias. The mean offsets range from -13 W/m2 for ERAI to -28 W/m2 for NCEP1. These biases are comparable to those diagnosed at McMurdo Station, and suggest that the ERA5 DLW radiation underestimate is of the order of 20–50 W/m2. This is consistent with the finding that coupled model forecast systems over-estimate sea ice growth.
The authors conclude that a significant deficit in reanalysis DLW, related to the accuracy of cloud representation in the models, is a common problem over the Southern Ocean and impacts the skill of sea ice cover prediction. In particular, the ERA5 reanalysis may underestimate DLW by up to 50 W/m^2 during the during the freezing season. The OOI Southern Ocean data, from the furthest south sustained air-sea flux mooring, proved uniquely valuable in codifying these results.
______________________________
Cerovecki, I, R. Sun, D.H. Bromwich, X. Zou, M.R. Mazloff and S -H.Wang (2022). Impact of downward longwave radiative deficits on Antarctic sea-ice extent predictability during the sea ice growth period. Environ. Res. Lett. 17 084008. DOI: /10.1088/1748-9326/ac7d66.
Read More
Assessment of OOI Endurance Array pCO2 Data Quality
Given the significant importance of understanding and modeling levels of carbon dioxide in our atmosphere (and its potential sources and sinks), Ocean-Atmosphere Exchange and Global Biogeochemistry and Carbon Cycling are two of the OOI’s primary science themes. We address these themes in part through measurements of the air and surface water partial pressure of carbon dioxide (pCO2). Chris Wingard, the OOI Endurance Array Data Lead, recently completed an in-depth assessment of pCO2 data returned during the first four years of Endurance Array operations. These measurements were made using the Pro-Oceanus CO2-ProTM Atmosphere pCO2 sensor. By measuring the partial pressure of CO2 gas in both the air and surface water, researchers can estimate estimate surface flux of CO2 using data from this instrument. 
Wingard developed a protocol based on cross-comparisons of overlapping deployments of this sensor, comparing these with independent shipboard pCO2 measurements (including CTD samples and samples taken underway using flow-thru systems), and externally sourced air and surface water pCO2 measurements (e.g. from the LDEO Underway Database). This array of sampling techniques served to confirm the quality and scientific applicability of the Endurance Array pCO2 measurements.
He reported the results of this assessment at a poster session at the recent Ocean Sciences 2020 meeting held this past February in San Diego, CA. The protocol is largely applicable to the same suite of measurements made using the Pro-Oceanus sensor on moorings deployed in the OOI Pioneer, Irminger Sea, Southern Ocean, and Argentine Basin Global Arrays. The MATLAB code and data used to download, process, merge, and cross-compare the data used in this assessment are available online for use.
Both the air and surface water measurements and the flux estimates used in this assessment are available through the OOI Data Portal. Endurance Array air and surface water pCO2 measurements are made at four locations distributed across the Oregon and Washington shelf and slope within the northern California Current Marine Ecosystem.
Other sources of Endurance Array-specific data include the most recent 60 days of the Endurance Array’s air and surface water pCO2 data are available on the NANOOS Visualization System (NVS) and the Global Ocean Acidification Observing System Data Portal (GOA-ON).
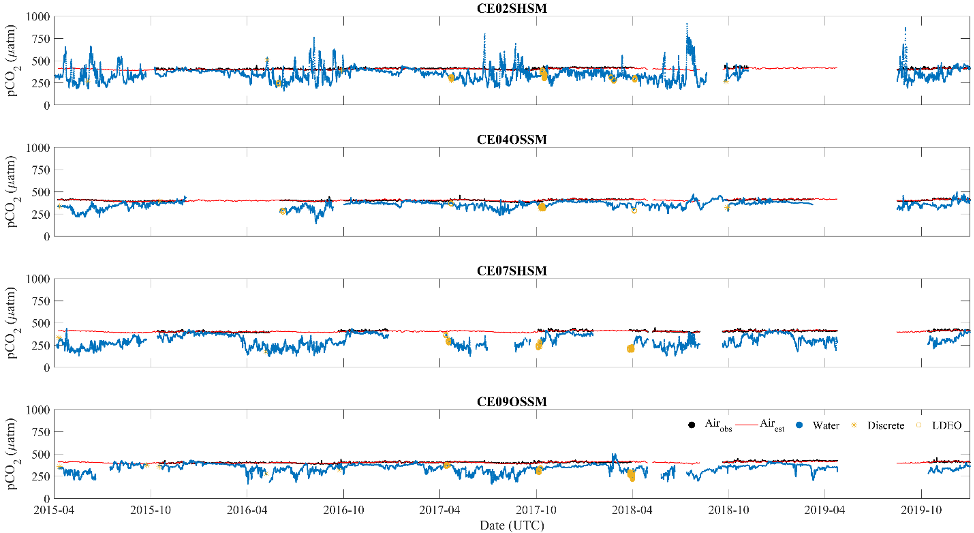
Figure 1: Surface water (•) and air pCO2 (•, observed and —, array average) measurements from 2015-04-01 through 2019-12-31 for the four moorings. The plots also show the distribution of discrete sample (*) and LDEO V2018 (O) data that coincide with each mooring. The data plotted have had human-in-the-loop (HITL) QC flags applied to remove points marked as suspect or failed. Beyond smoothing the data records and the estimation of an array averaged air pCO2 (—), no further corrections were applied to the data. Note the high degree of variability during the summer months in the surface water pCO2 measurements for CE02SHSM, which are similar to other observations made on the Oregon Shelf (Evans et al., 2011).
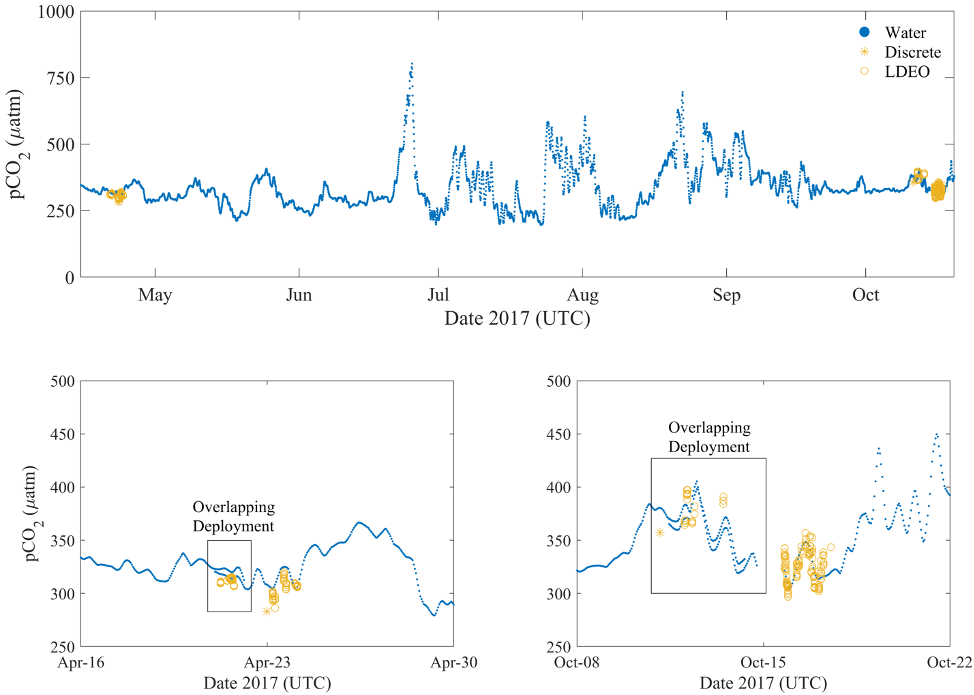
Figure 2: Focused view (upper panel) of the Spring 2017 deployment (#5) of CE02SHSM showing the observed offsets between the surface water pCO2 measurements (•) and the discrete samples (*) and LDEO V2018 (O). Detailed views in the lower two panels, provide a better picture of the observed offsets during the periods of over-lapping deployments; between deployments 4 and 5 (lower left) and deployments 5 and 6 (lower right). Prior to using the OOI pCO2A data, users are strongly encouraged to conduct such cross-comparisons. The independent measurements obtained by the separate systems, and the close agreement between them, provide measures of confidence in the accuracy and applicability of the data.
Read MoreOOI Launches “Download” to Keep Community Informed
[/media]
The first issue of Download, the OOI’s new newsletter, was released on 1 May. It provides a short, concise look at the OOI, with clickable links for digging deeper into specific topics. It covers the latest OOI developments, scientific advances being made using OOI data, and opportunities for you to participate in the OOI, through help with proposals, data use, workshops, and other events.
The newsletter is available online here. If you’d like to subscribe, please send an email to dtrewcrist@whoi.edu, with a subject line: Download subscribe.
Read More
Fifteen Findings in 15 minutes
“Just like lightning,” in one-minute presentations, 15 scientists shared amazing ways they are using OOI data in scientific investigations and in the classroom. This round of lightning talks capped the Ocean Observatories Initiative Facility Board’s (OOIFB) Town Hall at the 2020 Ocean Sciences Meeting on 20 February, demonstrating the multiple and creative ways OOI data are being used to answer key science questions in a changing environment.
The presentations ranged from how students are using real-life and real-time OOI data to advance their understanding of scientific principles to how researchers are using OOI data to identify the presence of marine life by sound to how modelers are making OOI data more accessible and useable.
“We were simply thrilled by the depth, breadth, and range of applications of OOI data shown during this lightning round,” Kendra Daly, chair of the OOIFB. “We were pleased so many presenters were willing to accept the challenge. This enthusiastic response clearly shows that OOI data are being used to help answer important science questions.”
Brief summaries of the talks are presented below.
Advancing science
Isabela Le Bras, Scripps Institution of Oceanography, reported on a recent article in Geophysical Research Letters, where she and her colleagues describe how they used data from the Irminger Sea Array moorings (2014–2016) to identify two water masses formed by convection and showing that they have different rates of export in the western boundary current. Upper Irminger Sea Intermediate Water appears to form near the boundary current and is exported rapidly within three months of its formation. Deep Irminger Sea Intermediate Water forms in the basin interior and is exported on longer time scales. The subduction of these waters into the boundary current is consistent with an eddy transport mechanism. The eddy transport process is more effective for the waters cooled near the boundary current, implying that cooling near boundary currents may be more important for the climate than has been appreciated to date.
Since 2017, Clare Reimers and Kristen Fogaren, Oregon State University, have been working to assess seasonal variability in benthic oxygen consumption and the contribution of benthic respiration to the development of hypoxic conditions in the northern California Current, using time series data from the OOI Endurance Array. Reimers and Fogaren measured benthic oxygen consumption rates using in situ eddy covariation techniques and ex situ core incubations, during a series of ten cruises that allowed sampling near the Endurance Oregon Shelf and Inshore stations, in all seasons. During these cruises, the researchers used real-time data provided by the Endurance Array to optimize the settings for their eddy covariance deployments. They are now examining property-relationships in discrete bottom water samples collected during the cruises and using data from OOI assets to help separate influences of mixing and biochemical processes in the water column and sediments. The researchers are also synthesizing benthic flux measurements and placing these rates in the context of cross-shelf glider measurements and benthic node time series.
Adrienne Silver, University of Massachusetts Dartmouth provided details about how she is using Pioneer Array data to learn more about the influence of warm core rings on Shelf break circulation. Results from a 40-year Warm Core Ring census show a regime shift in warm core ring formation at 2000, with the number of rings doubling from an average of 18 rings per year (during 1980-1999) to 33 rings per year (during 2000-2019). This regime shift creates a large increase in the amount of warm salty water being transported northward toward the shelf from the Gulf Stream. The preferred pathway of these rings, or the Ring Corridor seem to indicate their proximity to the shelf break and the Pioneer array during their lifetime. The goal of Silver’s project is to understand how these warm core rings affect the shelf break exchange while traveling along the shelf. A large focus of the study will be on the salinity intrusion events which might be sourced from these warm core rings.
Liz Ferguson, CEO and founder of Ocean Science Analytics, is using data from OOI’s Coastal Endurance and Regional Cabled Arrays to determine the variables that are most useful for assessing the ecosystem of this region and obtaining baseline information on marine mammal acoustic presence for use in monitoring. Using long term physical and biological data provided by these arrays, Ferguson is assessing long-standing shifts in the ecology of this coastal and offshore environment by associating physical oceanographic variables with the vocal presence of marine mammals using the broadband hydrophone data. Temporal changes in the occurrence of marine mammal species such as killer whales, sperm whales and dolphins can be used as an indicator of ecosystem shifts over time. She is analyzing passive acoustic data provided by the OOI arrays to determine the presence of vocally active marine mammal species, identify their spatial and temporal use of these sites, and combining this information with the physical oceanographic variables to assess the ecological characteristics associated with marine mammal occurrence.
Sam Urmy of the Monterey Bay Aquarium Research Institute (MBARI) also is using OOI acoustical data in his research. Using an upward-looking echosounder and a high-frequency hydrophone at MBARI’s Monterey Accelerated Research System, Urmy showed how small animals in the epipelagic and mesopelagic altered their behavior in response to predators. These responses included abrupt dives during bouts of foraging by dolphins, changes in depth to avoid predatory fish schools, and dramatic alterations to daily vertical migratory behavior. Continual observations of the mesopelagic with active and passive acoustics are revealing several dynamic predator-prey interactions in an ecosystem that is typically thought of as relatively slow and static.
Veronica Tamsitt of the University of New South Wales used the OOI’s Southern Ocean mooring and the Southern Ocean Flux Site (SOFS, in the Southeast Indian) to study the Sub Antarctic Mode water (SAMW) formation. Tamsitt’s and her colleagues findings were reported in the Journal of Climate in March 2020. Using data from the two mooring locations, the researchers were able to compare and contrast characteristics and variability of air-sea heat fluxes, mixed-layer depths, and SAMW formation. The researchers found that inter mixed-layer depth anomalies tended to be intermittent at the two moorings, where anomalously deep mixed layers were associated with anomalous advection of cold air from the south, and conversely shallow mixed layers correspond to warm air from the north. Both the winter heat flux and mixed-layer depth anomalies, however, showed a complex spatial pattern, with both positive and negative anomalies in both the Indian and Pacific basins that Tasmitt and colleagues relate to the leading modes of climate variability in the Southern Ocean.
Editor’s note: The Southern Ocean Array was decommissioned in January 2020. Its data, however, are still available for use by researchers, students, and the public.
Bringing OOI data into the classroom
Sage Lichtenwalner, Department of Marine and Coastal Sciences at Rutgers, The State University of New Jersey reported on the progress of the Ocean Data Labs Project. This project is a Rutgers-led effort to build a “Community of Practice” to tap into the firehose of OOI ocean data to support undergraduate education. To date, the project has hosted four “development” workshops that introduced participants to the OOI, conducted data processing with Python notebooks, and shared effective teaching strategies, in addition to a series of introductory workshops and webinars. As part of the development workshops, 56 university, college, and community college faculty designed 19 new “Data Explorations,” featuring web-based interactive “widgets” that allow students to interact with pre-selected data from the OOI. The project also sponsors a series of webinars, a fellowship program, and is compiling a library of resources (including coding notebooks, datasets, and case studies in teaching) to help the community.
Cheryl Greengrove, University of Washington Tacoma, summarized an article in the March issue of Oceanography that she and colleagues from across the United States wrote detailing ways to integrate OOI data into the undergraduate curriculum. The wealth of freely-accessible data provided by OOI platforms, many of which can be viewed in real or near-real time, provides an opportunity to bring these authentic data into undergraduate classrooms. The TOS article highlights existing educational resources derived from OOI data that are ready for other educators to incorporate into their own classrooms, as well as presents opportunities for new resources to be developed by the community. Examples of undergraduate introductory oceanography OOI data-based lessons using existing interactive online data widgets with curated OOI data on primary productivity, salinity, and tectonics and seamounts are presented, as well as ways to use OOI data to engage students in undergraduate research. The authors provide a synthesis of existing tools and resources as a practical how-to guide to support new resource development and invite other educators to develop and implement new educational resources based on OOI data.
Matthew Iacchei, Hawaiʻi Pacific University, presented how he has been integrating OOI data explorations to supplement his upper division oceanography lecture and labs with real data from around the world. Last semester, he had students explore patterns of dissolved oxygen and impacts of anoxia at the coastal endurance array in Oregon and compare that data to dissolved oxygen data the students collected in Kāneʻohe Bay, Hawaiʻi. This semester, students are working through two exercises with OOI data as part of their primary productivity lab (perfect, as it is now online!). Students will compare vertical profiles from Hawaiʻi with seasonal variations across the world, and will compare latitudinal drivers of primary production using data from a time-series from the Southern Ocean Array.
Strengthening OOI data usability
Wu-Jung Lee, a senior oceanographer at the Applied Physics Laboratory, University of Washington, is using data collected by the OOI to develop new methodologies for analyzing long-term ocean sonar time series. In a project funded by the National Science Foundation, she and her colleagues show that unsupervised matrix decomposition techniques are effective in discovering dominant patterns from large volumes of data, which can be used to describe changes in the sonar observation. Their preliminary analysis also show that the summaries provided by these methods facilitate direct comparison and interpretation with other ocean environmental parameters concurrently recorded by the OOI. A parallel effort that spun out of this project is an open-source software package echopype, which was created to enable interoperable and scalable processing of biological information from ocean sonar data.
As part of the Rutgers Ocean Modeling Group, in conjunction with University of California Santa Cruz, John Wilkin and Elias Hunter are delivering a high-resolution data assimilative ocean model analysis of the environs of the Pioneer Coastal Array, including a systematic evaluation of the information content of different elements of the observing network. The project uses the Regional Ocean Modeling System with 4-Dimensional Variational data assimilation. To produce a comprehensive multi-year (2014-2018) analysis required them to assimilate all available Pioneer CTD data, with quality checks, in a rolling sequence of data assimilation analysis intervals. They used three days of data in each analysis, which required queries to with a time range constraint and relevant platform (i.e. glider, profiler, fixed sensor), migrating all Pioneer CTD data (wire following profilers, gliders, fixed sensors, plus ADCP velocity) to an ERDDAP server. The simple graphing capabilities in ERDDAP allow quick browsing of the data to trace quality control or availability issues, and ERDDAP provides a robust back-end to other web services to create more sophisticated graphical views, or time series analysis. Using the ERDDAP Slide Sorter tool, they operate a quick look Control Panel to monitor the data availability and quality.
Mitchell Scott and colleagues Aaron Marburg and Bhuvan Malladihalli Shashidhara at the University of Washington, are studying how to segment macrofauna from the background environment using OOI data from the Regional Cabled Axial Seamount Array. Their long-term goal is to use an automated approach to study species variation over time, and against other environmental factors. Their initial step focuses specifically on scale worms, which are very camouflaged, making them difficult to detect. To address this, the researchers initially used a deep learning model, called U-Net, to detect and localize the scale worm locations within an image. To address the high rate of false positives using this model, they added an additional classifier (a VGG-16 model) to verify the presence of scaleworms. This combined, applied approach proved feasible for scale worm detection and localization. Yet because the environment of the Axial Seamount is so dynamic due to the growth and decay of chimneys at the site and resulting changes in bacteria and macrofauna present, they found the performance of the model decreased over time.
Weifeng (Gordon) Zhang of Woods Hole Oceanographic Institution has been using Pioneer Array data to understand the physical processes occurring at the Mid-Atlantic Bight shelf break, including the intrusion of Gulf Stream warm-core ring water onto the shelf and the ring-induced subduction of the biologically productive shelf water into the slope sea. His findings were reported in a Geophysical Research Letters paper where data from the Pioneer Array moorings and gliders demonstrated the anomalous intrusion of the warm and salty ring water onto the shelf and revealed the subsurface structure of the intrusion. Zhang also shared findings reported in the Journal of Geophysical Research: Oceans where data from the Pioneer Array showed a distinct pattern of relatively cold and fresh shelf water going underneath the intruding ring water. These results show the subduction of the shelf water into the slope sea and a pathway of shelf water exiting the shelf. In both instances, Zhang and his colleagues used computer modeling to study the dynamics of these water masses. These two studies together suggest that shelf break processes are complex and require more studies in the region.
Hilary Palevsky of Boston College presented results from an ongoing project funded by the National Science Foundation’s Chemical Oceanography program, using biogeochemical data from the OOI Irminger Sea Array. Analysis of dissolved oxygen data on OOI Irminger Sea gliders and moorings from 2014-2016 showed the importance of biogeochemical data collected over the full seasonal cycle and throughout the entire water column, due to the influence of subsurface respiration and deep winter convection on biological carbon sequestration. The OOI Irminger Sea array is the first source of such full-depth year-round data in the subpolar North Atlantic. To quantitatively evaluate the annual rate of carbon sequestration by the biological pump and the role of deep winter convection, Palevsky and colleague David Nicholson of the Woods Hole Oceanographic Institution collaborated with OOI to improve the calibration of oxygen data at the Irminger Sea array by modifying the configuration of glider oxygen sensors to enable calibration in air each time the glider surfaces, which improves the accuracy and utility of the data collected both from gliders and from moorings. Palevsky presented preliminary results demonstrating successful glider air calibration at the Irminger array in 2018-2019 as well as work by student Lucy Wanzer, Wellesley College, demonstrating the importance of well-calibrated oxygen time series data to determine interannual variability in rates of subsurface respiration and deep winter ventilation in the Irminger Sea.
Read More
Array Enhanced Understanding of Complex Southern Ocean
Five years of data have made a significant difference in understanding of the complex processes occurring in the remote and hostile conditions of the Southern Ocean. In its five years of deployment, OOI’s Southern Ocean Array has provided critical data that enhanced weather modeling and forecasting, while providing means to study the mechanisms behind Southern Ocean warming and the storage of carbon at depth.
Four OOI moorings were deployed in February 2015 in a very sparsely sampled area in the Southern Ocean (55 degrees South, 90 degrees W) with the goal of helping modelers, forecasters and scientists understand this dynamic and volatile environment. One mooring was decommissioned in 2017. Two bottom halves remained in place through 2018 and a single surface mooring remained in place through January 2020. Collectively, these deployments provided a continual treasure trove of data to scientists, modelers, and forecasters.
This data stream is particularly important because the Southern Ocean is not only warming faster than other parts of the world ocean, it has also been implicated as the major region for ocean uptake of carbon dioxide.
“Collecting continuous data in this sparsely sampled region has provided a groundtruth point to help refine climate models and weather forecasts, and better understand complex processes occurring in the Southern Ocean,” said Dr. Sheri N. White, lead systems engineer for the Coastal Global Scale Nodes of OOI at Woods Hole Oceanographic Institution and chief scientist on the 2018 and 2020 OOI expeditions that recovered the Southern Array.
The benefits of deployment were evident. When the moorings were first deployed in 2015, data were not initially integrated into the World Meteorological Organization’s Global Telecommunication System (GTS). In August 2017, when the data were added to the GTS, making them more easily accessible for weather forecasters and modelers, they had an almost immediate impact on forecasting by the European Centre for Medium-Range Weather Forecasts (ECMWF). In August 2017, for example, OOI’s Surface Buoy picked up a low-pressure system moving through the area. Integrating these data into forecast models, researchers filled in some key spatial gaps in their observational coverage, reducing the error in 24-hour forecasts. With improved data, ECMWF was better able to forecast the next huge Southern Ocean storm with a central pressure around 955 mb that had simultaneous major impacts on southern South America, Drake Passage, and the Antarctic Peninsula.
The Southern Ocean Array also provided a platform for interagency and interdisciplinary collaborations. The National Science Foundation and its UK counterpart, the National Environmental Research Council joined forces to support two expeditions in 2018 and 2020. The 2018 expedition recovered the bottom halves of the moorings, while outfitting the surface mooring with equipment to measure silicate and nitrate using “lab-on-a-chip” technology (miniaturized analytical devices that integrate laboratory operations into a single chip on a very small scale.) This work was an investigation undertaken by Dr. Adrian Martin of the UK’s National Oceanography Centre and an investigator for CUSTARD (Carbon Uptake and Seasonal Traits in Antarctic Remineralisation Depth). The sensors and the surface mooring were recovered during the 2020 expedition.
“CUSTARD focuses on how interactions between marine organisms, nutrients in the water and the ocean circulation control the storage of carbon at depth. To do so requires information through the year because of the boom and bust seasonal cycle of phytoplankton,” explained Martin. “The mooring gave us both a variety of important data as well as a platform to deploy some of our own sensors year-round in the challenging environment of the Southern Ocean. The CUSTARD project benefited immensely from our collaboration with OOI. “
The OOI moorings also provided scientists with a means to study the mechanisms behind Southern Ocean warming. In a study led by Sarah Ogle of Scripps Institution of Oceanography, scientists found that just a few extreme storm events drive most of the mixed-layer deepening, suggesting that air-sea heat exchange is a highly episodic process.
“Only the largest storm events each year are able to mix the upper ocean enough to influence the ocean interior,” said Dr. Sarah Gille, also of Scripps and a member of OOI’s Facility Board. “With the removal of OOI, we’ve lost one window into these big events, but from the OOI data, we’ve gained some perspective on what types of measurements need to be collected to understand air-sea exchange in the region. In the future, I hope that we’ll be able to make use of newer autonomous systems to continue the research started in the Southern Ocean with OOI.”
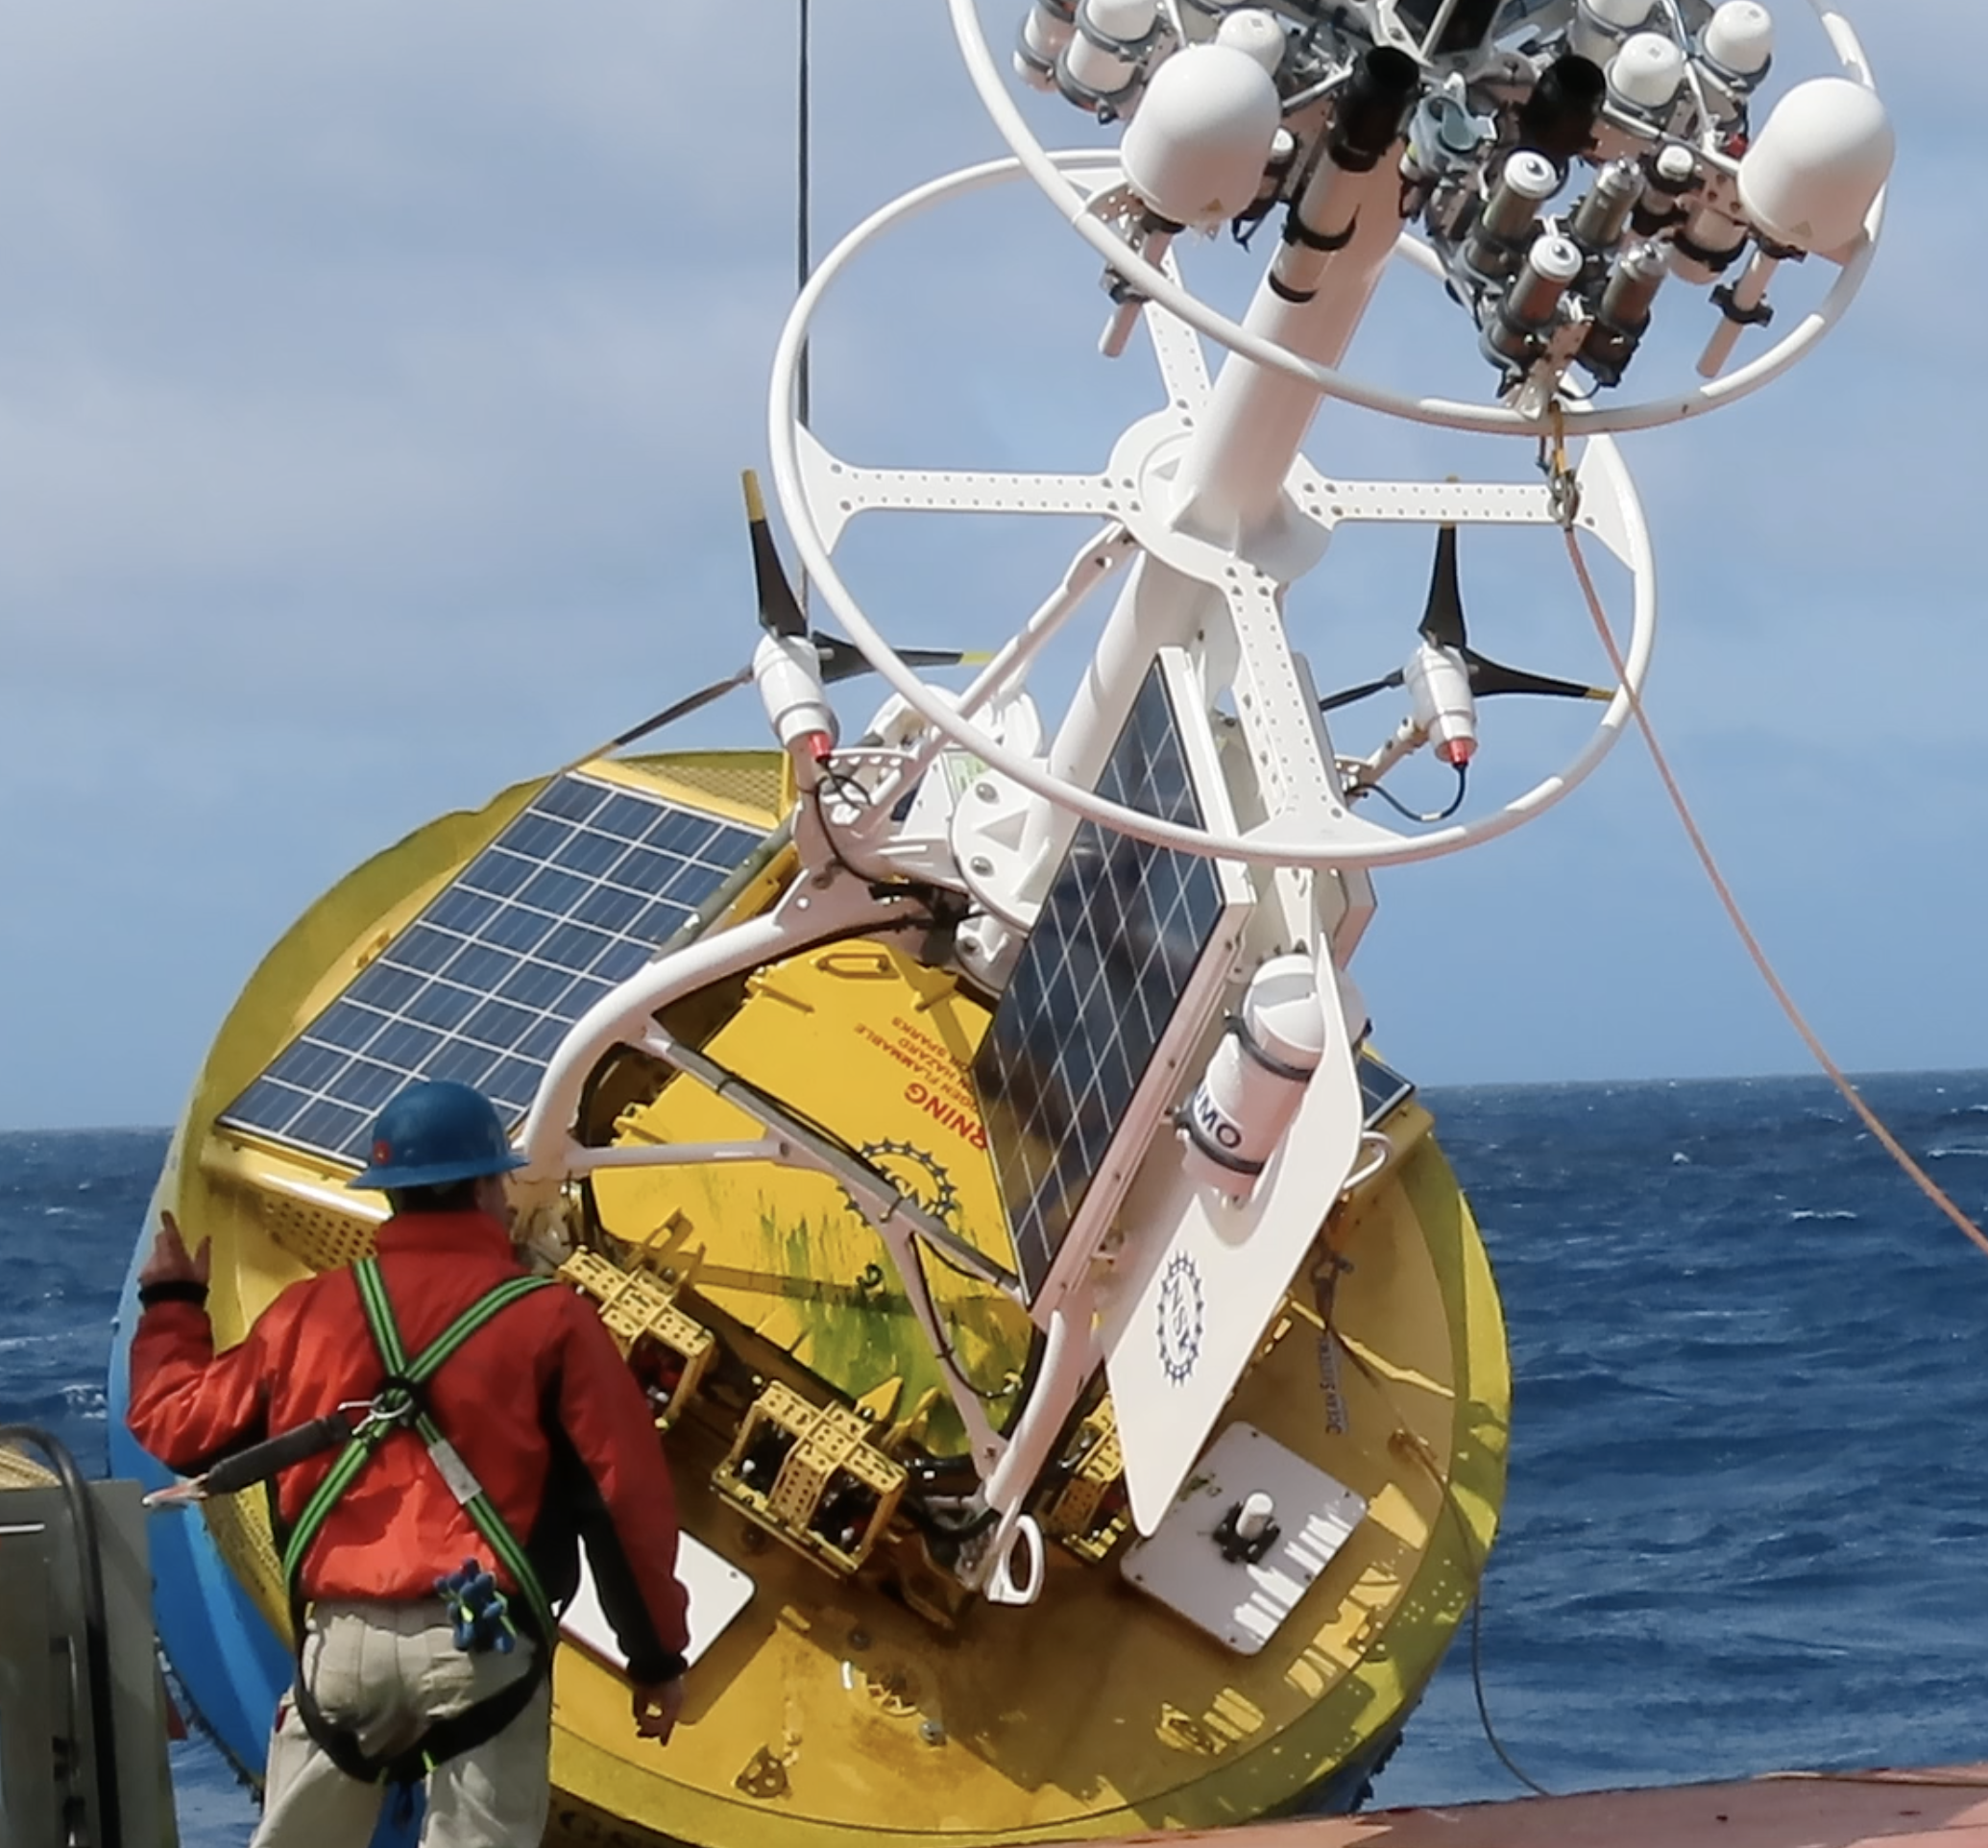
[media-caption type="vimeo" path="https://vimeo.com/398932101" link="#"] Crew members recover the last Southern Array Surface Mooring (9000+ lbs) aboard the RRS Discovery, operated by the Natural Environment Research Council.Video courtesy of Dr. Adrian P. Martin, National Oceanography Centre [/media-caption] Read MoreEarly Career Highlight – Veronica Tamsitt – Taking hold of opportunities in the Southern Ocean
To Tamsitt, the OOI is a game changer in the Southern Ocean. “In the air-sea flux community, there are almost no measurements in the Southern Ocean except from ships,” says Tamsitt. “The OOI Surface Mooring is the southernmost mooring ever deployed.
Read MoreOOI Southern Ocean Array (55S, 90W) provides critical weather forecast data
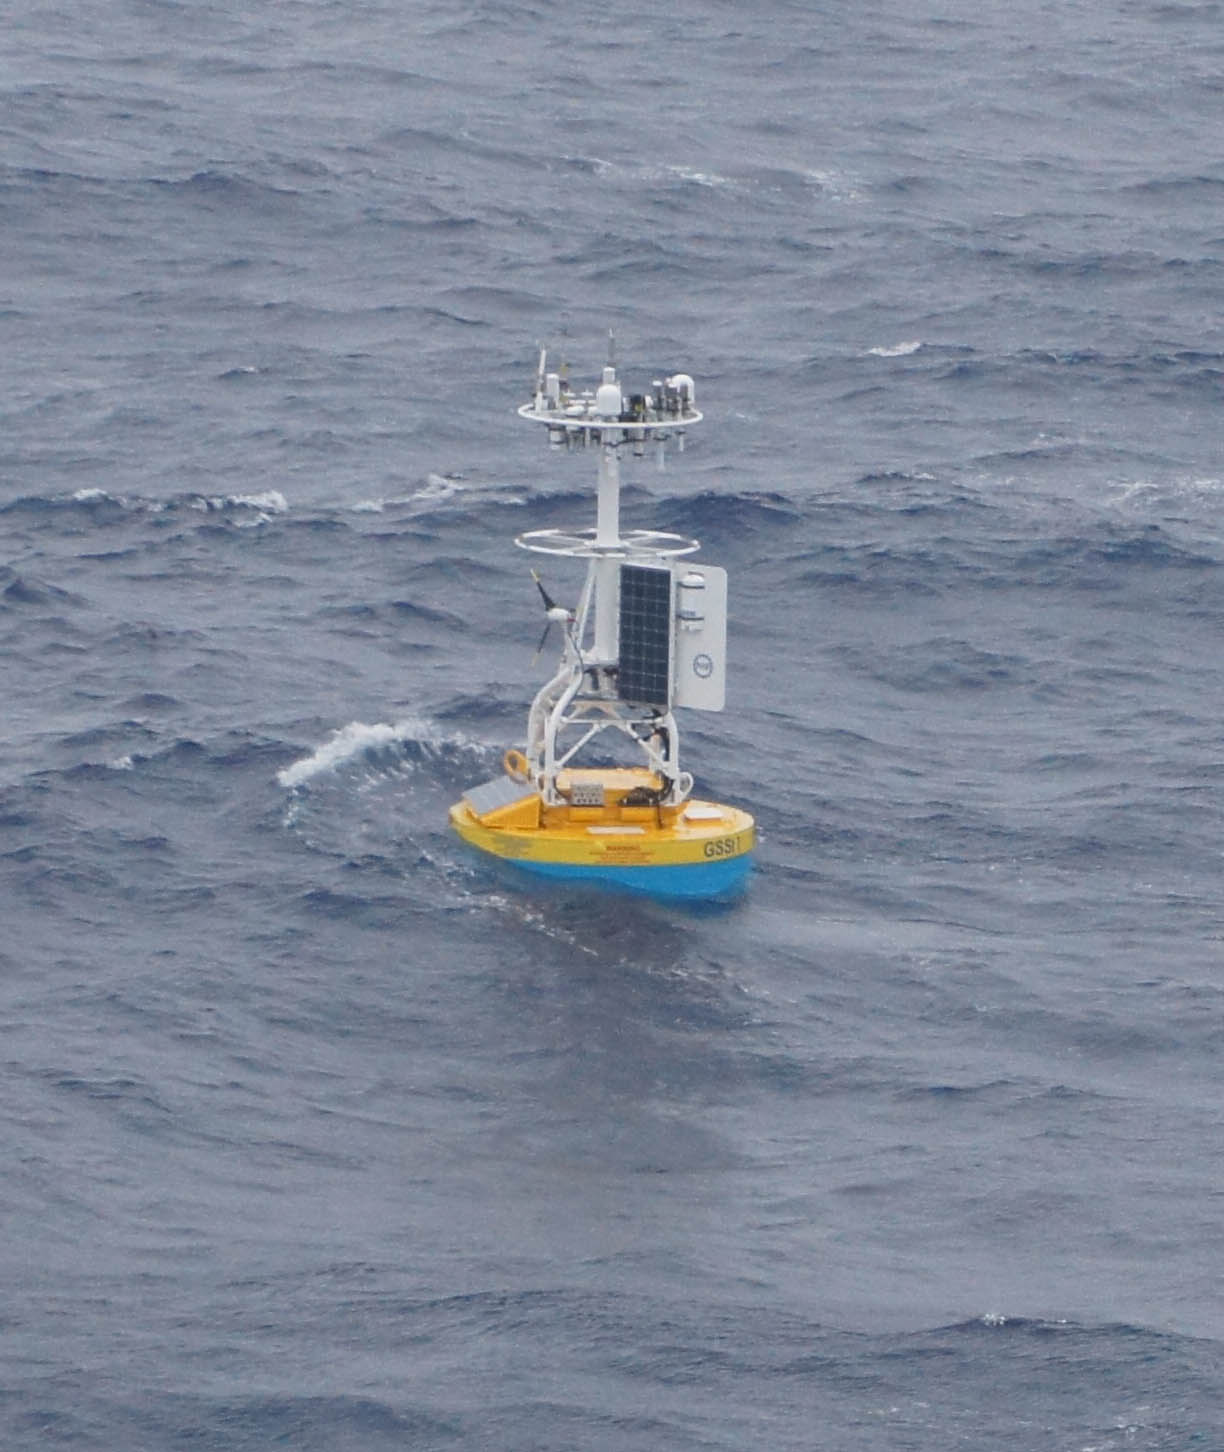
Data from the OOI Southern Ocean Array Surface Mooring have been integrated into the World Meteorological Organization’s Global Telecommunication System, making these data more easily accessible for weather forecasters and modelers.
Read MoreSouthern Hemisphere Deployments Photo Tour
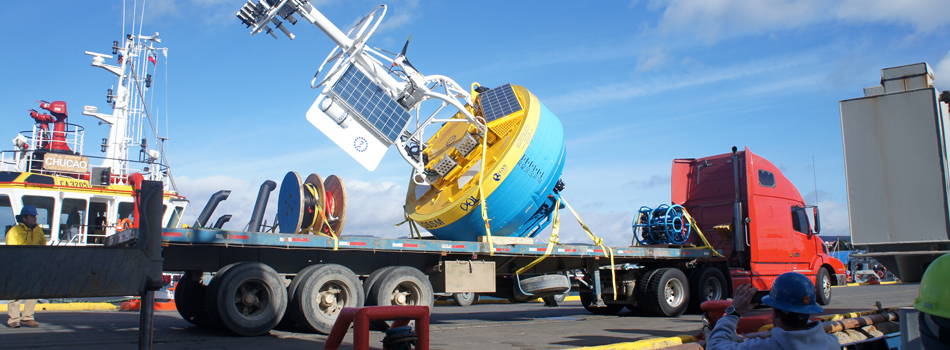
In February, an OOI team, led by Woods Hole Oceanographic Institution (WHOI) installed one global surface mooring, one global profiler mooring, two flanking moorings, and a glider at the OOI Southern Ocean station at 55oS, 90oW.
Read More