
News
Cadet Reports on First Voyage on a Research Vessel
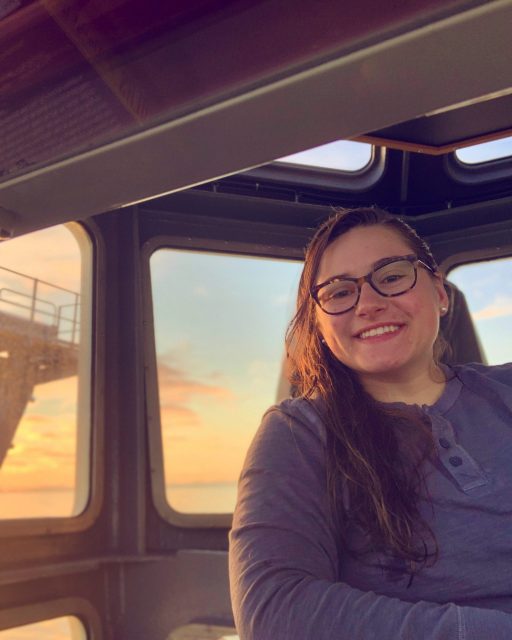
Massachusetts Maritime Academy First-Class Cadet, Ella Strano, recently returned from two months aboard the R/V Neil Armstrong. Ella participated as a working crew member for the recovery and deployment of OOI’s Global Irminger Sea Array in July, followed by deployment of moorings and sampling equipment for the Overturning in Subpolar Arctic Project (OSNAP). She had a few days in shore in Reykjavik, Iceland, as the science parties and equipment were swapped out and onboard.
In a word, Ella described her experience as “Awesome!” and one that was a very different experience than that of her peers’ summer internships shipboard experiences. The majority of cadets at the Massachusetts Maritime Academy shipped out on cargo vessels and bulk carrier tugs for their first experiences of life at sea.
Being one of a few stationed on research vessels presented both opportunities and challenges.
“I definitely had to go with the flow,” she explained. “But l had the opportunity to learn not only from the crew, but from the scientists on board.” Ella’s minor is marine biology so she enjoyed the science aspects of the expedition, even though her responsibilities were primarily with helping to keep the ship operational so the science could be conducted.
Part of MA Maritime’s mission is to provide their students with hands-on at-sea experience so they understand the language and culture of shipboard life. In meeting the spirit of the experience, Ella did almost everything aboard the ship while she was a mate on the Armstrong. During the Irminger expedition, her duties were mostly on deck. She worked with the mooring team and observed how deployment and recovery operations could be conducted safely and successfully. Ella joked that she also did her fair share of cleaning the ship during her first month at sea.
[media-caption path="/wp-content/uploads/2022/09/Working-Aframe-2-scaled.jpg" link="#"]Ella Strano operating the Aframe used to recover and deploy OOI moorings. [/media-caption]During her second stint for the OSNAP expedition, her duties turned more inward and included work in the engine room, on the bridge, and even helped maneuver the ship to stay on station—a critical task for any science operation at sea. She had her hand in everything on the ship, except for the galley, which was left to the professionals.
Ella also experienced a fair share of weather during her initial trip to the North Atlantic, but was pleased that in spite of some low-pressure and high wind days, the ship never had to abandon its mission to find shelter from the weather.
After two months at sea, Ella said it affirmed what she’s interested in doing after graduating next year. After disembarking from the Armstrong, she said, “I love this. It’s so cool that people get to go out to sea and be involved with science, but not necessarily specialize in one area of science.” She sees life aboard a research vessel as offering her the opportunity to be involved with many different science initiatives, learn what’s going on, and never get bored.
Ella said there seems to be an uptick of interest in working aboard science research vessels as she was one of seven of her classmates who sought such a placement, and only three succeeded. If this holds true that would be good news for research ships, which often have to compete for staff who have the potential to earn more working aboard commercial vessels.
Ella’s experience offered something of greater value to her. “There was a really good camaraderie between the science group and the officers,” she explained. “We were all working together and share experiences during mealtimes and cheese-30 every day”. (A spread of cheese and meats is provided every day at three o’clock aboard the Armstrong as a break and snack). “The crew really tried to make life pleasant aboard the ship, which was great because we were at sea for a long time.”
[media-caption path="/wp-content/uploads/2022/09/ella-on-bridge.png" link="#"]Ella Strano on the bridge of the R/V Neil Armstrong. [/media-caption]If all goes as planned, Ella will graduate next year with a Bachelor of Science Degree in Marine Transportation from MA Maritime and with an enlisted unlimited tonnage, third officer certificate from the U.S. Coast Guard. She hopes to find a place aboard the Armstrong or other science-related position, inspired by a full female bridge team, and science party comprised of 50 percent women, and led by a female chief scientist, all of whom showed her what is possible.
Read More
Interview from Axial Seamount
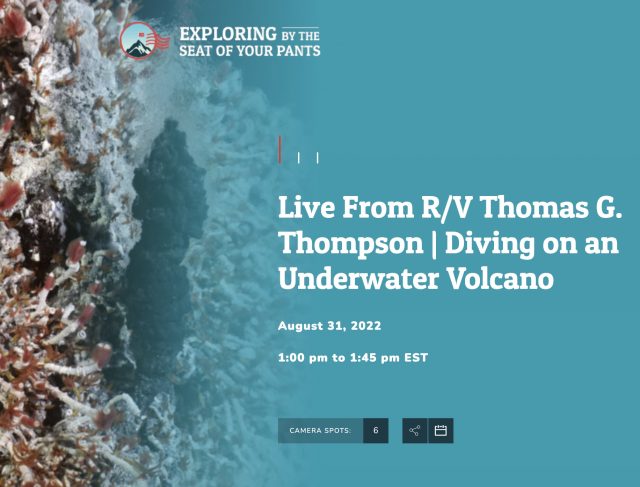
In case you missed it, you can watch the video of Chief Scientist Michael Vardaro and student Andrew Paley being interviewed live aboard the R/V Thomas G. Thompson during the Regional Cabled Array for its eighth annual operations and maintenance cruise. The Exploring by the Seat of Your Pants program is designed to give students an opportunity to see scientists in action in the field, in the hope of piquing their interest in science and perhaps pursuit of scientific careers. (The piece is 45-minutes long so takes a moment to load. If you prefer, click on this link: https://www.youtube.com/watch?v=K–RlkjMjLo).
[embed]https://youtu.be/K–RlkjMjLo[/embed] Read MoreDr. George Voulgaris Appointed New OOI Program Director
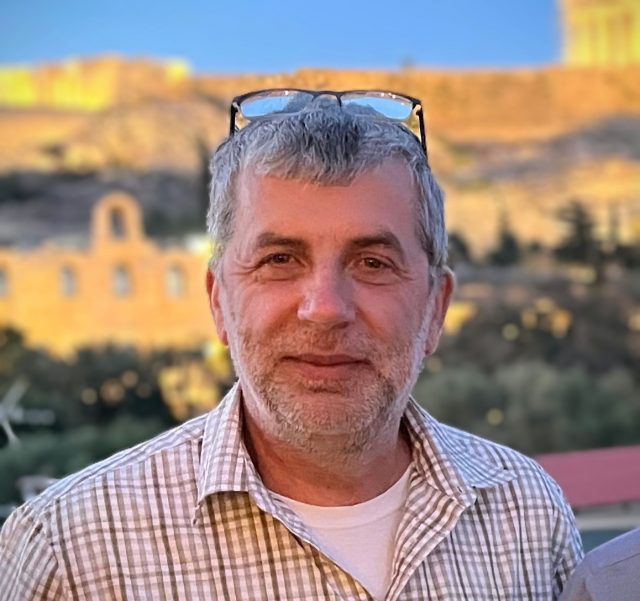
The National Science Foundation (NSF) announced the appointment of Dr. George Voulgaris as the new Program Director for the NSF-funded Ocean Observatories Initiative. Voulgaris joins NSF from the School of Earth, Ocean, and Environment at the University of South Carolina, where he was a full professor and held a variety of administrative appointments throughout his career. Voulgaris assumes the OOI leadership role that was jointly provided by NSF Section Heads, Lisa M. Clough, Ocean Section, and Bauke (Bob) H. Houtman, Integrative Programs since 2016. Bob retired at the end of 2022, but Lisa continues to support George in his new role and remains engaged with the OOI Facility.
This position marks a return to NSF for Voulgaris who served as a Program Director for NSF’s Physical Oceanography Program from July 2017 to August 2020.
Lisa Clough said, “Bob and I are excited to be turning over the reins of the OOI at NSF to George, who is very well-suited to the task. George has more than 30 years-experience in ocean observations systems, as well as 3+ years of experience as an NSF program director. With this experience, he brings to OOI the unique perspective of understanding what quality ocean observations require from standpoint of a system operator, scientist and educator, and as a federal funder. Unquestionably, George will help the OOI deliver on its mission to be one of the world’s premier ocean observing systems.”
Voulgaris plans to facilitate the work of OOI operators and the OOI Facility Board (OOIFB) as both respond to the challenges and opportunities informed by the broader oceanographic community. “Coming from an institution with no major oceanographic facilities, I have a great appreciation of the opportunities OOI provides to faculty, researchers, and students with no access to such facilities,” Voulgaris explained. “I hope to help OOI continue to provide these services and further enhance its impact through new scientific discoveries and synergies with other partners vested in ocean discovery and through new emerging technologies. I am excited be a part of OOI as its impact grows both nationally and internationally.”
Voulgaris joined the University of South Carolina as Assistant Professor in 1998 and was promoted to the ranks of Associate and Full Professor in 2005 and 2008, respectively. His research is in the area of Coastal Processes incorporating aspects of both Marine Geology and Physical Oceanography. His many externally funded research projects (e.g., NSF, National Oceanic and Atmospheric Administration, the Department of the Interior) range from exploring the surf-zone to continental shelf circulation and often include assessing sediment transport and wave-current interactions, using hydrodynamic and turbulence measurements in the field and laboratory. For the last decade, he has been active in operational oceanography utilizing coupled wave and current numerical models and HF and VHF Radar measurements for measuring surface currents and ocean waves.
Voulgaris has authored or co-authored over 100 peer-reviewed manuscripts, 130 published abstracts and 45 technical reports, source-codes, and other non-refereed publications. In recognition of his research contributions, he was awarded the University of South Carolina Research Foundation award for Science and Mathematics in 2014. Voulgaris has served as a member of the Scientific Committee of the Key Laboratory for Coast and Island Development, Ministry of Education, Nanjing University, China, and on the Board of Directors for the Southeast Coastal Ocean Observing Regional Association. Voulgaris is also a member of the American Geophysical Union, the American Association for the Advancement of Science, and the Marine Technology Society.
Voulgaris received a bachelor’s degree in Geology from the University of Patras in Greece and a Ph.D. in Oceanography from the University of Southampton in the United Kingdom.
The Ocean Observatories Initiative is a 25-year ocean infrastructure project funded by the National Science Foundation to gather and deliver physical, chemical, and biological measurements from the ocean, atmosphere, and seafloor to anyone with an internet connection. The program includes moored instrument arrays and autonomous underwater vehicles deployed at critical locations in the coastal and open ocean worldwide. Data from the observatories help researchers address questions across short and long time periods, small and large spatial scales, and from the ocean surface to the seafloor. OOI is managed by the Woods Hole Oceanographic Institution (WHOI) and implemented by WHOI, the University of Washington, and Oregon State University.
Read More
Data Stream Parameters Simplified to Ease Access

We are in the process of changing the values of data stream parameters to be more Climate and Forecast (CF) compliant and to make the data you are looking for easier to find. For example, the parameter “pressure_depth” has been renamed to simply “pressure.”
The value change process started with pressure_depth and will be ongoing in our attempt to improve access to OOI data for all users. This next round of changes is larger in scope, and changes are documented in file format (excel, .csv) and accessible on the Changes Affecting Data page. Note that the changed values will take effect immediately in the M2M interface while pre-processed staged files will take up to a week to refresh. These updates were released on August 25th at 1:00pm ET.
Should you have any questions about this process or others, please don’t hesitate to reach out to our HelpDesk.
Read MoreCall for Applications: OOIFB Board Position
The Ocean Observatories Initiative Facility Board (OOIFB) provides independent input and guidance regarding the management and operation of the National Science Foundation-funded Ocean Observatories Initiative (OOI). The OOIFB works to expand scientific and public awareness of the OOI, and ensure that the oceanographic community is kept informed of developments of the OOI.
The OOIFB is soliciting applications to fill one open membership position. The appointment will fill the remainder of an unexpired term and will be effective starting in October 2022 and run through May 2023. The selected individual will be eligible to serve two additional 3-year terms. The OOIFB holds at least one in-person meeting per year and one web conference each month.
Scientists with experience using scientific observing systems, such as the OOI, are encouraged to apply. In an effort to maintain the expertise and disciplinary depth on the committee, we are particularly interested in applicants with research experience using data from the OOI Global Arrays, Endurance Array, and/or from institutions along the U.S. West Coast. However, all interested applicants will be considered.
The responsibilities of the OOIFB may include, but are not limited to, the following:
- Serving as the prime scientific and technical conduit between the oceanographic community and NSF regarding the OOI.
- Examining the accomplishments and work flow of the OOI Operator, in order to provide feedback regarding the OOI Annual Work Plans (AWPs).
- Via workshops, community meetings, and/or other mechanisms, stimulate and engage the user community in order to keep the accomplishments of the OOI at the cutting edge of scientific inquiry and technological innovation.
- Developing and implementing strategies to expand scientific and public awareness of the unique scientific and technological opportunities of the OOI.
Applications should be submitted to Annette DeSilva, at the OOIFB Administrative Support Office (desilva@ooifb.org), and must include a letter of interest and an academic CV. Applications are due by September 25, 2022. Applications will be reviewed by the OOIFB, who will give due consideration to the qualifications of applicants, as well as the maintenance of gender, career level, discipline, and regional balance on the OOIFB. For more information about OOIFB and its activities, please visit the website:https://ooifb.org or contact Kendra Daly, OOIFB Chair (kdaly@usf.edu).
45 Days of Discovery: RCA’s 8th O&M Expedition
The Regional Cabled Array (RCA) team left port in Newport, Oregon on August 5 aboard the global class research ship the R/V Thomas G. Thompson for a 45-day expedition. This is the eighth operations and maintenance cruise to the array, a network of 900 kilometers of electro-optical cables that crosses a tectonic plate and powers sensors on the seafloor and in the water column, including instrumented profiling platforms on moorings.
The expedition is such a complex operation that it will be conducted in five legs, with the ship returning to Newport to offload recovered equipment and load new and refurbished equipment for a subsequent leg. A scientific and engineering team of 26 from the University of Washington will be joined by an engineering team of 8 that will operate the remotely operated vehicle ROPOS, owned by the Canadian Scientific Submersible Facility. These groups will be joined by 28 students from the University of Washington, participating in the at-sea-experiential learning program, VISIONS, which provides undergraduate students opportunities to conduct research at sea using advanced oceanographic research instruments.
[media-caption path="/wp-content/uploads/2022/08/Thompson-leaving-dock.-FZqU5VxUYAAWUie-scaled.jpeg" link="#"]The R/V Thompson as it left the dock in Newport and headed towards the OOI Slope Base site for the first dive of this 45-day expedition. Credit: NSF-OOI/UW/V22.[/media-caption]There will be a live feed video for the duration of the expedition. “During the cruise, website visitors will be able to directly observe parts of the seafloor rarely seen by humans, including the most active submarine volcano off our coast ‘Axial Seamount’ located ~300 miles offshore and nearly a mile beneath the oceans’ surface,” said Deb Kelley, principal investigator of the RCA. “ Visitors will be able to witness one of the most extreme environments on Earth – underwater 700°F hot springs teaming with life that thrive on volcanic gases and that live in the complete darkness of the deep sea. The team will also visit the Cascadia Margin, spending time at Southern Hydrate Ridge where methane ice deposits are sometimes exposed on the seafloor. This hummocky, sediment-rich environment hosts a large number of areas where methane gas seeps from the seafloor feeding dense microbial mats that also host large clams. ROPOS will also visit shallower sites that are some of the most biologically productive areas in the world’s ocean.”
The 45-day expedition required an immense logistics operation with ~20 trucks transporting >130,000 lbs. of gear to Newport. During the cruise, the ROV will deploy and recovery a diverse array of >200 instruments, several small seafloor substations that provide power and communications to instruments on the seafloor and on moorings that span depths of 2900 m (9500 ft) to 80 m (260 ft) beneath the oceans’ surface. In addition, several novel, externally funded instruments developed by scientists in the US and Germany will be installed.
Follow along as the journey unfolds: Live video feed. Student Blog. Expedition updates.
Read More
Using Aircraft Expertise for Underwater Operations
Regional Cabled Array (RCA) Engineer Eric McRae came to the RCA Team with a 20+ year background keeping aircraft in the air, cars on the road, and medical devices safe. McRae worked on a Head-Up display and skid control and braking systems on some large commercial aircraft that are flying now. He also worked on a popular pacemaker/defibrillator for a medical instrument company. As a result of this experience, and long-term work in automotive engine control, McRae brought with him a mindset about correct behavior of control software to the RCA. He simply will not accept anything that is misbehaving. In the past, people’s lives were at stake, now it’s possible interruption of data collection or loss of scientific equipment.
McRae adopted his approach to help design and keep operational the Shallow Profilers on the RCA moorings which must work correctly for a year at a time in the cold, dynamic, and sometimes hostile, waters of the Pacific Ocean. The Shallow Profiler houses 10 scientific instruments and includes a winch that pays out power and communication cable allowing the science pod to rise through the water column to a depth below the surface determined by currents and wave conditions.
“I think that the Cabled Array Team is successful because many of us came from industries where it was not acceptable to produce something that could fail,” McRae explained. “We use this same mindset to figure out ways to make things work and keep them working even under the most difficult of circumstances.”
[media-caption path="/wp-content/uploads/2022/07/eric-selfie.png" link="#"]RCA Engineer Eric McRae stands with the components of one of the RCA Shallow Profilers that he programmed to successfully move up and down the water column in the Pacific since 2014. Photo: McRae.[/media-caption]From his first days at the RCA, Gary Harkins, his boss at the time, told McRae that his job was to make sure the Shallow Profiler was safe. “Safety was the top priority — not science, or anything else. Once we were sure the profiler could be operated safely, we could accomplish whatever the science mission wanted.” Initially, McRae worked with Dr. Doug Luther and Dr. Kendra Daly to understand how the science team wanted the profiler to run. Once he understood the science requirements, he worked with RCA’s mechanical designers to understand how they wanted to design the mechanical aspects of the system.
McRae then used his experience to influence the design and created a viable electronic control system that supports communications that keep the winch running and its science pod node traveling up towards the surface and back down nine times a day. A winched cable provides continuous power and communications to the science pod, allowing science and engineering data to flow to shore in real time. The mechanical design and control system have kept the Shallow Profiler operational since its launch in 2014.
[embed]https://vimeo.com/733359478[/embed]The control system continually “talks” to the winch and science pod to assess movement through the water. Near the bottom, the science pod doesn’t move very much, except for an occasional tilt caused by currents. As it gets close to the surface, however, surface waves can have a huge impact on how the profiler moves and how much tension is on the cable. The science pod weighs ~900 pounds in air so when it gets moving back and forth underneath waves, it could significantly stress the cable. To prevent this from happening, the science pod “reports” three times a second to the control system about the conditions it is experiencing. These reports include acceleration, rotation, proximity to the surface, wave length, and a slew of other variables so that needed adjustments can be made automatically to keep the winch and ultimately its valuable science pod “safe.” If conditions warrant, the control system has the capability of aborting a running profile and/or parking the science pod near the mooring to wait things out.
The Shallow Profiler is often on the move. Each of the nine daily profiles take between one and a half to two and a half hours, depending on the profile type and ocean conditions. There’s a gap of about 30 to 45 minutes between profiles, where the science pod is parked down near the mooring platform. During that time, the controller is constantly monitoring the waves on the surface. McRae developed an algorithm to look at the worst-case peak to trough wave pressure so that when the profiler starts up for a run towards the surface, it has already calculated what it thinks the worst wave height combination will be. The original requirements of the system were that the science pod can go no closer to the surface than five meters or three wave heights, whichever is greater, so when it starts up, it already knows the ceiling for the coming profile.
“As designed, the profiler is smarter than we are. It makes seven decisions three times a second to ensure that it is on the right path and has accounted for all predictable conditions” McRae said.
Of course, there are other hazards besides ocean conditions. In September of 2017, a trawler’s net hit the mooring line at the Oregon Offshore site and eventually the mooring platform itself, pulling the 14,000-pound mooring and its two huge anchors from the seafloor. The profiler was running at the time and recorded the action until the boat pulled hard enough that the seafloor cable came unplugged. There has also been a smattering of mechanical issues, but the system has matured nicely. Should something unexpected go wrong in the future, McRae has programmed the profiler to take “evasive” action, then notify him and his team on land. This performance record demonstrates that not only did McRae’s work help keep the profiler safe, it helped make it a reliable component of the RCA that scans through the water with ease. The three profilers have made >40,000 profiles since 2015, making unprecedented measurements of ocean parameters.
Read More
Despite Weather, Irminger 9 Met Objectives
The R/V Neil Armstrong departed Woods Hole, Mass., on June 20. Under the direction of Chief Scientist Sheri N. White of Woods Hole Oceanographic Institution (WHOI), the 14-member science party headed to OOI’s Global Irminger Sea Array for the ninth time to recover and deploy moorings and gliders and carry out scientific sampling. Nearly a month later, the ship and science party pulled into the port of Reykjavik, Iceland, on July 16th, having accomplished all of its objectives.
“The Irminger Sea can be a challenging environment to work in. Storms with high winds and seas regularly move through the area, and these conditions can limit our mooring recovery and deployment operations,” said Chief Scientist Sheri N. White. “We were lucky to have relatively good weather conditions during our cruise, and adjusted our schedule when needed when storms passed through. Thanks to an excellent team – the ship’s crew and shipboard science technicians, the mooring operations team, and OOI and OSNAP teams – we able to accomplish all of our goals. My huge thanks to everyone on the ship and all of our shore-side support for all of their efforts.”
In addition to ten OOI personnel, the team was rounded out by three members from OSNAP (Overturning in the Subpolar North Atlantic Program) and a marine mammal observer from the National Oceanic and Atmospheric Administration.
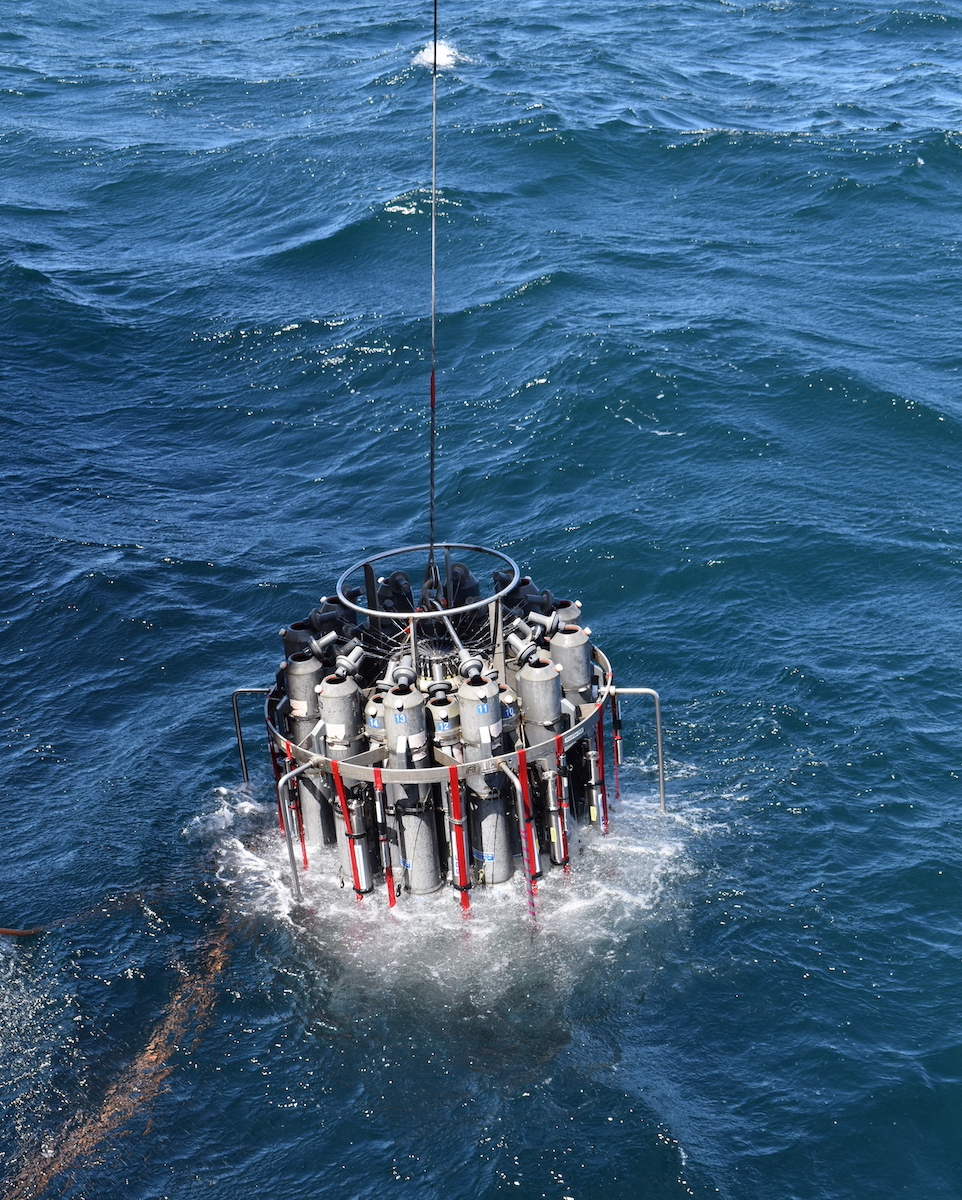
For OOI, the team successfully recovered and deployed a Surface Mooring, Hybrid Profiler Mooring, and two Flanking Moorings, and deployed two new Irminger Sea gliders. For OSNAP, the team recovered and deployed four new moorings, replacing those originally deployed in the Summer 2020. The team also conducted CTD casts with salinity, oxygen, carbon, nutrient and chlorophyll water sampling. These sampling measurements are used for instrument validation and to further characterize the region of the moored array.
Why the Irminger Sea?
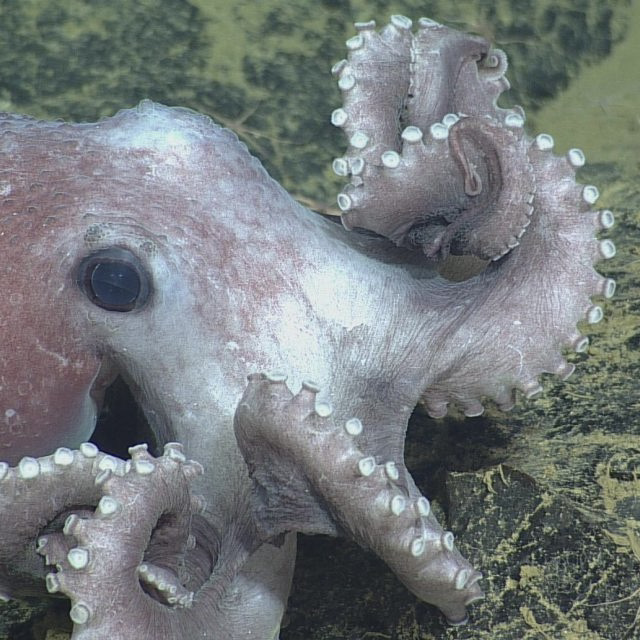
The Global Irminger Sea Array is off the southeast tip of Greenland, close to 39°W, 60°N. Data from this location are improving understanding of the impact of natural and climate variability in the region. The location experiences strong air-sea interaction and wintertime water mass formation that supports the global thermohaline (a.k.a. meridional overturning circulation – MOC). In recent years, a freshening of the water column has been observed.
The combination of the moored array and the gliders in the Irminger Sea enables investigation into the role of ocean processes at mesoscale and sub-mesoscale horizontal length scales through observations that sample the full water column, from the sea floor to the sea surface. The Surface Mooring provides a unique time-history of observations of surface meteorology and air-sea fluxes.
A Look at Life at Sea
The following and in the sidebar to the right is an assortment of activities onboard the Armstrong during the month of July. Other images and stories can be found here.
[media-caption path="/wp-content/uploads/2022/07/Pete_bow.jpeg" link="#"]Whale sightings: Marine mammal observer Peter Duley spent many hours on deck looking for marine mammals. He observed Humpback, Beaked, Sei, and Fin whales, as well as orcas, harbor porpoise and common dolphins. Credit: Sheri N. White © WHOI.[/media-caption] [media-caption path="/wp-content/uploads/2022/07/pilot-whales_sm-2048x1365-1.jpeg" link="#"]Pod came to visit: A pod of pilot whales on a foggy day in the Irminger Sea. Credit: Peter Duley, NOAA.[/media-caption] [media-caption path="/wp-content/uploads/2022/07/Glider_DSC_0381.jpeg" link="#"]Glider missions: Gliders have two missions at the Irminger Sea Array. They travel around the triangular array to collect data (temperature, salinity, fluorescence and dissolved oxygen) in between the moorings. And, they pass the data from the subsurface mooring to shore. When they come to the surface, they send their data and the subsurface mooring data back to shore via satellite. Credit: Sawyer Newman©WHOI.[/media-caption] Read MoreSubmit an Abstract to OOI’s Session at AGU

 OOI is hosting a session at the Fall 2022 AGU Meeting in Chicago entitled: OS019. Process Studies, Educational Activities and Technological Advancements Using Data and Infrastructure from the Ocean Observatories Initiative (OOI). All are encouraged to submit an abstract to share your innovative research, technology, and educational approaches that use OOI data.
Below are submission details:
Session Title: OS019. Process Studies, Educational Activities and Technological Advancements Using Data and Infrastructure from the Ocean Observatories Initiative (OOI)
Direct Link to Session: https://agu.confex.com/agu/fm22/prelim.cgi/Session/161994
Abstract Submission Deadline: Wednesday, 3 August 2022 at 23:59 EDT
Session Abstract:
The NSF’s Ocean Observatories Initiative (OOI) is an integrated network that enables scientific investigation of interlinked biogeochemical and physical processes throughout the global ocean. We invite presentations that investigate all aspects of ocean observatory science using data and infrastructure (physical and cyber) from the OOI and related observing systems. The OOI is comprised of coastal and global arrays that support surface moorings, bottom landers, profilers and gliders; as well as a regional cabled array that spans the seafloor and water column with cabled moorings and seafloor nodes. The OOI data delivery and QC systems have been continuously improved with input from the user community. The OOI data already provide decade long time series with broad spatial coverage that enables investigations of marine processes, event detection, and climate assessment. We particularly encourage new and innovative research and educational approaches that rely on ocean observatory systems with an emphasis on the OOI.
Session Co-chairs:
James Edson, Edward Dever, Deborah Kelley, Albert Plueddemann, Anthony Koppers
Read MoreMeasurements Below the Surface
Strong winds and large waves in remote ocean locations don’t deter the Ocean Observatories Initiative (OOI) from collecting measurements in spite of such extreme conditions. By moving the moorings below the surface, the OOI is able to secure critically important observations at sites such as the Global Station Papa Array in the Gulf of Alaska, and the Global Irminger Sea Array, south of Greenland. These subsurface moorings avoid the wind and survive the waves, making it possible to collect data from remote ocean regions year-round, providing insights into these important hard-to-reach regions.
Instrumentation on the surface mooring in the Irminger Sea, however, has nowhere to hide and the measurements they provide are also often crucial for investigations, such as net heat flux estimates. Providing continuous information about wind and waves remains one of the most challenging aspects of OOI’s buoy deployments in the Irminger Sea. Fortunately, with each deployment, OOI is improving the survivability of the surface mooring so they continue to add to the valuable data collected in the region by their subsurface counterparts.
[media-caption path="/wp-content/uploads/2022/07/FLMB-9_DSC_0934.jpg" link="#"]The top sphere of a Flanking Mooring being deployed through the R/V Neil Armstrong’s A-Frame. Credit: Sawyer Newman©WHOI.[/media-caption]Below the surface in the Irminger Sea
A team of 15 OOI scientists and engineers spent the month of July in the Irminger Sea aboard the R/V Neil Armstrong, recovering and deploying three subsurface moorings there, along with other array components. The Irminger Sea is one of the windiest places in the global ocean and one of few places on Earth with deep-water formation that feeds the large-scale thermohaline circulation. Taking measurements in this area is critical to better understanding changes occurring in the ocean.
OOI’s Irminger Sea Array also provides data to an international sampling effort called OSNAP (Overturning in the Subpolar North Atlantic) that runs across the Labrador Sea (south of Greenland), to the Irminger and Iceland Basins, to the Rockall Trough, west of Wales. The OOI subsurface Flanking Moorings form a part of the OSNAP cross-basin mooring line with additional instruments in the lower water column. During this current expedition, the Irminger Team will be recovering and deploying OSNAP instruments that are included as part of the OOI Flanking moorings, in addition to turning several OSNAP moorings as well.
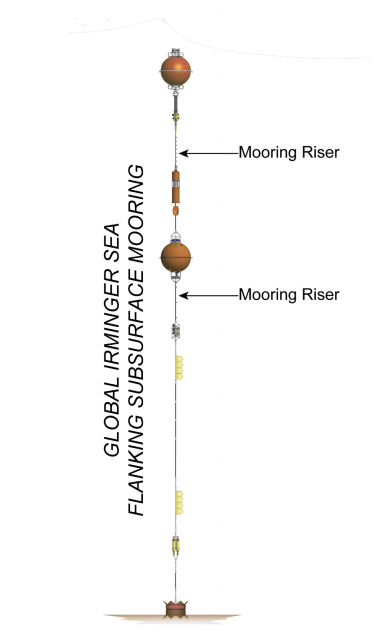
[media-caption path="/wp-content/uploads/2022/07/FLMB-9_DSC_0941.jpg" link="#"]The Flanking Mooring top float in the water during deployment. The sensors mounted in the sphere will measure conductivity, temperature, fluorescence, dissolved oxygen and pH at 30 m depth. Credit: Sawyer Newman©WHOI.[/media-caption]The triangular array of moorings in the Irminger Sea provide data that resolve horizontal variability, how much the physical aspects of the water (temperature, density, currents) and its chemical properties (salinity, pH, oxygen content) change over the distance between moorings. The individual moorings resolve vertical variability – the change in properties with depth. Three of these moorings are entirely underwater, with no buoy on the surface. They do have, however, multiple components that are buoyant to keep the moorings upright in the water column.
[media-caption path="/wp-content/uploads/2022/07/FLMB-9_DSC_0984.jpg" link="#"]The mid-water sphere holds an ADCP instrument which will measure a profile of water currents from 500 m depth to the sea surface. Photo Credit: Sawyer Newman©WHOI.[/media-caption]Each subsurface mooring has a top sphere at 30 m depth, a mid-water sphere at 500 m depth, and back-up buoyancy at the bottom to ensure that the mooring can be recovered if any of the other buoyant components fail. Instruments are mounted to the mooring wire to make measurements throughout the water column.
[media-caption path="/wp-content/uploads/2022/07/FLMB-9_IMG_5328.jpg" link="#"]Glass balls in protective “hard hats” provide extra flotation at the bottom of the mooring. Their tennis ball yellow color looks almost fluorescent in the brief (and much enjoyed) sunshine. Photo Credit: Sheri N. White©WHOI.[/media-caption] Read More