
Program Updates
Oceanography Magazine OOI Special Issue

The Ocean Observatories Initiative (OOI) is beginning work to compile a special issue of Oceanography Magazine centered around the OOI and research conducted using its data. Within the special issue, we would like to include articles written by you, our OOI user community, on your research using OOI data.
Read MoreMembership of Inaugural OOI Facility Board (OOIFB)
Dear Colleagues:
The Division of Ocean Sciences (OCE) of the National Science Foundation (NSF) recently requested nominations, including self-nominations, for inaugural Members to serve on the newly established “Ocean Observatories Initiative Facility Board” (OOIFB). The OOIFB will provide input and guidance regarding the management and operation of the Ocean Observatories Initiative (OOI). OCE’s request for potential Members was made via a “Dear Colleague Letter” (NSF 17-034) and included the Terms of Reference of the OOIFB. Briefly, the Terms of Reference call for 7 non-conflicted scientists as well as 2 members from the operator(s), for a total of 9 persons.
We thank the many members of the community who expressed interest in serving or who nominated persons for consideration. After deliberation and paying very close attention to the entire array of candidates with an eye towards ensuring a balanced membership on the OOIFB itself, and considering the potential for memberships on inaugural subpanels in the near future, OCE is pleased to announce the following membership. The first meeting of the OOIFB is likely to be in late spring, and further announcements will be forthcoming.
In the below alphabetical-order list, Larry Atkinson has graciously agreed to serve as Chair. The two members from the operators are Deborah Kelley and Sheri White.
- Larry Atkinson (Chair), Old Dominion University
- Tim Crone, Lamont Doherty Earth Observatory
- Kendra Daly, University of South Florida
- Sarah Gille, Scripps Institution of Oceanography
- Brian Glazer, University of Hawaii
- Ruoying He, North Carolina State University
- Deborah Kelley, University of Washington
- James O’Donnell, University of Connecticut
- Sheri White, Woods Hole Oceanographic Institution
We look forward to working with the OOIFB and the oceanographic community as OOI continues to move forward.
Regards,
Rick Murray
Director, Division of Ocean Sciences
NSF
Workshop Report: Southern Hydrate Gordon Conference

This report summarizes discussions from a mini-workshop held after the Gordon Research Conference (GRC) on Natural Gas Hydrates March 4-5, 2016. The workshop was focused on opportunities presented by the Ocean Observatories Initiative (OOI) Cabled Array at Southern Hydrate Ridge.
Further information on the conference can be found on the conference website.
Download the full report here.
Read MoreUNOLS hosts Workshop Focused on OOI’s North East Pacific Arrays
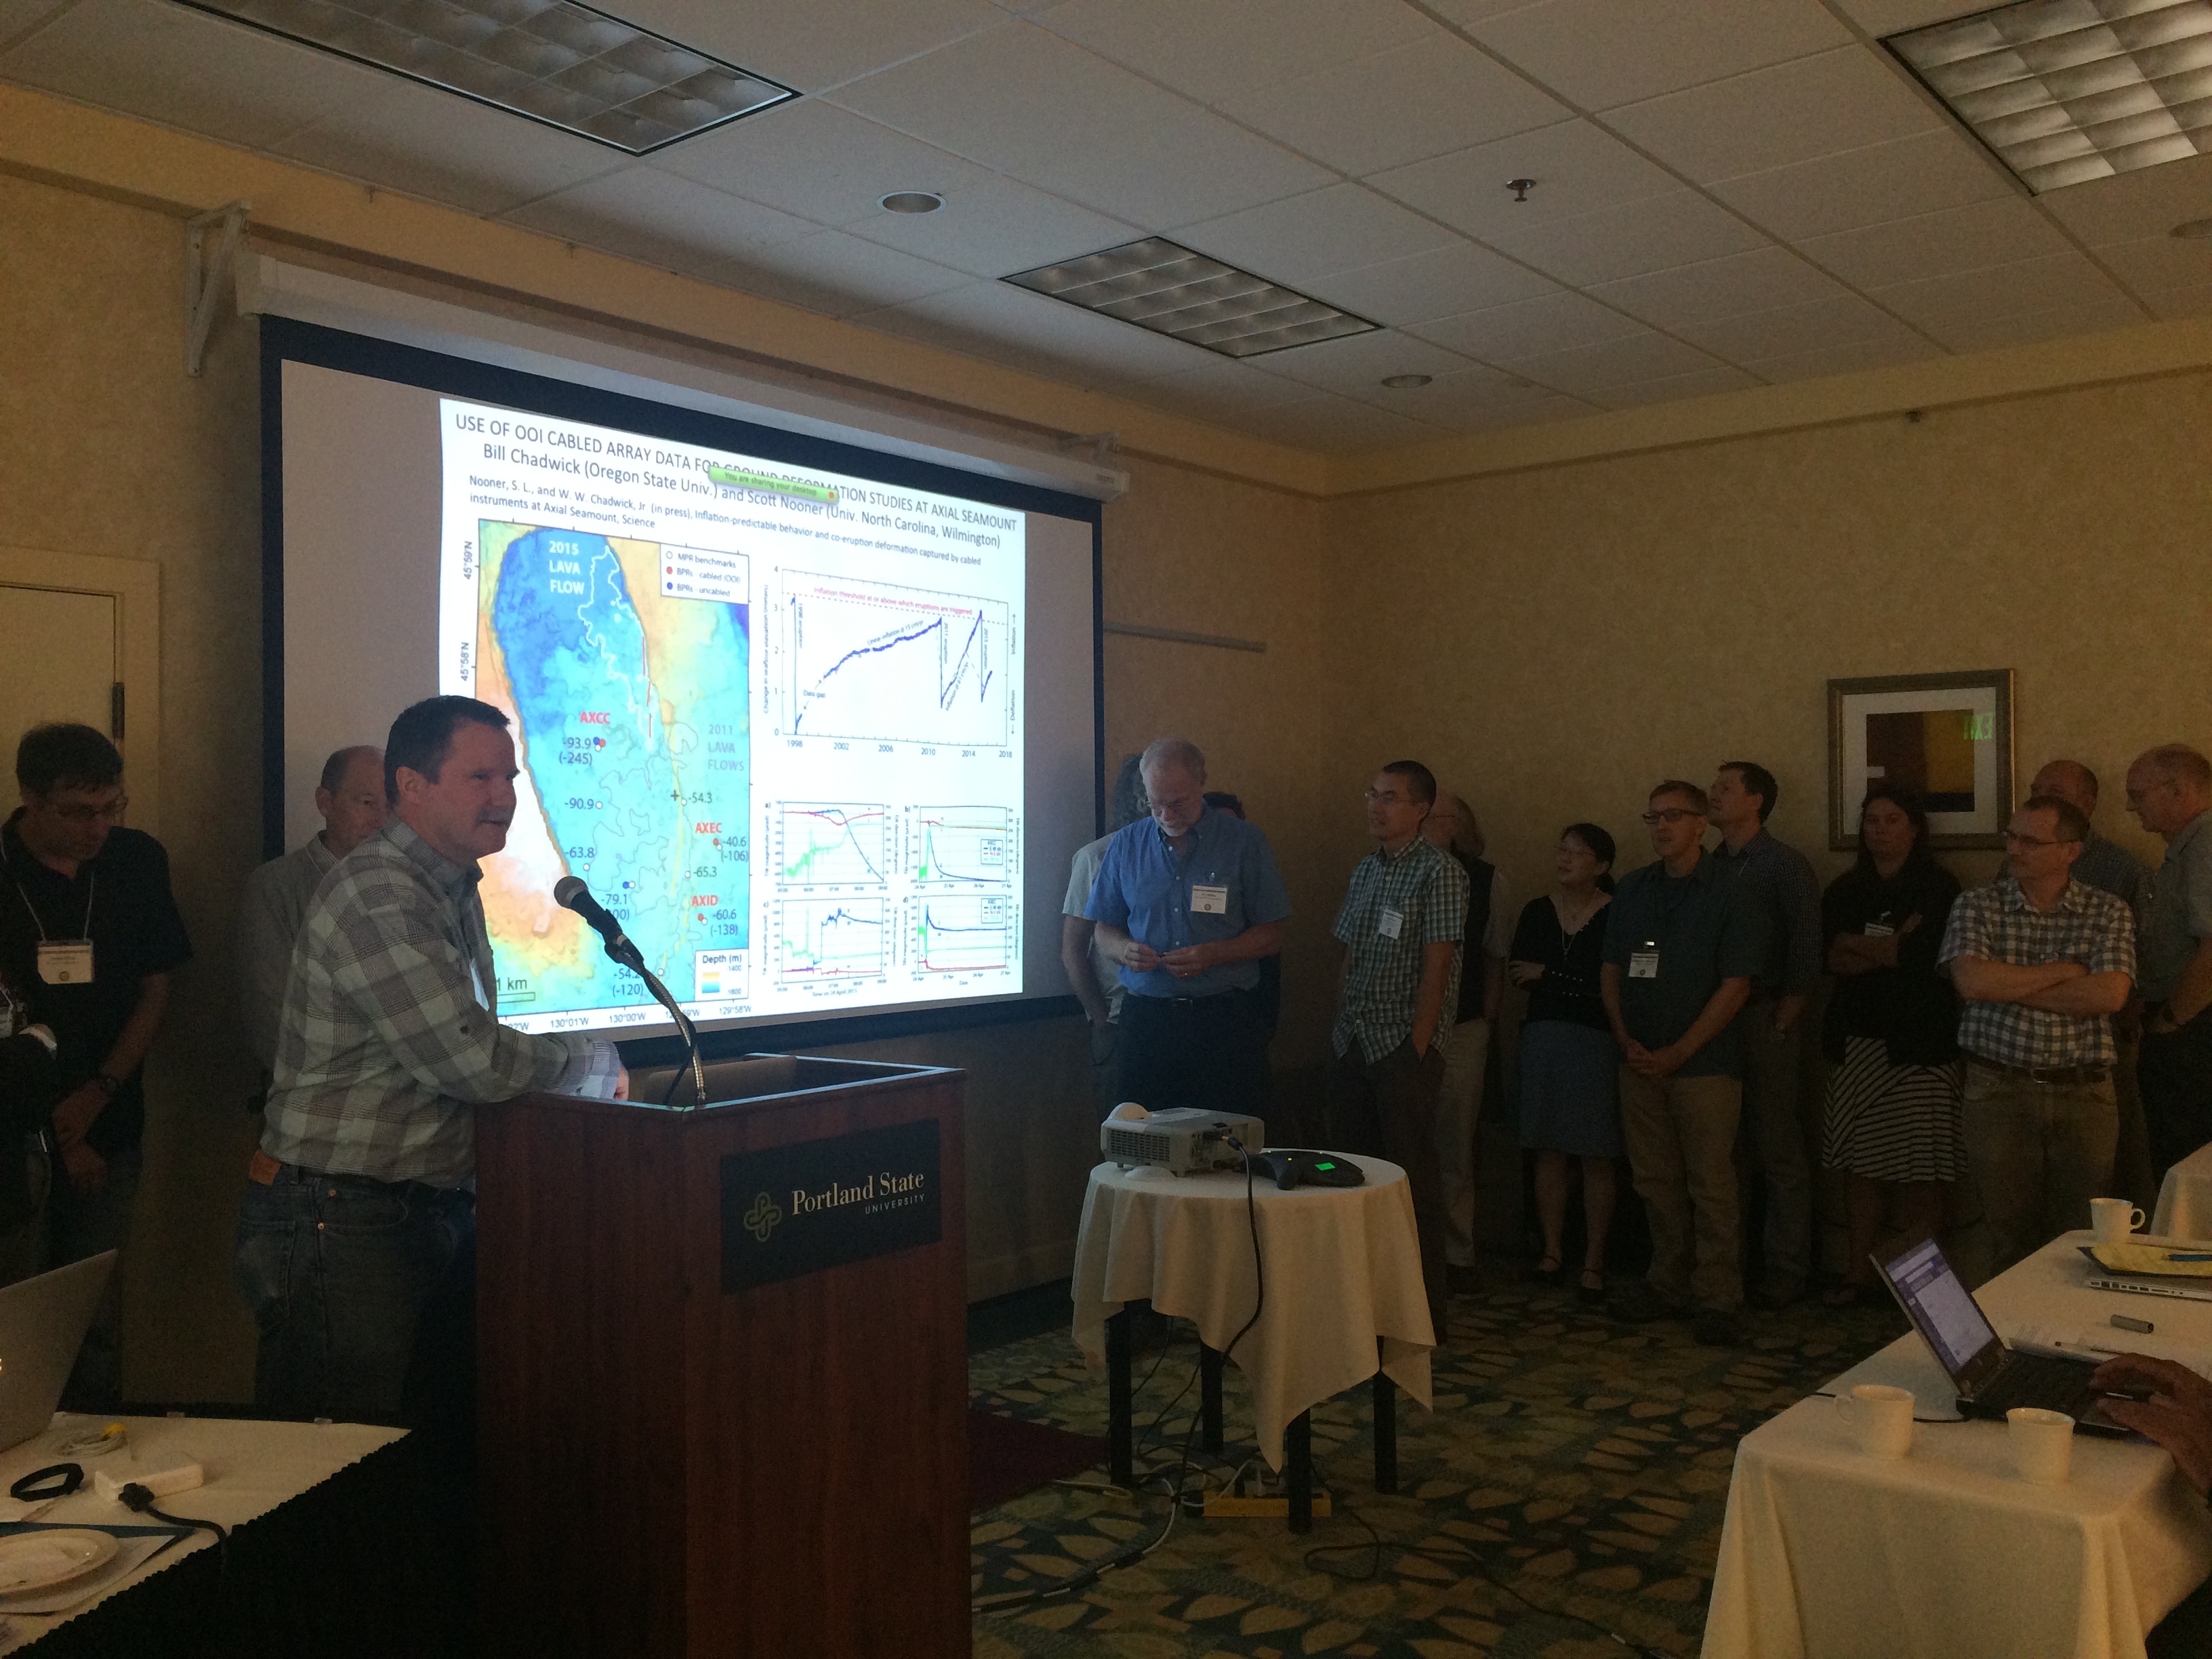
The University-National Oceanographic Laboratory System (UNOLS) hosted a recent workshop in Portland, OR focused on the current and future science that can be addressed by the extensive OOI infrastructure operational in the Northeast Pacific.
Read MoreOOI Data Portal Updated
Over the last month we have been working on improving and streamlining the OOI User Interface based on your feedback. As of this morning, the new user interface officially replaced the old one on ooinet.oceanobservatories.org.
Read MoreUpdated OOI User Interface now Live for Testing & Feedback
OOI User Community and Colleagues,
We have been working on some improvements and streamlining of the OOI User Interface. Changes have been made to the format and functionality of the initial landing page, platform information pages, plotting capabilities, and data catalog. Hopefully these changes result in improved usefulness of the site and upgraded ability of users to locate and use data of interest.
[button link="https://ooiui.oceanobservatories.org/"]Preview the new OOI User Interface[/button]We are making the new site available now in order to get feedback on user experiences before it officially replaces the existing user interface.
Please send any feedback or recommendations to help@oceanobservatories.org no later than September 16th.
The site will continue to be enhanced and more capabilities will be added over the next few months as our list of planned upgrades are completed. We also plan to continue upgrading the site based on your user feedback. The existing user interface is still available (here). You may continue to send feedback after the 16th, but we will use the information we receive before then to determine how we proceed with the next phases of the new GUI rollout.
Note that the preview site is using a temporary URL (ooiui.oceanobservatories.org), when the new GUI goes live it will replace the current site (ooinet.oceanobservatories.org).
As you explore the site, please note that there are a few known issues to be aware of during testing. You are free to test any areas of the site, but there is already work underway on the following items:
- Landing page array maps are being updated to include detailed bathymetry and as-designed locations of individual platforms to provide a better idea of where assets are deployed.
- While searching through the data, you may encounter some blank location, depth, or deployment fields. This is due to an overhaul of asset management information behind the scenes.
- Plotting of acoustic data (e.g. ADCP) using binned pseudocolor plots is a work in progress. The option is available, but results may not be formatted correctly.
- Currently only parameters from a single data stream can be shown on a single plot. If you attempt to add parameters from another instrument or multiple streams, you will receive an error message indicating the lack of interpolation functionality.
- Platform-level visualization of status information for instruments in the water using a standard color-code is in progress but not yet implemented.
- A History and Status page for mobile assets (gliders and AUVs) is under construction. This page will allow for visualization of ideal glider lines and actual glider tracks based on GPS position.
- A site tour overlay for the new site’s functionality is being prepared, and will be added to based on your feedback.
Thank you,
OOI Graphical User Interface Team
OOI Monthly Update – May 2016 & World Ocean Day
Letter from the Director
OOI User Community and Colleagues,
Welcome to another edition of our OOI Monthly Newsletter. LOTS to cover this month, including achievement of a major program milestone and some exciting media coverage which highlights recent OOI developments and our program’s play in World Ocean Day.
Our OOI Cyber Infrastructure (CI) capabilities take a major leap forward this month with the release last week of our full suite of data delivery and display tools and a great improved User Interface (UI). And, the data team remains hard at work, continually coming bringing more data to you through the OOI data portal.
I encourage all of our many users to try out these new features and, as always, to keep the great feedback coming in to the HelpDesk. Your ongoing inputs are critical for us to identify and correct errors and make continual improvements to the data portal and other areas on the OOI website.
This month we’ve got yet another round of “turn cruises” getting underway, as our Implementing Organizations continue heading to sea to replace OOI instruments as a regular part of life cycle management.
Our summer season is off to a busy start, and I don’t see any slowdowns on the horizon!
Stay with us, and stay engaged.
Greg
Happy World Ocean Day
From everyone at the Ocean Observatories Initiative, we hope that you all had a great World Ocean Day and perhaps were able to celebrate the day by exploring the ocean through OOI online data.
Bring the Ocean into Your Home: Exploration is one click away
When the HMS Challenger set sail in 1872, researchers made discoveries that laid the foundation of the science of oceanography. These early scientists couldn’t have imagined that more than a century later, the secrets of the sea could be discovered by almost anyone, even those thousands of miles from the coastline.
Today with the National Science Foundation (NSF)-funded Ocean Observatories Initiative (OOI), the ocean is accessible 24 hours a day, 7 days a week to anyone with an Internet connection.

“The OOI is placing as much ocean data online as possible and making it available in real-time,” says Roger Wakimoto, NSF Assistant Director for Geosciences. “In addition to scientific discovery, we hope to spark the public’s interest in the sea and contribute to the safety of those who make their living on the water or vacation along the coast.”
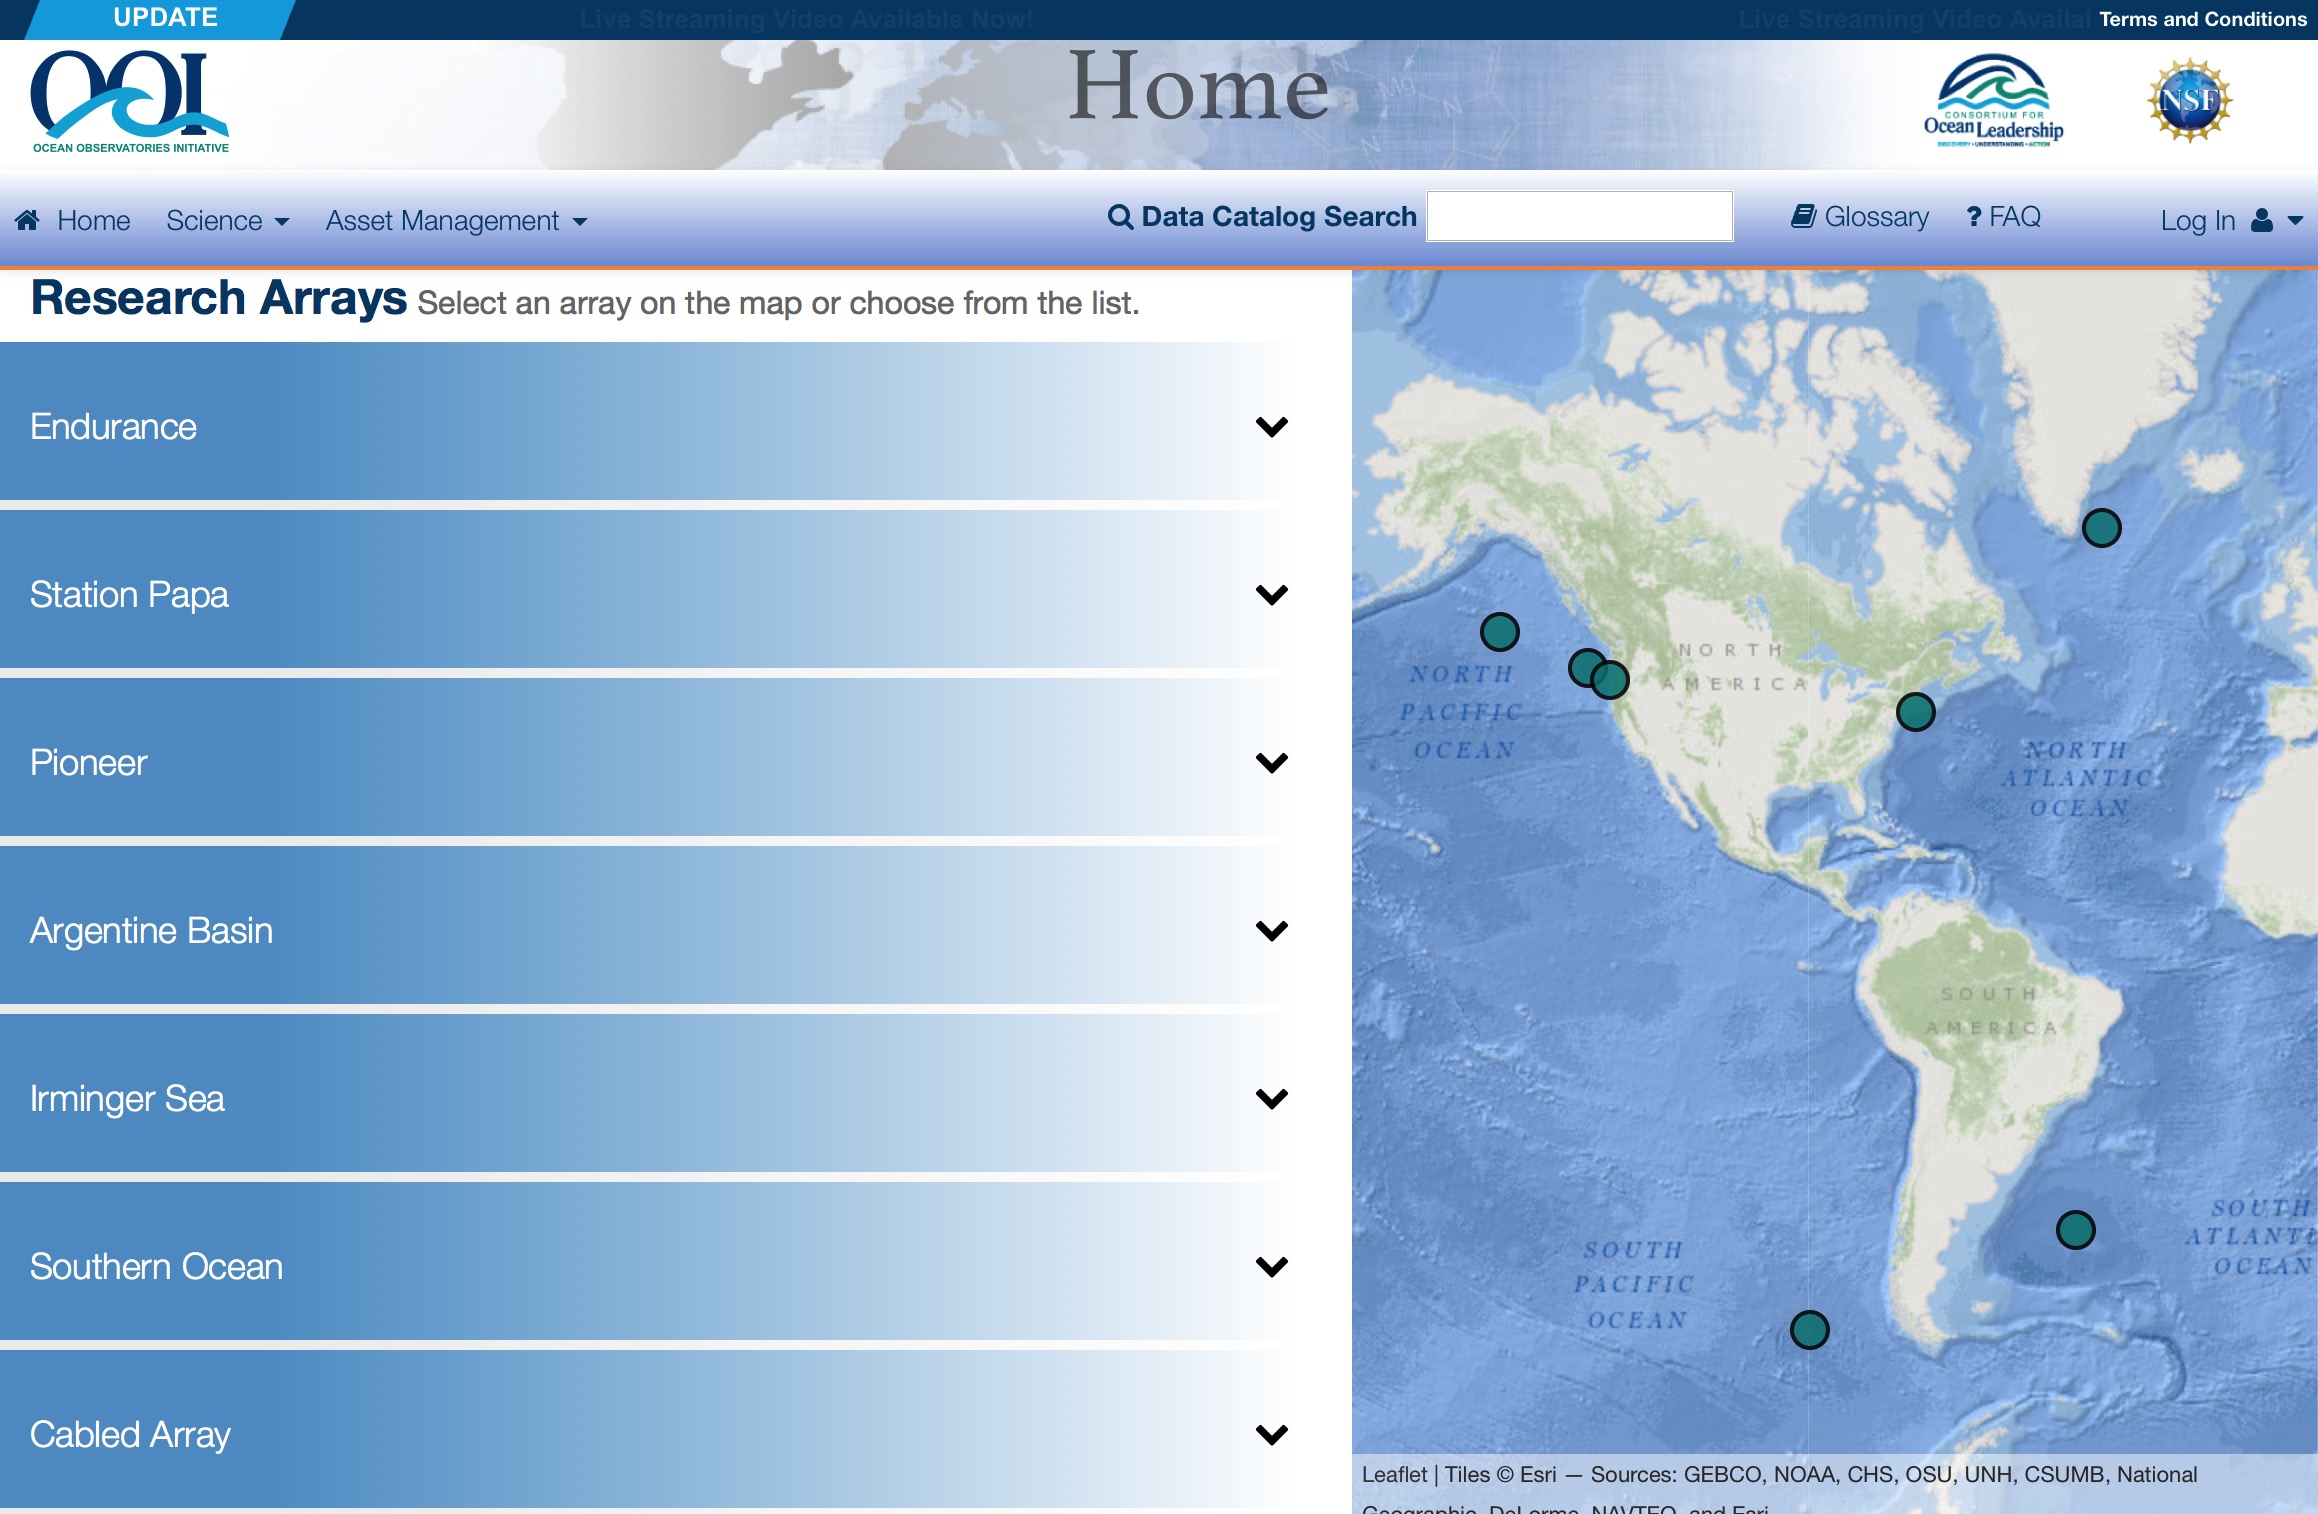
The OOI is a permanent scientific presence in the ocean. It consists of 83 platforms with more than 830 instruments providing more than 100,000 scientific and engineering data products. These platforms and instruments are spread across seven arrays located in the Atlantic and Pacific Oceans.
The OOI Data Portal opened its doors for the first time in early January to allow users -scientists, educators, and the public – to freely access OOI data. Over the past five months, the quantity of data available and tools for downloading and plotting data have steadily increased, and the OOI continues to expand its data availability.
“Much like the Challenger crew, the OOI is employing new technology that we hope will revolutionize our understanding of the ocean,” says Greg Ulses, the OOI Director at the Consortium for Ocean Leadership, which manages the OOI Program for NSF. “We are doing that by focusing on our online data delivery. We live in a time of constant Internet connection – your computer, your tablet, your phone – so we’re giving people access to the ocean by meeting them where they are, online.”
Data from the OOI will foster scientific advancements by helping researchers gain a better understanding of earthquakes and shifts in tectonic plates; hydrothermal vent and methane seep species; climate and weather phenomena such as El Niño; ocean acidification; the upwelling that fuels productive coastal fisheries; and the links between ocean circulation and climate.
Scientists aren’t the only ones benefitting from the OOI. A suite of online tools, including data visualization exercises and lesson plans, allows educators to engage students in scientific inquiry on oceanographic concepts. In addition, commercial or recreational fishers may monitor offshore conditions by checking data from nearby buoys.
Anyone with an Internet connection can download and view plots of OOI data from all arrays, or watch a live-streaming, high-definition video from a hydrothermal vent 250 miles off the coast of Oregon.
Tales of krakens, whirlpools, and passages to foreign lands have long united people and kindled interest in the mysterious forces of the sea. This year on World Oceans Day and beyond, celebrate by connecting with the ocean live – without even getting wet.
[button link="http://www.nsf.gov/news/news_summ.jsp?cntn_id=138708&org=NSF&from=news" bg_color="#00a9dd" border="#004377" class="bigbutton"]Full Story[/button]Current OOI Data Availability
Streaming data from OOI cabled assets (Cabled and Endurance Array) can now be viewed online, in near-real time, through the Data Portal plotting feature. All the data ingested into OOINet continues to be available for plotting in the OOI Data Portal. Please note that ingestion is an early step in the full data flow process and these data have not yet gone through the quality control process. To view what has been ingested, click here to access the operator status tool. Asynchronous downloads of NetCDF files have also been enabled on the OOI Data Portal.
On the OOI Website, links can be found to download raw data sets through an online repository. Please note that in the coming weeks, as we continue to update our raw data delivery mechanisms, these OPeNDAP links may change. Additionally, data sets continue to be downloadable through the THREDDS Server and are now organized by array. Data are currently available for all arrays and include several comprehensive data sets for individual gliders, moorings, and profilers. Live Video from Axial Seamount can be viewed online every 3-hours and previously recorded videos can be downloaded from the archive.
Historical cruise data are available for download from the OOI website. And we continue to provide interim delivery of the Cabled Array seismometer and bottom pressure data through IRIS http://www.iris.edu/hq/. Delivery of Cabled Array tilt meter and co-located temperature plots continue through Dr. Bill Chadwick’s website.
Recent Deployments
Endurance Array maintenance cruise departed Newport OR May 4th on the R/V Thomas Thompson. Over the course of 14 days the crew successfully recovered and re-deployed six surface moorings and one wire-following profiler mooring. Additionally one surface piercing profiler mooring was deployed along with three coastal gliders.
[media-caption type="image" path="/wp-content/uploads/2016/06/IMG_5669-623x350.jpg" alt="Coastal Endurance Washington Inshore Surface Piercing Profiler Mooring pierces calm surface waters after deployment. Photo Credit: Jon Fram and Linda Fayler, Oregon State University" link="#"]Coastal Endurance Washington Inshore Surface Piercing Profiler Mooring pierces calm surface waters after deployment. Photo Credit: Jon Fram and Linda Fayler, Oregon State University[/media-caption]Pioneer Array 6 Cruise on the R/V Neil Armstrong out of Woods Hole Oceanographic Institution was a success with the recovery and re-deployment of Pioneer Array moorings and gliders. The cruise was made up of three legs spanning from May 12th to June 2nd. Separating the cruise into legs was essential to allow for enough space on the ship to house the eight recovered moorings and one glider as well as the nine moorings and four gliders set for deployment. In addition to the infrastructure maintenance activities, two AUVs were tested during the cruise, running missions in the area of the moored array.
Read MoreOOI Monthly Update – April 2016
Letter from the Director
OOI User Community and Colleagues,
Welcome to another edition of our OOI Monthly Newsletter. In this edition we’re going to continue to highlight the great work being done by the OOI CI and Data Teams. As I’ve discussed in previous newsletters our primary focus remains completing the roll out of the full data delivery capability of our OOI Cyber Infrastructure (CI). However, even as that work continues more data is continually coming on line and being made available through the OOI data portal. In this issue you’ll find another detailed update of current data availability. We’ll be continually adding accessible data to the portal until we complete the development of the final CI data delivery baseline in late May.
Speaking of data delivery, I’d like to call out special attention to our first featured news article which highlights an early and major “win” for the Data and CI Teams: the release of raw OOI data through the data portal. This critical capability has been much in demand from our user community, and we’ve already seen a strong and steady pull of raw data since our team made it available in April. Get on the data portal and have a look!
You’ll also see in this month’s newsletter that May will mark the start of the annual “cruise season” for OOI, when our Implementing Organizations head to sea to replace OOI instruments as a regular part of life cycle management. One constant in OOI is that every team involved will always stay busy!
Thanks everyone, for your continued interest in OOI. Please continue to use our data portal, and keep the great feedback coming in to the HelpDesk. Your ongoing inputs are critical for us to identify and correct errors and make continual improvements to the data portal and other areas on the OOI website. Stay with us, and stay engaged.
-Greg
Featured News
Raw Data Now Available for Download
Raw Data Access for all OOI Arrays is now available from the OOI Website, and can be accessed here. Further details and file organization structure information can be found on the OOI website.
Welcome Aboard the R/V Neil Armstrong
Welcome the newest member of the nation’s research vessel fleet, the R/V Neil Armstrong! Christened after the legendary explorer Neil Armstrong, the new ship will seek to follow his legacy of exploration and scientific discovery.
The OOI was excited to be amongst the first to use this vessel as the R/V Armstrong recovered two OOI Moorings during its “Science Verification III (SVC III)” Cruise from Virginia to Woods Hole, MA. These moorings were the Coastal Pioneer Array Central Surface Mooring and Upstream Inshore Profiler Mooring located on the continental shelf south of Martha’s Vineyard.
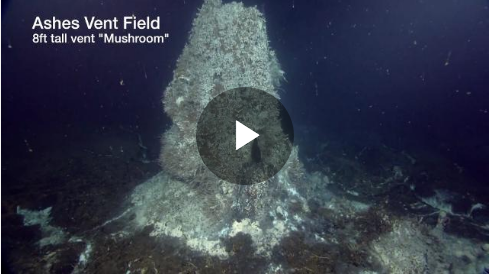
Live Video from Axial Seamount
Every 3-hours from 250 miles off the Oregon coast, and 1 mile underwater, HD video streams in live over the Internet through the OOI’s Cabled Array in situ camera system. Live video streams of a ~14 ft tall, actively venting hydrothermal vent occur during the hours of 2:00, 5:00, 8:00, and 11:00 ET & PT day and night, for a duration of 14 minutes.
Current OOI Data Availability
Streaming data from OOI cabled assets (Cabled and Endurance Array) can now be viewed online, in near-real time, through the Data Portal plotting feature. All the data ingested into OOINet continues to be available for plotting in the OOI Data Portal. Please note that ingestion is an early step in the full data flow process and these data have not yet gone through the quality control process. To view what has been ingested, click here to access the operator status tool. Asynchronous downloads of NetCDF files have also been enabled on the OOI Data Portal.
On the OOI Website, links can be found to download raw data sets through an online repository. Please note that in the coming weeks, as we continue to update our raw data delivery mechanisms, these OPeNDAP links may change. Additionally, data sets continue to be downloadable through the THREDDS Server and are now organized by array. Data are currently available for all arrays and include several comprehensive data sets for individual gliders, moorings, and profilers. Live Video from Axial Seamount can be viewed online every 3-hours and previously recorded videos can be downloaded from the archive.
Historical cruise data are available for download from the OOI website. And we continue to provide interim delivery of the Cabled Array seismometer and bottom pressure data through IRIS http://www.iris.edu/hq/. Delivery of Cabled Array tilt meter and co-located temperature plots continue through Dr. Bill Chadwick’s website.
Upcoming Deployments
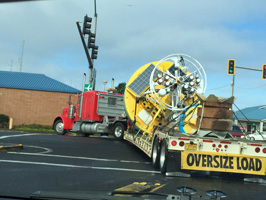
 Endurance Array maintenance cruise will depart Newport OR May 5th on the R/V Thomas Thompson. This deployment is part of the twice-per-year maintenance cruises to turn around the coastal arrays off Newport, Oregon, and Grays Harbor, Washington. To get to the coast from Corvallis, the moorings head down the 101, catching a ride on a tractor trailer.>
Pioneer Array 6 Cruise on the R/V Neil Armstrong will depart Woods Hole Oceanographic Institution on May 12 for a recovery/turn of OOI moorings and gliders.
Read MoreOOI Status Update: Raw Data Now Available
Raw Data Access for all OOI Arrays is now available from the OOI Website, and can be accessed here.
Files within this page are organized using the following file hierarchy:
-
- Uncabled Assets: Site –> Deployment (e.g. D00001) –> Data Logger –> Instrument/Profiler
- Cabled Assets: Site –> Node
For help translating the directory structure, please refer to the list of Site-Platform Codes and Instrument Class Codes.
“Raw” indicates data as they are received directly from the instrument, in instrument-specific format. They may, depending on the instrument, contain data for multiple sensors (interleaved), be in native sensor units (e.g., counts, volts) or have some processing steps already performed. Some of the configuration files associated with the raw data streams are included with those data in the raw data repository.
Please note that though all OOI Raw Data are stored by OOI, they may be available through another website, such as the low-frequency hydrophones and seismometer data, which is available via the IRIS website.
OOI platform and instrument metadata and calibration data to supplement these raw data are accessible via the Asset Management page of the OOI Data Portal.
Additional information can be found on the Raw Data page. If you are not able to find what you are looking for or having any questions, please ask the HelpDesk.
Read MoreOOI Monthly Update – March 2016
Letter from the Director
OOI User Community and Colleagues,
Welcome to this inaugural edition of our OOI Monthly Newsletter. I hope that you all will enjoy it as much and find it as useful as I did! As you’ll see in this edition the OOI Team remains hard at work. Our primary focus remains completing the roll out of the full data delivery capability of our OOI Cyberinfrastructure (CI). However, even as that work continues more data is continually coming online and being made available through the OOI Data Portal. You’ll find a detailed update of current data availability in this issue, as well as an update on the overall state of our CI work. We’ll be continually adding accessible data to the portal until we complete the development of the final CI data delivery baseline in late May.
Finally, I’d like to call attention to a call out for support we’ve issued this week to any members of the OOI User Community who are subject matter experts on sensors used within the OOI, and who would be interested in providing us with some volunteer assistance. Our data team and Science Oversight Committee members are engaged in ongoing work to evaluate and validate OOI data streams and instruments. In addition to and in support of this effort we are looking for some volunteer assistance from subject matter experts to conduct some targeted validation work on select OOI instruments. Please review the details below, and let us know if you’re interested in helping out.
Thanks everyone, for your continued interest in the OOI. Please continue to use our data portal, and keep the great feedback coming in to the HelpDesk. Your ongoing inputs are critical for us to identify and correct errors and make continual improvements to the data portal and other areas on the OOI website. Stay with us, and stay engaged.
Featured News
Call For Assistance from OOI Sensor Subject Matter Experts
The OOI is requesting assistance from OOI sensor Subject Matter Experts (SMEs) who are interested in supporting an ongoing effort to evaluate and validate OOI data streams and instruments using raw data streams from OOI instruments. This call is designed to evaluate existing data to supplement existing evaluation and validation activities (OOI Quality Control Protocols and Procedures) and to help the OOI improve at-sea and post-recovery procedures based on the latest information from subject matter experts.
SME volunteers will be provided with raw data streams from select instruments identified by the OOI Science Oversight Committee (SOC) as priority instruments most in need of validation. SMEs will be asked to analyze the raw data to both validate proper operation of the instrument and evaluate and validate the content of the data.
To volunteer, please contact the HelpDesk – help@oceanobservatories.org
-Full Story-
Cyberinfrastructure Update
The Cyberinfrastructure Team has been working to increase data download capabilities from the OOI Data Portal (OOINet) and the OOI website. Currently, users can plot and download science data, access cruise reports and shipboard data, and view streaming video from the ocean floor. Additionally, new in March, asynchronous download of NetCDF files has been enabled, and the OOI Data Team is working to increase the datasets available through this mechanism. Raw Data for all arrays will be available from the OOI by April 8, via a link on the OOI website.
Several impending software and GUI improvements are still being tested on the test server, including: direct .csv download, association of pressure and latitude/longitude with all glider and profiler data points, and compression and file naming improvements to NetCDF files. These changes are scheduled to go live next week.
Thank you to everyone who has tried out the OOINet system and sent us feedback! Your input is of great value to the program as we continue to update the system and fix any errors that arise. There are currently over 300 users registered with the OOI Data Portal. From these users we have received close to 200 HelpDesk tickets this year and we have been able to resolve over 80% of these tickets. The remaining are being addressed in upcoming software and GUI upgrades. For those of you who have not logged in yet, check it out and let us know what you think!
Current OOI Data Availabilty
Streaming data from OOI cabled assets (Cabled and Endurance Array) can now be viewed online, in near-real time, through the Data Portal plotting feature. All the data ingested into OOINet continues to be available for plotting in the OOI Data Portal. Please note that ingestion is an early step in the full data flow process and these data have not yet gone through the quality control process. To view what has been ingested, click here to access the operator status tool. Asynchronous downloads of NetCDF files have also been enabled on the OOI Data Portal. Please note that we are working to increase the availability of datasets through asynchronous downloads. Some of the more complex datasets, like the Optical Attenuation and Absorption data, are not available at this time.
On the OOI Website, links can be found to download large format data sets, including HD video files from ASHES through an OPeNDAP server. Please note that in the coming weeks, as we continue to update our raw data delivery mechanisms, these OPeNDAP links may change. Additionally, data sets continue to be downloadable through the THREDDS Server and are now organized by array. Data are currently available for all arrays and include several comprehensive data sets for individual gliders, moorings, and profilers.
Historical cruise data are available for download from the OOI website. And we continue to provide interim delivery of the Cabled Array seismometer and bottom pressure data through IRIS http://www.iris.edu/hq/. Delivery of Cabled Array tilt meter and co-located temperature plots continue through Dr. Bill Chadwick’s website.
Read More