
Posts Tagged ‘Regional Cabled Array’
Kathleen Gonzalez: Student Ambassador for VISIONS’21 Expedition

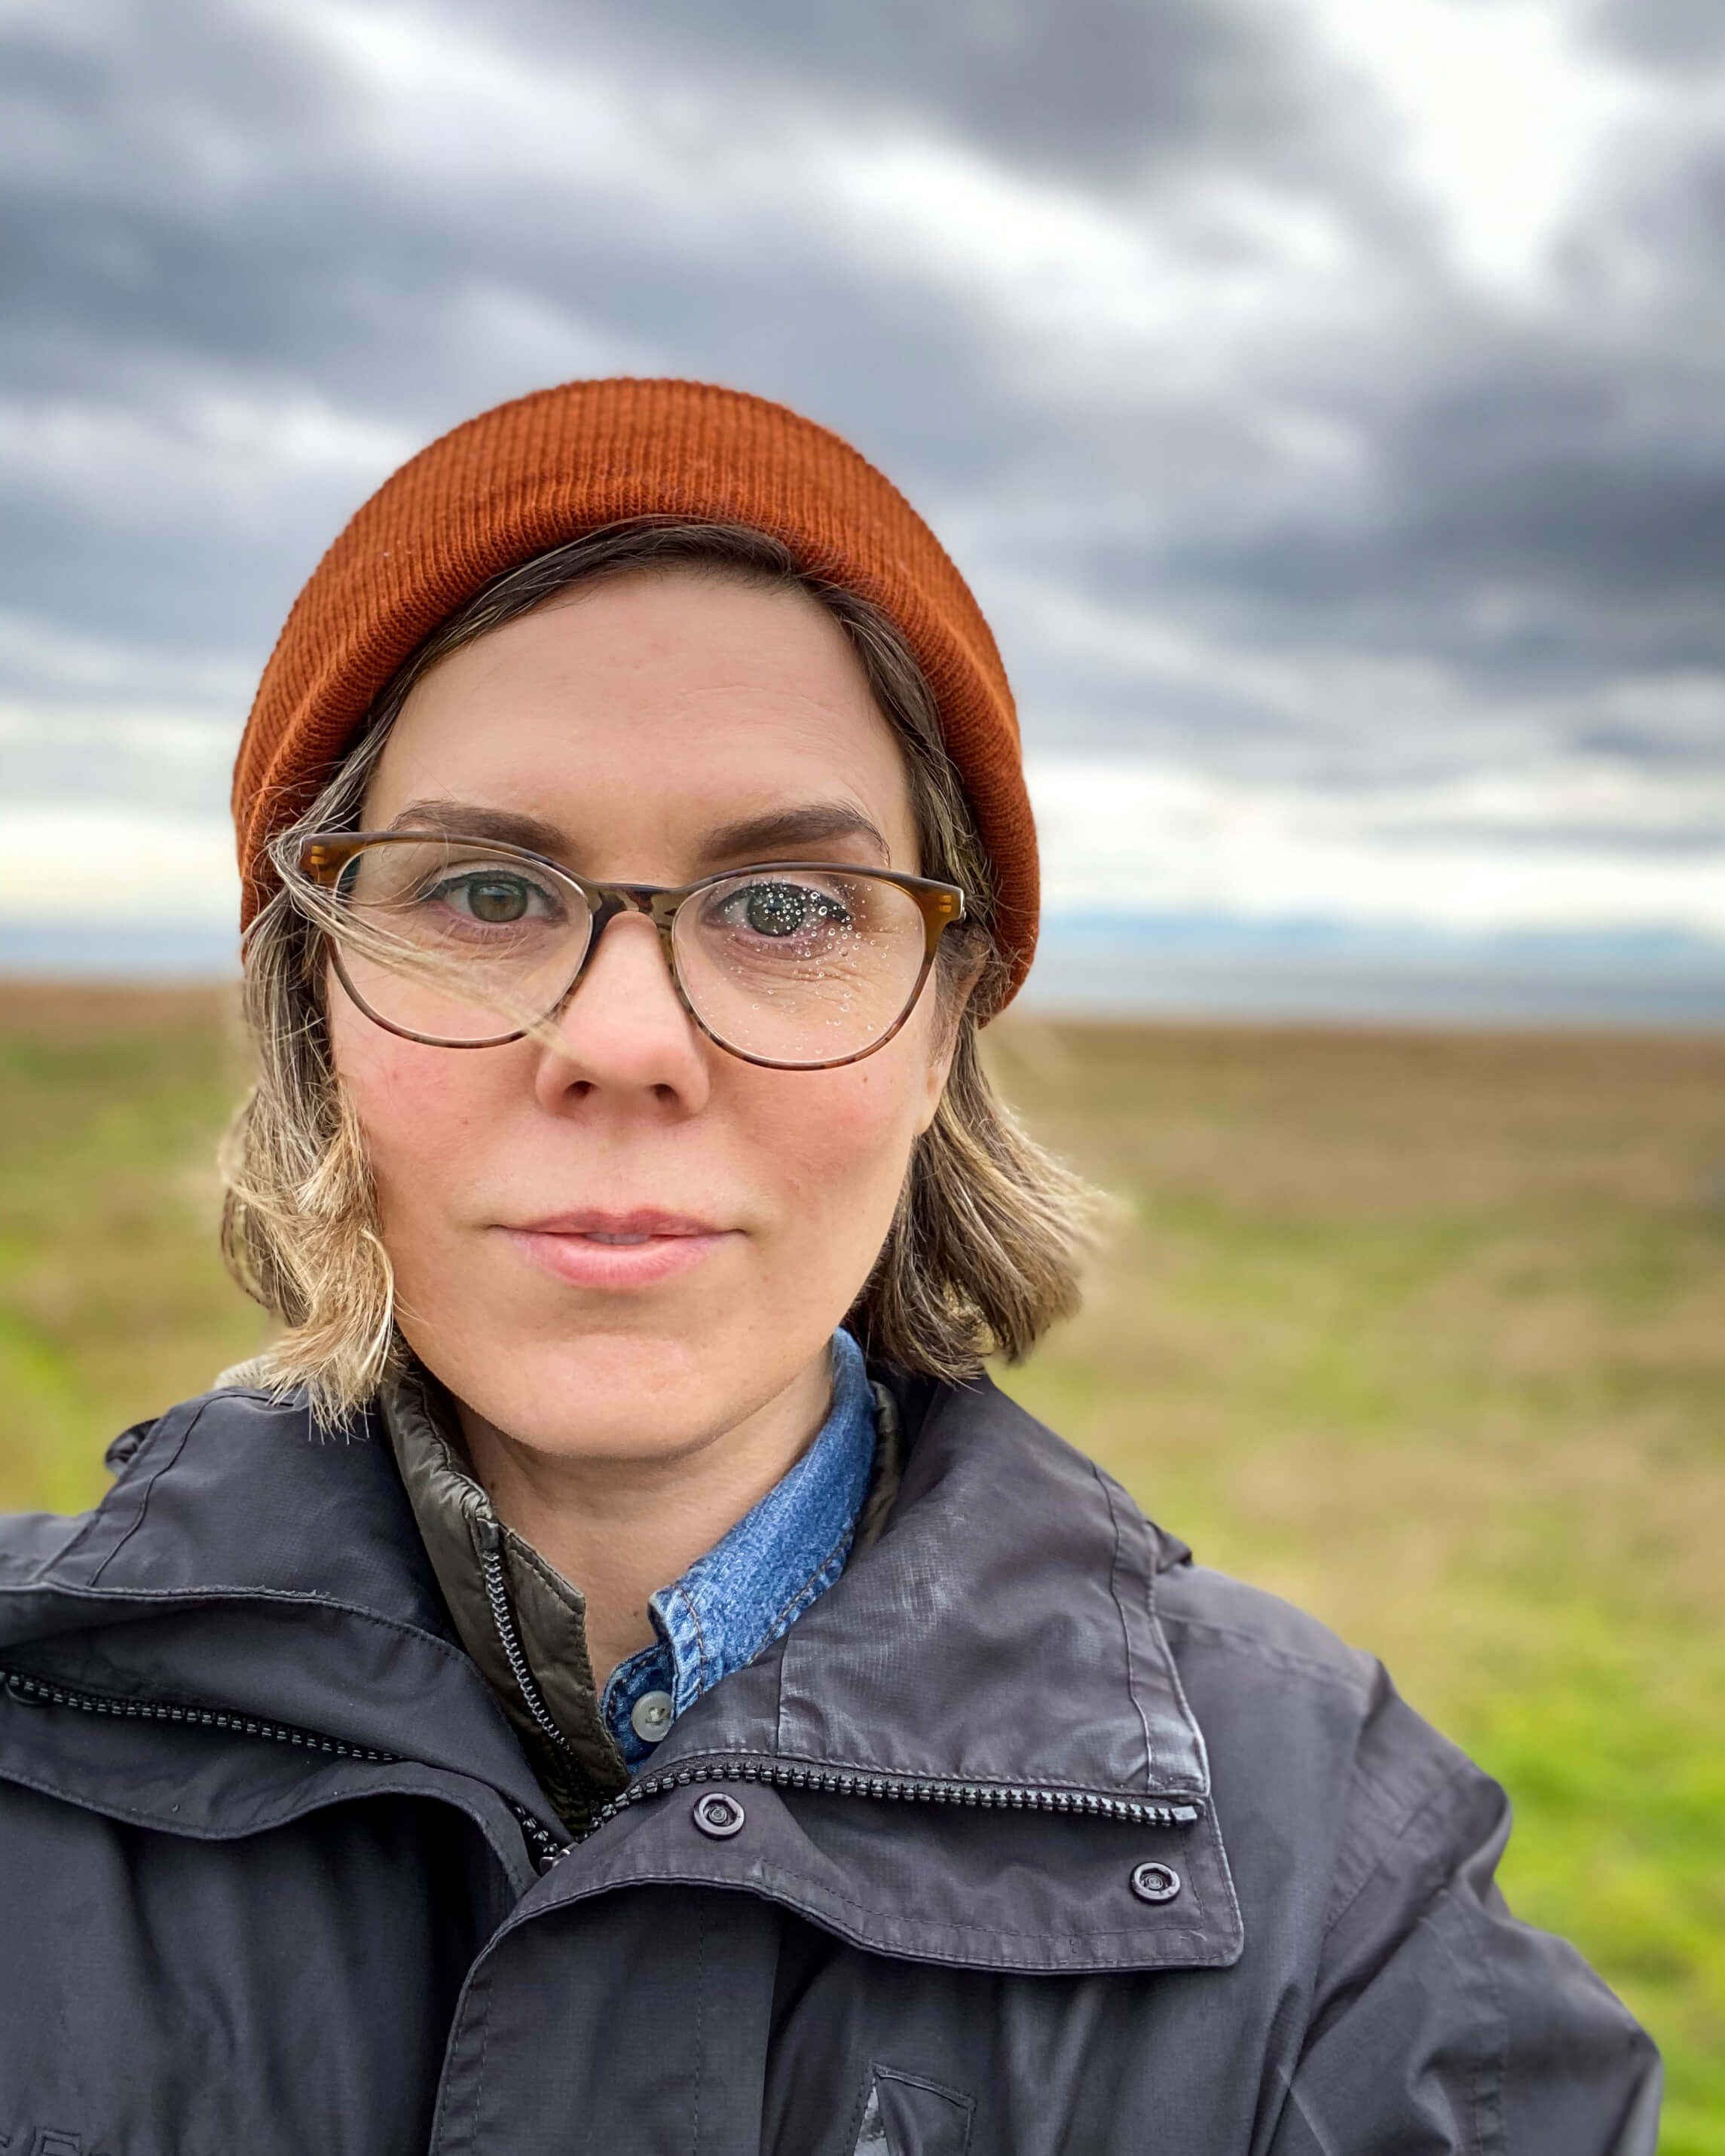
The first time Katie Gonzalez went to sea was as a student participant on the 2017 Ocean Observatories Initiative (OOI) annual operations and maintenance Regional Cabled Array (RCA) VISIONS’17 cruise. From that experience, she knew that whatever she did in the future needed to involve the oceans.
Katie recently graduated as a first-generation college student from the University of Washington (UW) with her bachelor’s degree in biological oceanography. But despite her young age, she has amassed a vast amount of sea-going experience. This year marks her fifth time joining the RCA VISIONS cruises, and the third time she has participated in all legs of the expedition.
Last year, when UW limited the number of people who could go on the cruise due to COVID restrictions, Katie was one of only two student participants aboard. As restrictions eased this year, she was excited to welcome back her peers as their student ambassador, using her extensive knowledge and experience to mentor the first-time students on how to use the equipment and interact with the scientists and crew aboard the ship. “Compared to the other students, I’ve had so much more prior experience, and that’s definitely been helpful,” she says. “I’m excited to have some new responsibilities.”
This year, she is also a key member of the science party, mentoring the 19 undergraduate VISIONS’21 students on the intense logging operations and acquisition of 4K and digital still imagery in the remotely operated vehicle Jason control van.
[media-caption path="https://oceanobservatories.org/wp-content/uploads/2021/08/Eve_Katie_Newport_20180701_153908_L2_startSmall.jpg" link="#"]Katie Gonzalez (left) poses with Eve Hudson (right) on the VISIONS ’18 cruise. Katie is currently acting as student ambassador on the VISIONS ’21 cruise. Credit: University of Washington, V18.[/media-caption]Katie first became interested in oceanography when she was attending high school in Clallam Bay, Washington. During one very memorable science class, Dr. Deb Kelley, an oceanography professor at UW and PI/Director for the RCA, came to show her class how to make environmental sensors, which they deployed in the school’s garden.
This experience inspired Katie to pursue a college degree in oceanography, and she decided to apply to UW to work with Professor Kelley. Since decisions for UW’s Seattle campus had already closed, she decided to attend the UW at Bothell and transferred to the Seattle campus the following year. In the meantime, she still wanted to work with Professor Kelley, so she commuted 45 minutes on public transportation to the main campus to work on OOI RCA projects in Professor Kelley’s lab.
Katie’s extensive experience working with OOI and doing research at sea motivated her to write her senior thesis using RCA data.
“I knew that whatever I was doing for my thesis, I wanted to use data from the RCA,” she recounts. As a biological oceanography student, she was most interested in biological happenings in the ocean to which she felt a personal bond. That’s when she heard about the RCA hydrophone data. The RCA hydrophones are used to listen for seismic events along the Juan de Fuca Ridge and Cascadia Margin, but they are also constantly bombarded with marine mammal calls, including whale vocalizations. “That was the connection I was looking for,” explains Katie. She decided to investigate fin whale calls at two different sites along the RCA by analyzing the timing and frequency of their calls. She chose to look at vocalizations from the Slope Base (~125 km from the Oregon coast) and the Axial Base (~475 km from the Oregon coast) sites because whales tend to congregate in areas of high bathymetric relief.
Fin whales are considered a vulnerable species because they have been heavily impacted by human activity.
“Looking into what the whales are doing, where they’re going, and how they’re interacting with their environment will be helpful in guiding the protection of these species,” says Katie.
Working with Dr. William Wilcock, a UW Oceanography professor and a seismologist who has been studying whale calls in the Northeast Pacific for several years, she fed five years of RCA hydrophone data into an algorithm that helped filter out data that matched the frequencies of fin whale calls. She then visualized the data as a spectrogram, which allowed her to make comparisons for frequency correlations.
“That was the moment when everything—the oceanography, the data science, and my human emotion for biological creatures—came together,” she recalls.
The preliminary results of this research showed that the whales appeared at the Slope Base site closer to the continental shelf two to three months earlier in their calling season, before moving out to the far off shore blue water environment of Axial Base. Both sites had their largest volume of calls in January.
Katie has several hypotheses about the seasonal patterns she observed. “They could be following their prey, or coastal upwelling could be providing them with more food closer to the shelf during those months. As for why both sites have peaks in January, that’s a question for further research.”
Her thesis detailing her research and its conclusions was published in the UW FieldNotes Journal.
Now that she has graduated, Katie hopes to continue with her research on whales. For now, she is happy to carry on working in the Kelley lab and helping out on the RCA VISIONS ’21 cruise. She will be writing two guest blog posts about her experience on the VISIONS ’21 cruise. Live updates for the VISIONS ’21 cruise can be found here.
[media-caption path="https://oceanobservatories.org/wp-content/uploads/2021/08/CTD_Katie_MIkeV-scaled.jpg" link="#"]Katie Gonzalez (right) and Mike Vardaro (left) work with the CTD rosette on the VISIONS ’18 cruise. Katie is a key member of the science party on the VISIONS ’21 cruise. Credit: University of Washington, V18.[/media-caption] Read MoreSummer at Sea: Three Arrays Turned
This summer has been a busy time for OOI’s teams, who are actively engaged in ensuring that OOI’s arrays continue to provide data 24/7. Teams are turning – recovering and deploying – three arrays during July and August. The first expedition occurred earlier in July when a scientific and engineering team spent 16 days in the Northeast Pacific recovering and deploying ocean observing equipment at the Global Station Papa Array. The team recovered three subsurface moorings and deployed three new ones. They also deployed one open ocean glider, recovered one profiling glider, and conducted 11 CTD casts (which measure conductivity, temperature, and depth) to calibrate and validate the instruments on the array. After completing this eighth turn of the Station Papa Array, the team returned to Woods Hole Oceanographic Institution by way of Seward, Alaska on the second of August.
[embed]https://vimeo.com/580883575[/embed]On 30 July, the Regional Cabled Array team embarked on the first of four legs of its 37-day Operations and Maintenance Cruise aboard the R/V Thomas G. Thompson. The ship, operated by the University of Washington, is hosting the remotely operated vehicle (ROV) Jason, operated by Woods Hole Oceanographic Institution (WHOI). During the cruise, Jason will be used to deploy and recover a diverse array of more than 200 instruments from the active Pacific seafloor. The science, engineering, and ROV teams will be joined this year by 19 students sailing as part of the University of Washington’s educational mission (VISIONS’21). A live video feed of the ship’s operations and Jason dives is available for the duration of the cruises.
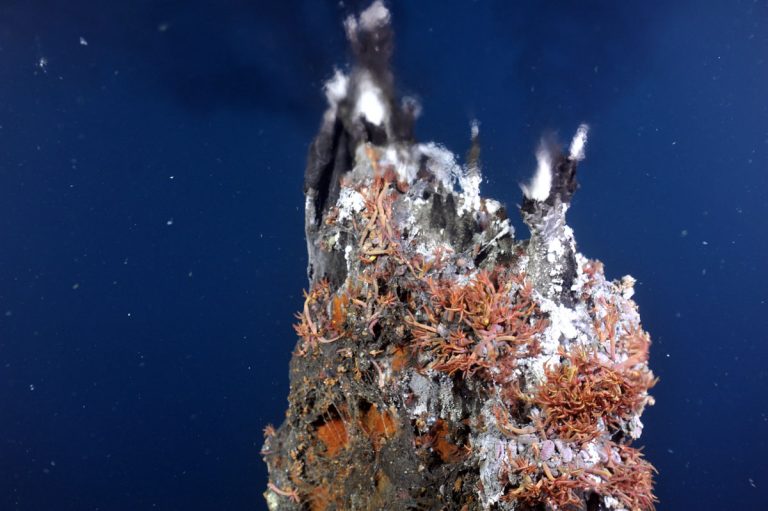
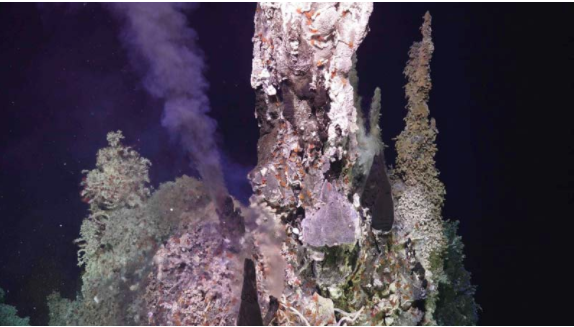
[media-caption path="https://oceanobservatories.org/wp-content/uploads/2021/07/r1472_elguapo.top_.web_-768x511-1.jpg" link="#"]The Regional Cabled Array team expects to share imagery as spectacular as this during its upcoming cruise. Shown here is the El Guapo hot spring, covered in life venting boiling fluids 4500 feet beneath the oceans surface. Credit: UW/NSF-OOI/CSSF; V11.[/media-caption]On 3 August, a team from WHOI boarded the R/V Armstrong for a weeklong transit to recover and deploy the Global Irminger Sea Array, off the Southeast coast of Greenland. The array is located in one of the most important ocean regions in the northern hemisphere and provides data for scientists to better understand ocean convection and circulation, which have significant climate implications. A science and engineering team will be deploying and recovering a global surface mooring, a global hybrid profiler mooring, two global flanking moorings, and three gliders (two open ocean and one profiling) during the three-week expedition. The team will also carry out shipboard sampling and CTD casts to support the calibration and validation of platform sensors while underway. A novel aspect of this cruise is that near real-time CTD profiles will be made publicly available during the cruise. The profiles will be evaluated by onshore staff, who will provide feedback to the ship, and share online assessment of CTD results.
“This summer’s at-sea activities are the culmination of months of planning, testing, and logistical work that goes on behind the scenes to make these expeditions possible,” said John Trowbridge, OOI’s Principal Investigator and head of the Program Management Office. “A tremendous amount of human effort and ingenuity is required to keep the arrays operational year-round, particularly in some of the ocean’s most challenging environments like the Irminger Sea and on the seafloor at Axial Seamount. The data collected, however, are essential, providing scientists with the tools needed to understand our changing ocean.”
The progress of the expeditions will be reported on these pages and on OOI’s social media channels.
[media-caption path="https://oceanobservatories.org/wp-content/uploads/2021/07/Irminger-Surface-mooring-.jpg" link="#"]A global surface mooring in the Woods Hole Oceanographic Institution stage area is outfitted and ready for deployment in the Irminger Sea Array. Photo: ©Jade Lin, WHOI[/media-caption]
Read More
Seismic Hazards Around the Globe: A Visualization Tool to Bring RCA Data into the Classroom
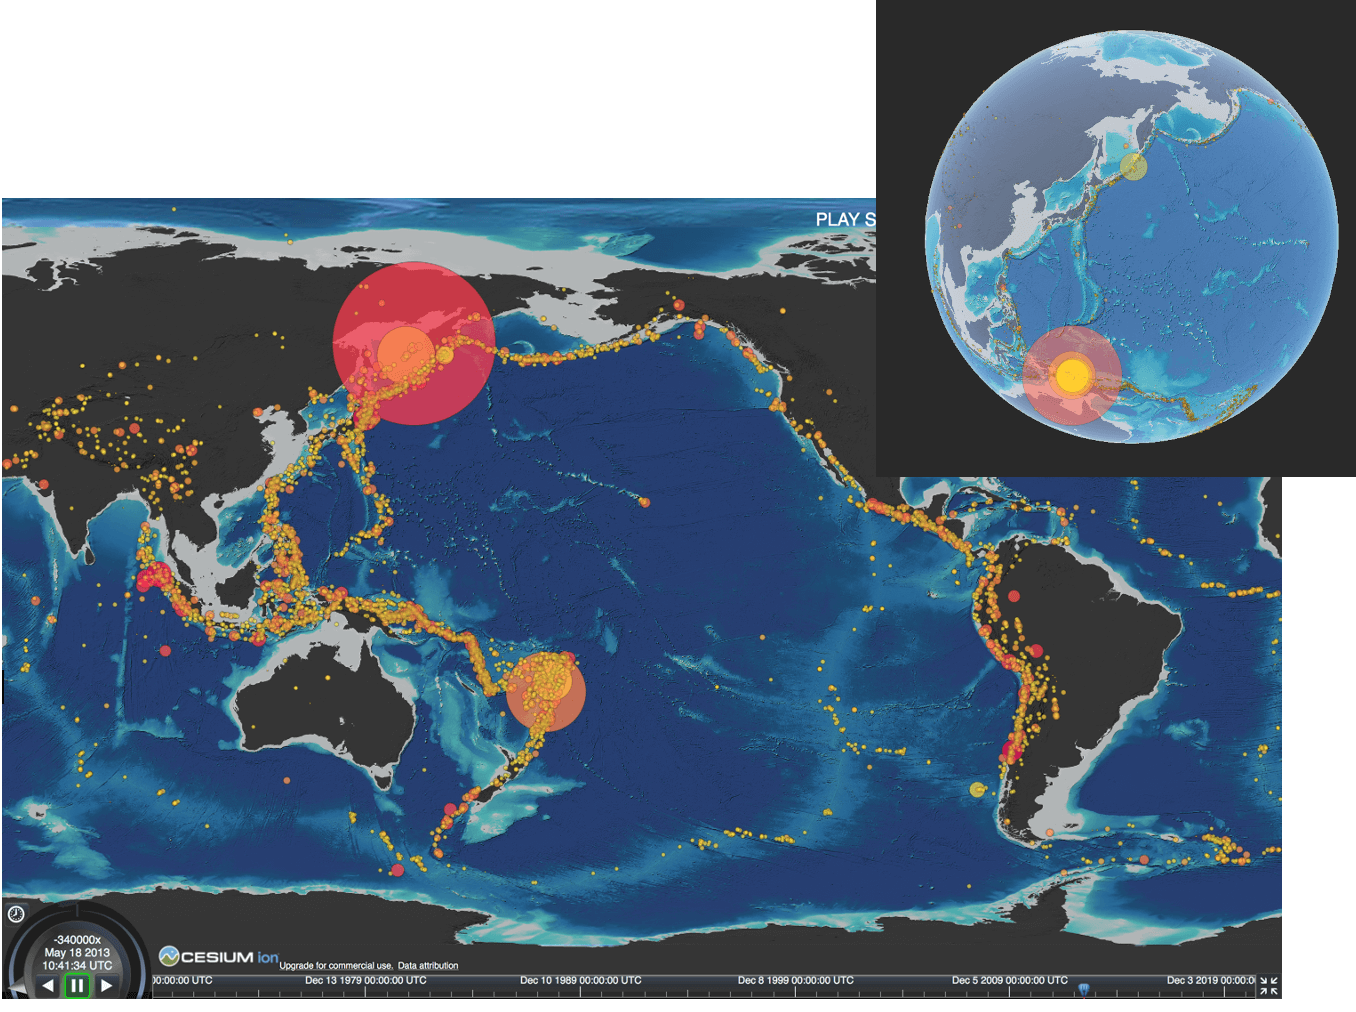
As part of the continuing University of Washington engagement effort, and in preparation for the new National Science Foundation K12 education award focused on bringing OOI data into the classroom, Kelley collaborated with the Center for Environmental Visualization within the School of Oceanography to generate an earthquake exploration tool focused on seismic events within the global oceans from 1970 to present. We anticipate that one of the curriculum modules developed for the K12 program will be focused on geohazards, with an emphasis on the Cascadia Subduction Zone within the context of the “ring of fire.” A video of this animation is hosted on interactive oceans and a direct link to the developmental site is provided above. The animation will be used in a Queens College physical geology class this next year that has 150 students (Dr. Dax Soule). This effort is also in preparation for completing a similar visualization focused on Axial Seamount and Regional Cabled Array seismic data.
The data sets used for this effort include a map centered on the Pacific Ocean that shows the distribution of earthquakes of magnitude ≥6 in the U.S. Geological Survey catalog from 1970 through 2021. The topographic dataset is licensed under Creative Commons CC BY-4.0. The data were formatted to match the JSON format recommended for use of global visualization using the ‘Cesium’ interactive virtual earth viewer promoted within its 3D geospatial visualization for the web toolset. The Cesium JavaScript API was utilized to implement algorithms for procedural color determination based on magnitude and hypocenter point radius animation based on the date-time of the earthquake event. The resultant animation is highly interactive, allowing the user to choose a 3D global view or a flat view, and viewing speeds of 1-8 times. In addition, the field of view can be changed to move to a specific area of interest and includes zoom capabilities. A sliding time bar allows the user to focus in on particular items of interest.
Read More
RCA Visions 21 Departs for 37-day Expedition
The University of Washington Regional Cabled Array Team left Seattle, Washington on 30 July for its annual Operations and Maintenance (O&M) Expedition for the cabled component of the National Science Foundations’ Ocean Observatories Initiative (OOI), through September 4, 2021. This 37-day cruise is on the global class research ship the R/V Thomas G. Thompson, operated by the University of Washington, which is hosting the remotely operated vehicle (ROV) Jason, operated by Woods Hole Oceanographic Institution.
[media-caption path="https://oceanobservatories.org/wp-content/uploads/2021/07/J1265_20200808_0232_CAMDSB303_recover-copy-2.jpeg" link="#"]ROV Jason breaks the surface above the most active volcano off the WA-OR coast. Credit: UW/NSF-OOI/WHOI. V20.[/media-caption]The expedition can be followed through live video feeds from sea, daily updates, and stunning imagery. During the cruise, virtual visitors will be able to directly observe parts of the seafloor rarely seen by humans – the most active submarine volcano off our coast ‘Axial Seamount’ located about 300 miles offshore and nearly a mile beneath the oceans’ surface. Here virtual visitors can witness one of the most extreme environments on Earth – underwater 700°F hot springs teaming with life that thrives on volcanic gases and lives in the complete darkness of the deep sea. The team will also visit the Cascadia Margin, spending time at Southern Hydrate Ridge where methane ice deposits are exposed on the seafloor with areas of dense microbial mats, and at shallower sites that are some of the most biologically productive areas in the world’s ocean.
[media-caption path="https://oceanobservatories.org/wp-content/uploads/2021/07/overview.flow_.mosquito.sm_.r1772_03229-scaled.jpg" link="#"]A “Mosquito” flow meter (far left) and osmotic fluid sampler (far right) installed on microbial mats Southern Hydrate Ridge. Photo credit: NSF-OOI/UW/CSSF; Dive R1772; V14.[/media-caption]The Regional Cabled Array (RCA) team is excited to get underway and looking forward to being out in the Pacific Ocean again. This is an immense logistics operation with ~ 20 trucks transporting >130,000 lbs of gear to Newport, Oregon in support of highly complex at-sea operations that have required months of planning, and testing of gear to be installed. During the cruise, the ROV will deploy and recover a diverse array of more than 200 instruments, several small seafloor substations that provide power and communications to instruments on the seafloor and on moorings that span depths of 2900 m (9500 ft) to 80 m (260 ft) beneath the oceans’ surface. In addition, several novel, externally funded instruments developed by scientists in the US and Germany will be installed.
This year, the RCA Team will be joined by 19 students sailing as part of the UW’s educational mission (VISIONS’21). The students will be distributed over the four legs of the O&M Expedition. The VISIONS program has allowed >160 students to participate in this at-sea experiential learning program.
Virtual visitors will have the opportunity to share in the students’ wonder and excitement through their blogs and daily updates here. Be sure to bookmark this site and check back often to share in what promises to be a life-changing experience for many students. Share in their adventure!
Article by Deb Kelley, Principal Investigator for the Regional Cabled Array
Read MoreInnovative Instruments on the RCA
The Regional Cabled Array (RCA) provides power and bandwidth to a set of core OOI pressure sensor and tiltmeter instruments, developed by Dr. W. Chadwick, which measure subsidence or uplift of the seafloor, an important indicator of activity at Axial Seamount. But these instruments undergo slow instrumental drift, which can be misinterpreted as seafloor height changes. To increase measurement accuracy, three novel instruments have been added to the RCA – the self-calibrating pressure recorder, flipping tilt meter, and A-0-A pressure sensor – to account and correct for instrument drift.
Researchers are field testing these new drift-and pressure-measuring instruments and comparing results with the conventional instruments onsite, with the intent of identifying which might be the most reliable over the long-term and under specific conditions. The pressure and tilt data being collected and served by these instruments are being incorporated into models that are increasing understanding of volcanic activity at isolated and hard-to-measure sites such as Axial Seamount. The instrument placements and ongoing research is supported by the National Science Foundation.
Flipping Tilt Meter and A-0-A
Dr. William Wilcock, of the University of Washington, oversees the flipping (or rotating) tilt meter and the A-0-A (A zero A) sensor deployed on the RCA for three years at Axial: it will be recovered this summer. The A-0-A is currently deployed within Axial’s Caldera at the Central Caldera site.
Tilt meters are widely used on volcanoes because when volcanoes inflate the tilt of the ground changes. Because conventional tilt meters drift a lot, they are only useful in environments where there are big signals, or where changes happen quite quickly. The flipping tilt meter corrects for this drift and allows it to be used in areas with smaller, more subtle changes.
Wilcock explains the corrective principle, “I have an old-fashioned kitchen scale with a rotating needle. Every time I put the tray on top of the scale, I have to zero it out by turning a dial. All three instruments are based on resonant quartz crystal sensors which drift, so our calibrations are similar to the principle in a kitchen scale with a dial adjustment. “
A flipping tilt meter is a three-component accelerometer, which measures the acceleration of the Earth, in the vertical and in two horizontal directions. In the vertical, it measures the acceleration of gravity, 9.8 meters per second squared. In the horizontal, there’s no acceleration of gravity, so it measures nothing. But if the instrument tilts, a small component of gravity pulls the horizontals in the downward direction because the instruments are no longer completely level.
“Every month we rotate one of the horizontal channels into the vertical to measure the acceleration of gravity, which doesn’t change. So we compare the rate of acceleration of gravity from the prior measurement and calculate how much the instrument had drifted and correct for that drift,” added Wilcock. Wilcock and his team have tested the flipping tilt meter on land at Piñon Flat in California and now on the seafloor at Axial Seamount.
At Axial, the flipping tilt meter has been proven to measure tilt within about one part in 106—a very small tilt signal. Wilcock hosts data collected by the flipping tilt meter through IRIS, the Incorporated Research Institutions for Seismology. Wilcock and his team are currently writing a paper where the calibration data from the instrument will be shared.
Wilcock hopes the next test site for the flipping tiltmeter is placement in a borehole, where it can be secured so as to not experience drift nor temperature changes. Because the flipping tiltmeter doesn’t need recalibration, it holds promise for being a simple sort of “plug and play type” of tiltmeter.
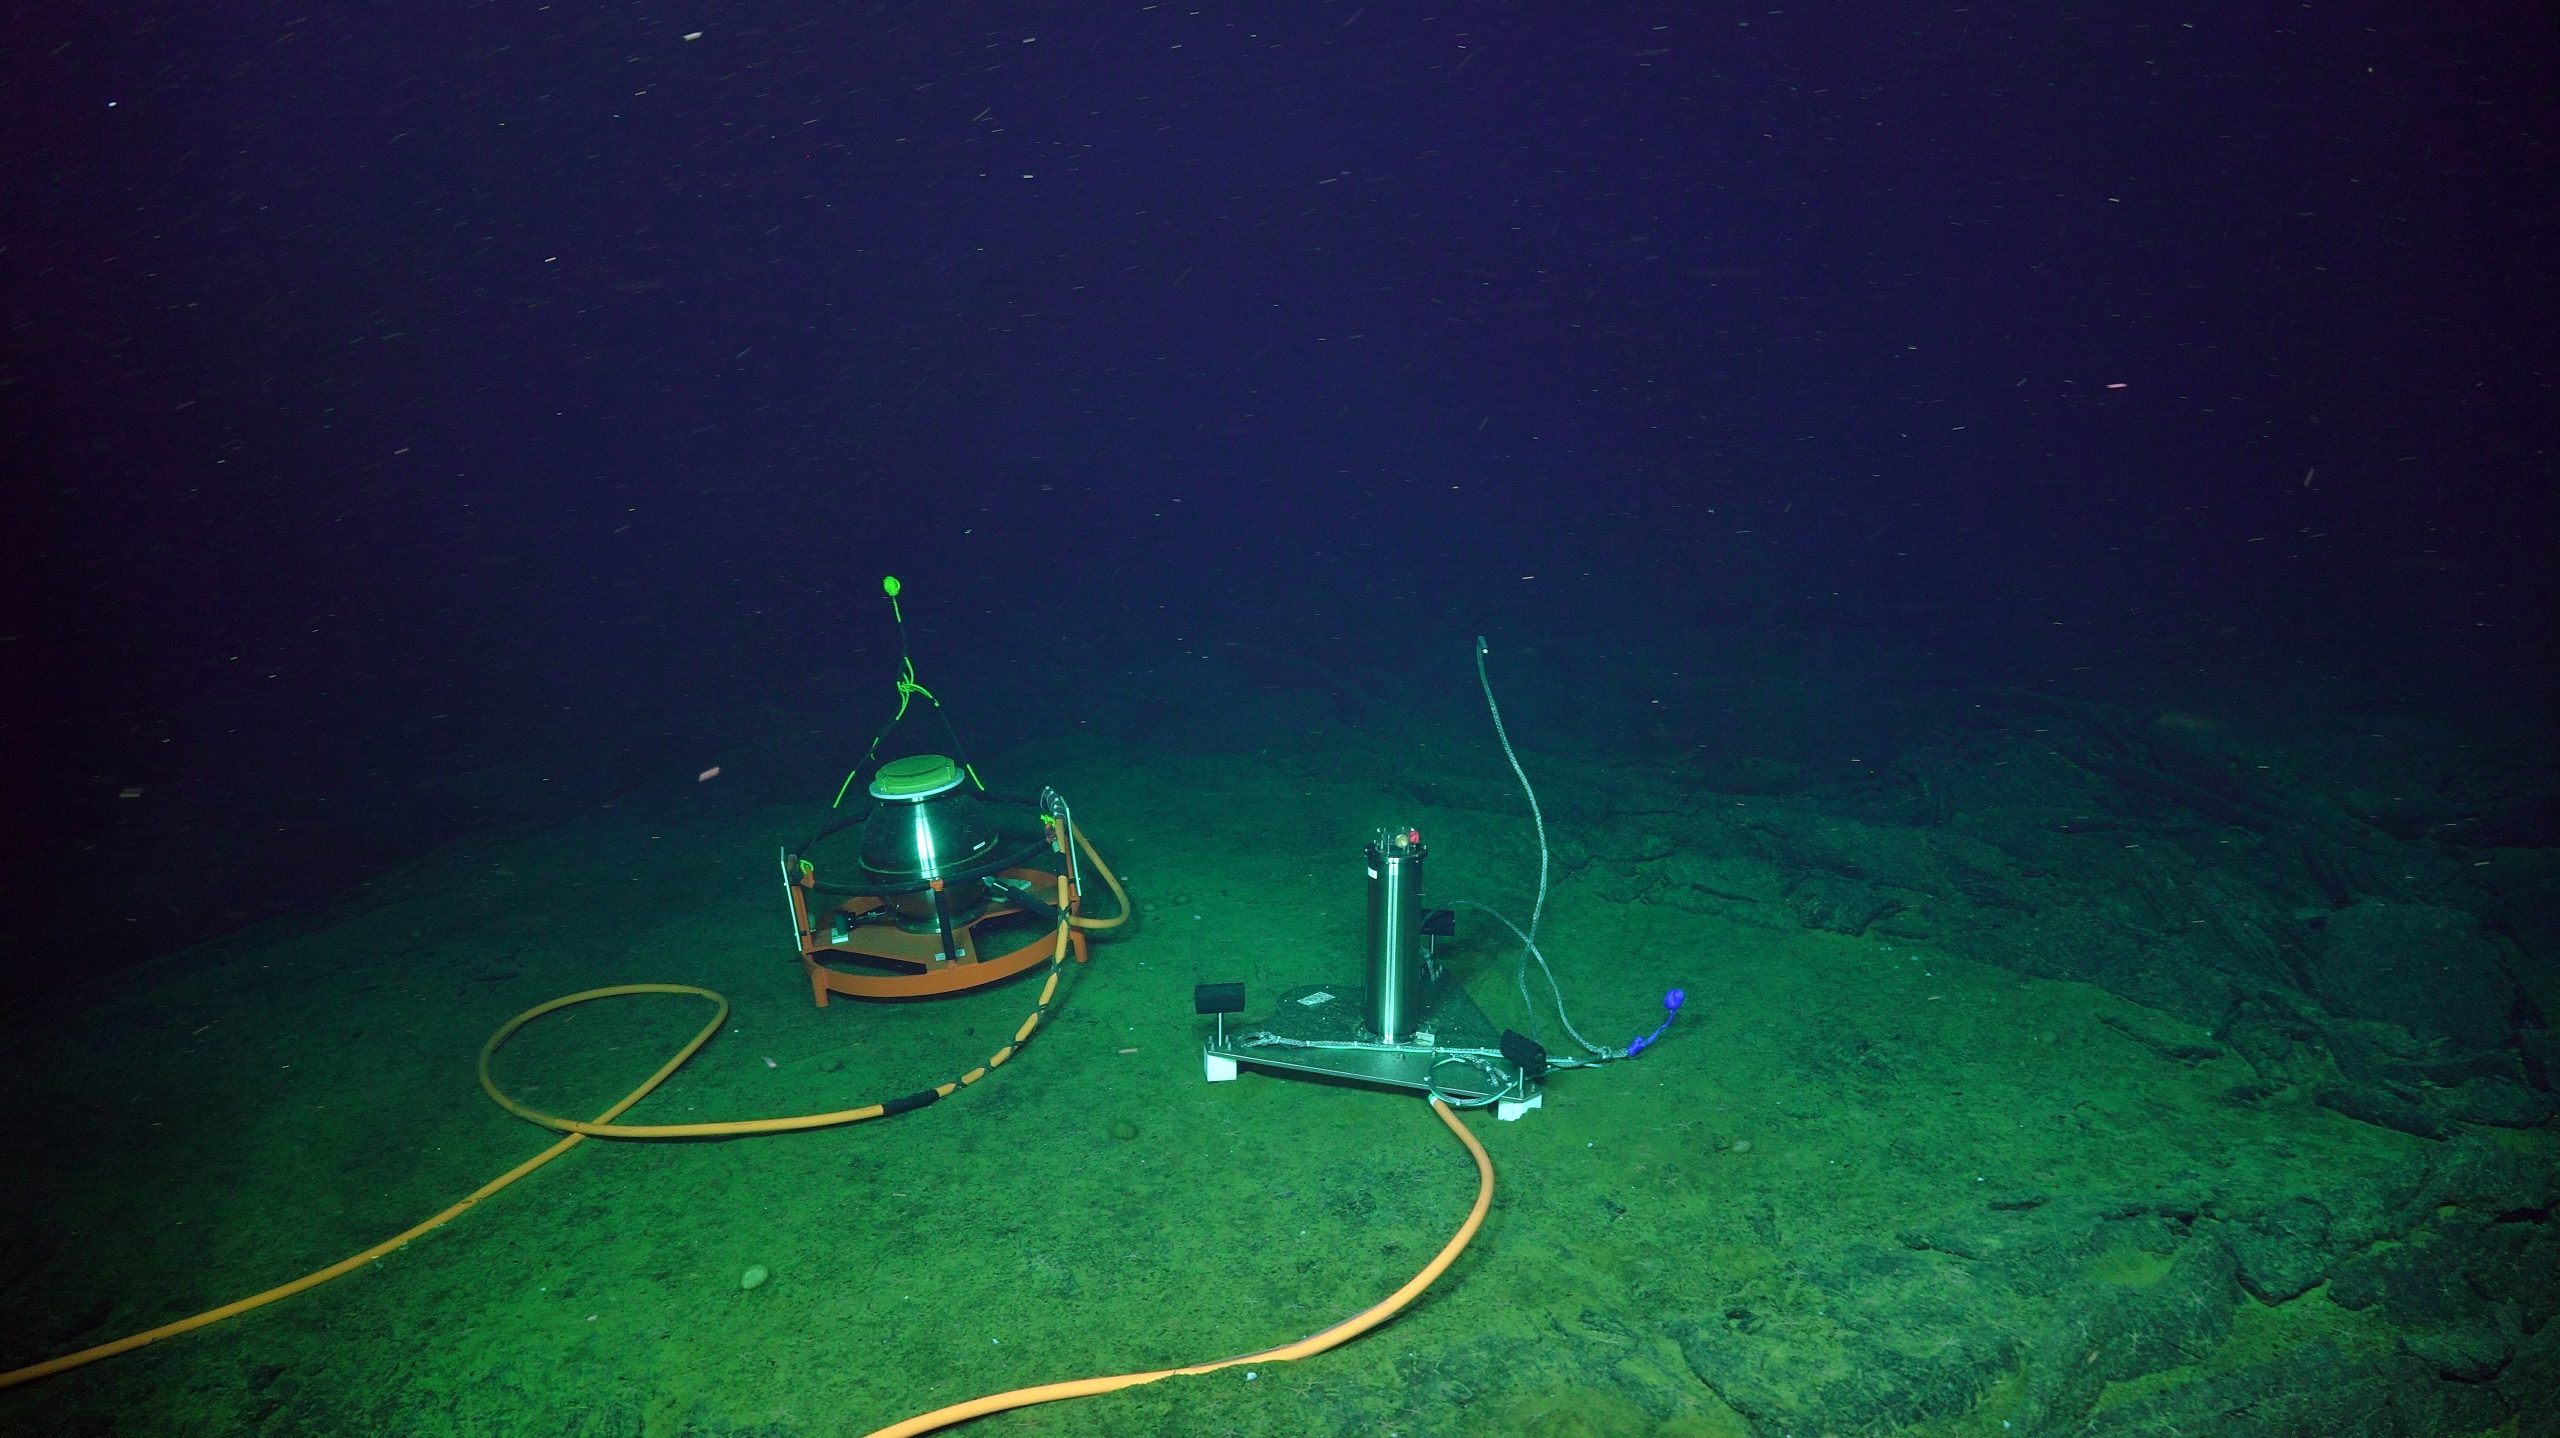
[caption id="attachment_20232" align="alignright" width="400"] The Self-Calibrating Pressure Recorder (left) sits adjacent to the A-O-A instrument allowing cross comparison of data focused on seafloor deformation. Credit: UW/NSF-OOI/WHOI; V19.[/caption]
Wilcock also has an A-0-A (Ambient – zero for atmospheric pressure- Ambient) instrument co-located with the Self-calibrating Pressure Recorder at Central Caldera. The A-0-A instrument compares ocean pressure to atmospheric pressure, calculated by a barometer within the instrument to determine drift.
The A-0-A is equipped with two redundant pressure sensors and a valve that switches from measuring the pressure at the seafloor to measuring the pressure internal to the instrument.
When the valve switches to the internal pressure of the instrument, the drift of the two pressure sensors can be measured by comparing their reading to a barometer inside the instrument. If the calibration is working, then the two calibrated readings of the two sensors should give the same reading when the valve switches back and they measure the pressure at seafloor. Early results show that they agree within a few millimeters per year in 1500 meters of water.
University of Washington graduate student Erik Fredrickson is using data from the Flipping Tilt and A-0-A meters to help refine models of the inflation occurring at Axial Seamount. “With pressure data, you can see the pressure increasing and decreasing in minutes. Pressure measurements work opposite of what you might expect for we are basically measuring the weight of the water. So as a volcano inflates, it lowers pressure on a seafloor instrument, and when it erupts, we get a higher-pressure signal. It’s really helpful to have accurate pressure measurements so we can understand how the volcano is behaving.”
Self-calibrating Pressure Recorder
Drs. Glen Sasagawa and Mark Zumberge of the Institute of Geophysics and Planetary Physics at Scripps Institution of Oceanography, University of California, San Diego conceived of and built a self-calibrating pressure recorder (SCPR) in 2013. They initially tested their battery-operated prototype off the coast of California. All data were stored on the instrument, which had to be retrieved by boat and uplinked data back to shore.
The SCPR, installed at Axial Seamount in 2018, was a much more sophisticated version consisting of many mechanical elements, including a deadweight tester, an instrument whose history dates back to the 19th century. The deadweight tester consists of a piston that fits inside a closely spaced cylinder, over which a mass is placed. Oil and hydraulic fluid are pumped in until the tester floats up in the middle of the cylinder, causing the piston to rise up. (see diagram below). When that occurs, the weight of the piston (mass x gravity) is balanced by the pressure acting on the surface area of the piston on the bottom. A mathematical formula is applied to calculate pressure (mass x gravity divided by the area).
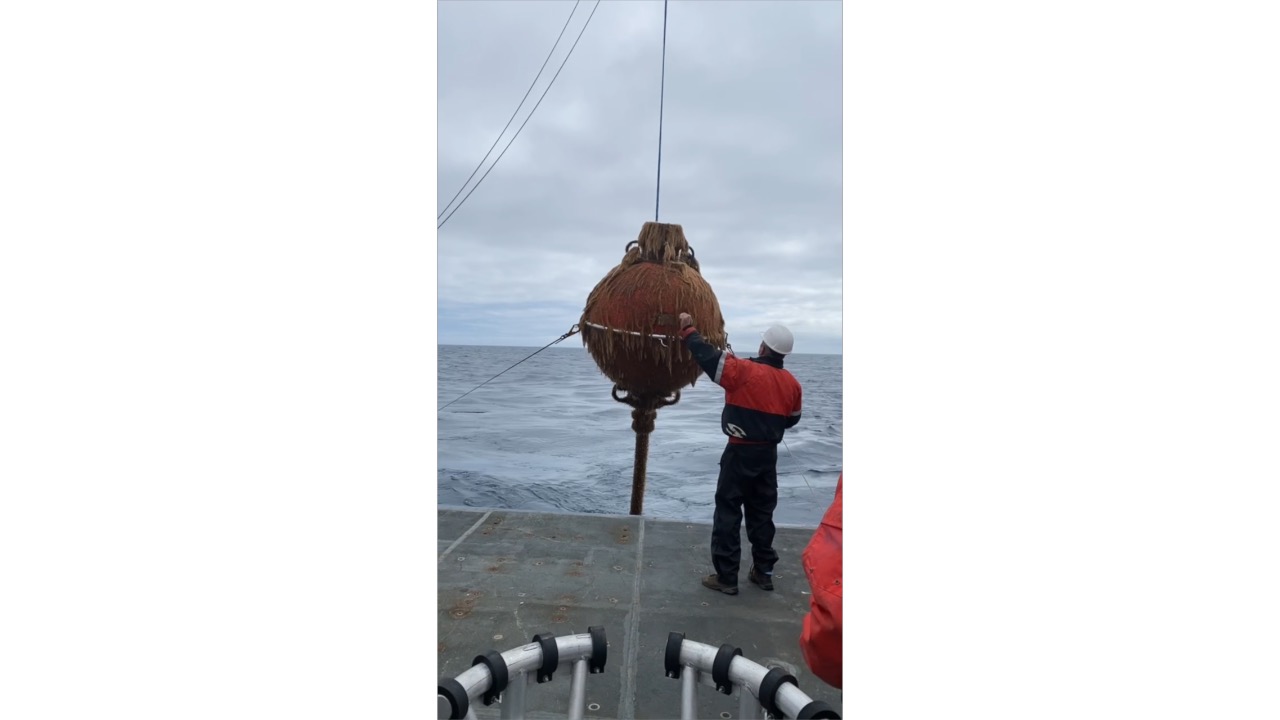
[caption id="attachment_21228" align="alignleft" width="375"]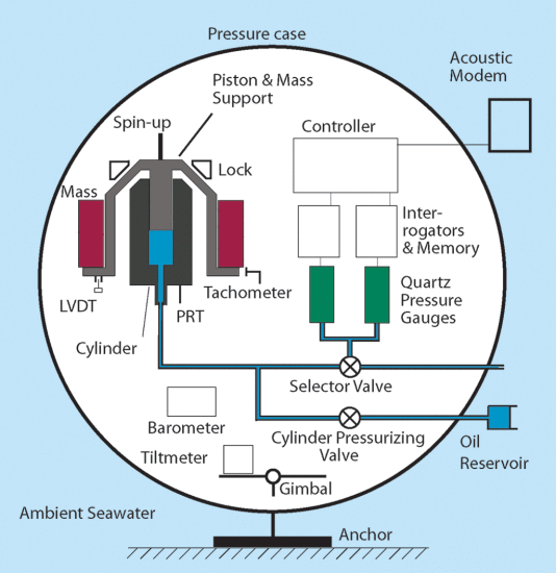 The key components of the SCPR. A 41.6-cm diameter sphere contains two recording pressure gauges which record ambient seawater pressure. Once every ten days for a period of 20 min the two gauges are hydraulically connected to a piston gauge that provides a reference pressure used to determine their drift rates.[/caption]
One key change since the SCPR prototype is that it is no longer battery-powered. “RCA provided us with a slot on the cable and took care of getting the instrument placed and plugged into the network, and then getting the data onshore to Seattle,” explained Sasagawa. “From an investigator’s perspective, all I have to do to access our data is log onto an FTP site, grab some data, and I’m good to go.”
Every three months or so, Sasagawa logs onto a computer terminal in his office to gain access to the control panel of the SCPR calibrate and operate the SCPR. “I have direct communication with an instrument that is some 1500 meters under the sea, hundreds of miles off the Oregon coast. It’s definitely very cool and an amazing capability,” he added.
The goal is to keep this SCPR onsite at Axial for five-years, during which time data are consistently transmitted and available for researchers here. Sasagawa hopes to next test the efficacy of the SCPR at the Cascadia subduction zone, which runs from Vancouver Island in Canada to northern California, with smaller signals than at Axial.
“I would just add that we can’t overemphasize the importance of having power and communications on the seafloor. With the cable right there, we have the really critical things that we take for granted in our daily lives… Just plugging something into the wall socket, and turning on Wi-Fi. And certainly in the oceans, we just cannot take that for granted. This is key infrastructure. And having data come back in real or near real time is critical,” concluded Sasagawa.
Read More
Expanding Reach of OOI Data
 Pioneer Array data is now available on NERACOOS’ new Mariner’s Dashboard. This is but one example of how OOI data are integrated into other data repositories to maximize their benefit and use.[/caption]
OOI shares data with partner repositories and institutions that host similar data but have different user bases. These partnerships expand the data available for forecasting models, help provide insight into current ocean conditions, and serve as important resources for many ranging from fishers and other maritime users to land-based researchers and students.
With the exception of the Station Papa Array, the OOI Coastal and Global Arrays maintain surface buoys. Instruments deployed on these buoys measure meteorological variables such as air temperature, barometric pressure, northward and eastward wind velocities, precipitation, solar radiation, and surface water properties of sea surface temperature and salinity. Other instruments on the moorings collect wave data, such as significant wave height, period, and direction. These data are then consumed by national and regional networks to improve accuracy of weather forecasting models.
The Regional Cabled Array (RCA) consists of fiber-optic cables off the Oregon coast that provide power, bandwidth, and communication to seafloor instrumentation and moorings with instrumented profiling capabilities. A diverse array of geophysical, chemical, and biological sensors, a high-definition camera, and digital still cameras on the seafloor and mooring platforms, provide real-time information on processes operating on and below the seafloor and throughout the water column, including recording of seafloor eruptions, methane plume emissions and climate change. These data are available for community use. Since 2015, the RCA has fed data into Incorporated Research Institutions for Seismology (IRIS), the primary source for data related to earthquakes and other seismic activity. In addition, data including zooplankton sonar data, are being utilized within the Pangeo ecosystem for community visualization and access and pressure data are incorporated into NOAA’s operational tsunami forecasting system.
Helping Improve Models and Forecasting
One of the recipients of OOI data is the National Data Buoy Center (NDBC), part of the National Oceanic and Atmospheric Administration’s (NOAA) National Weather Service. NDBC maintains a data repository and website, offering a range of standardized real-time and near real-time meteorological data. Data such as wind speed and direction, air and surface water temperature, and wave height and direction are made available to the broader oceanographic and meteorological community.
“Many researchers go to NDBC for their data, “said Craig Risien, a research associate with OOI’s Endurance Array and Cyberinfrastructure Teams, who helps researchers gain access to and use OOI data. “NBDC is a huge repository of data and it’s easy to access. So there’s a low barrier for researchers and students who are looking for information about wind speed, water temperature and a slew of other data. OOI contributing to this national repository significantly increases its data reach, allowing OOI data to be used by as many people as possible. “
OOI sea surface temperature data also make their way into the operational Global Real-Time Ocean Forecast System (RTOFS) at the National Centers for Environmental Prediction (NCEP), another part of NOAA’s National Weather Service. RTOFS ingests sea surface temperature and salinity data from all available buoys into the Global Telecommunications System (GTS). OOI glider data also are pushed in near real-time to the US Integrated Ocean Observing System Glider Data Assembly Center (DAC). From there, the data goes to the GTS where it can be used by the operational modeling centers such as NCEP and the European Centre for Medium-Range Weather Forecasts.
The GTS is like a giant vacuum sucking up near real-time observations from all sorts of different platforms deployed all over the world. On a typical day, the GTS ingests more than 7,600 data points from fixed buoys alone. As a result of this vast input, researchers can go to the GTS, pull available data, and assimilate that information into any model to improve its prediction accuracy.
Advancing Forecasting of Submarine Eruptions
As the first U.S. ocean observatory to span a tectonic plate, RCA’s data are an invaluable contributor to IRIS’s collection. Since 2015, the user community has downloaded >20 Terabytes of RCA seismometer data from the IRIS repository. Fourteen different sampling locations include key sites at Axial Seamount on the Juan de Fuca mid-ocean ridge spreading center, near the toe of the Cascadia Margin and Southern Hydrate Ridge. RCA data are catalogued and available on the IRIS site, using the identifier “OO.”
[caption id="attachment_21046" align="alignleft" width="300"]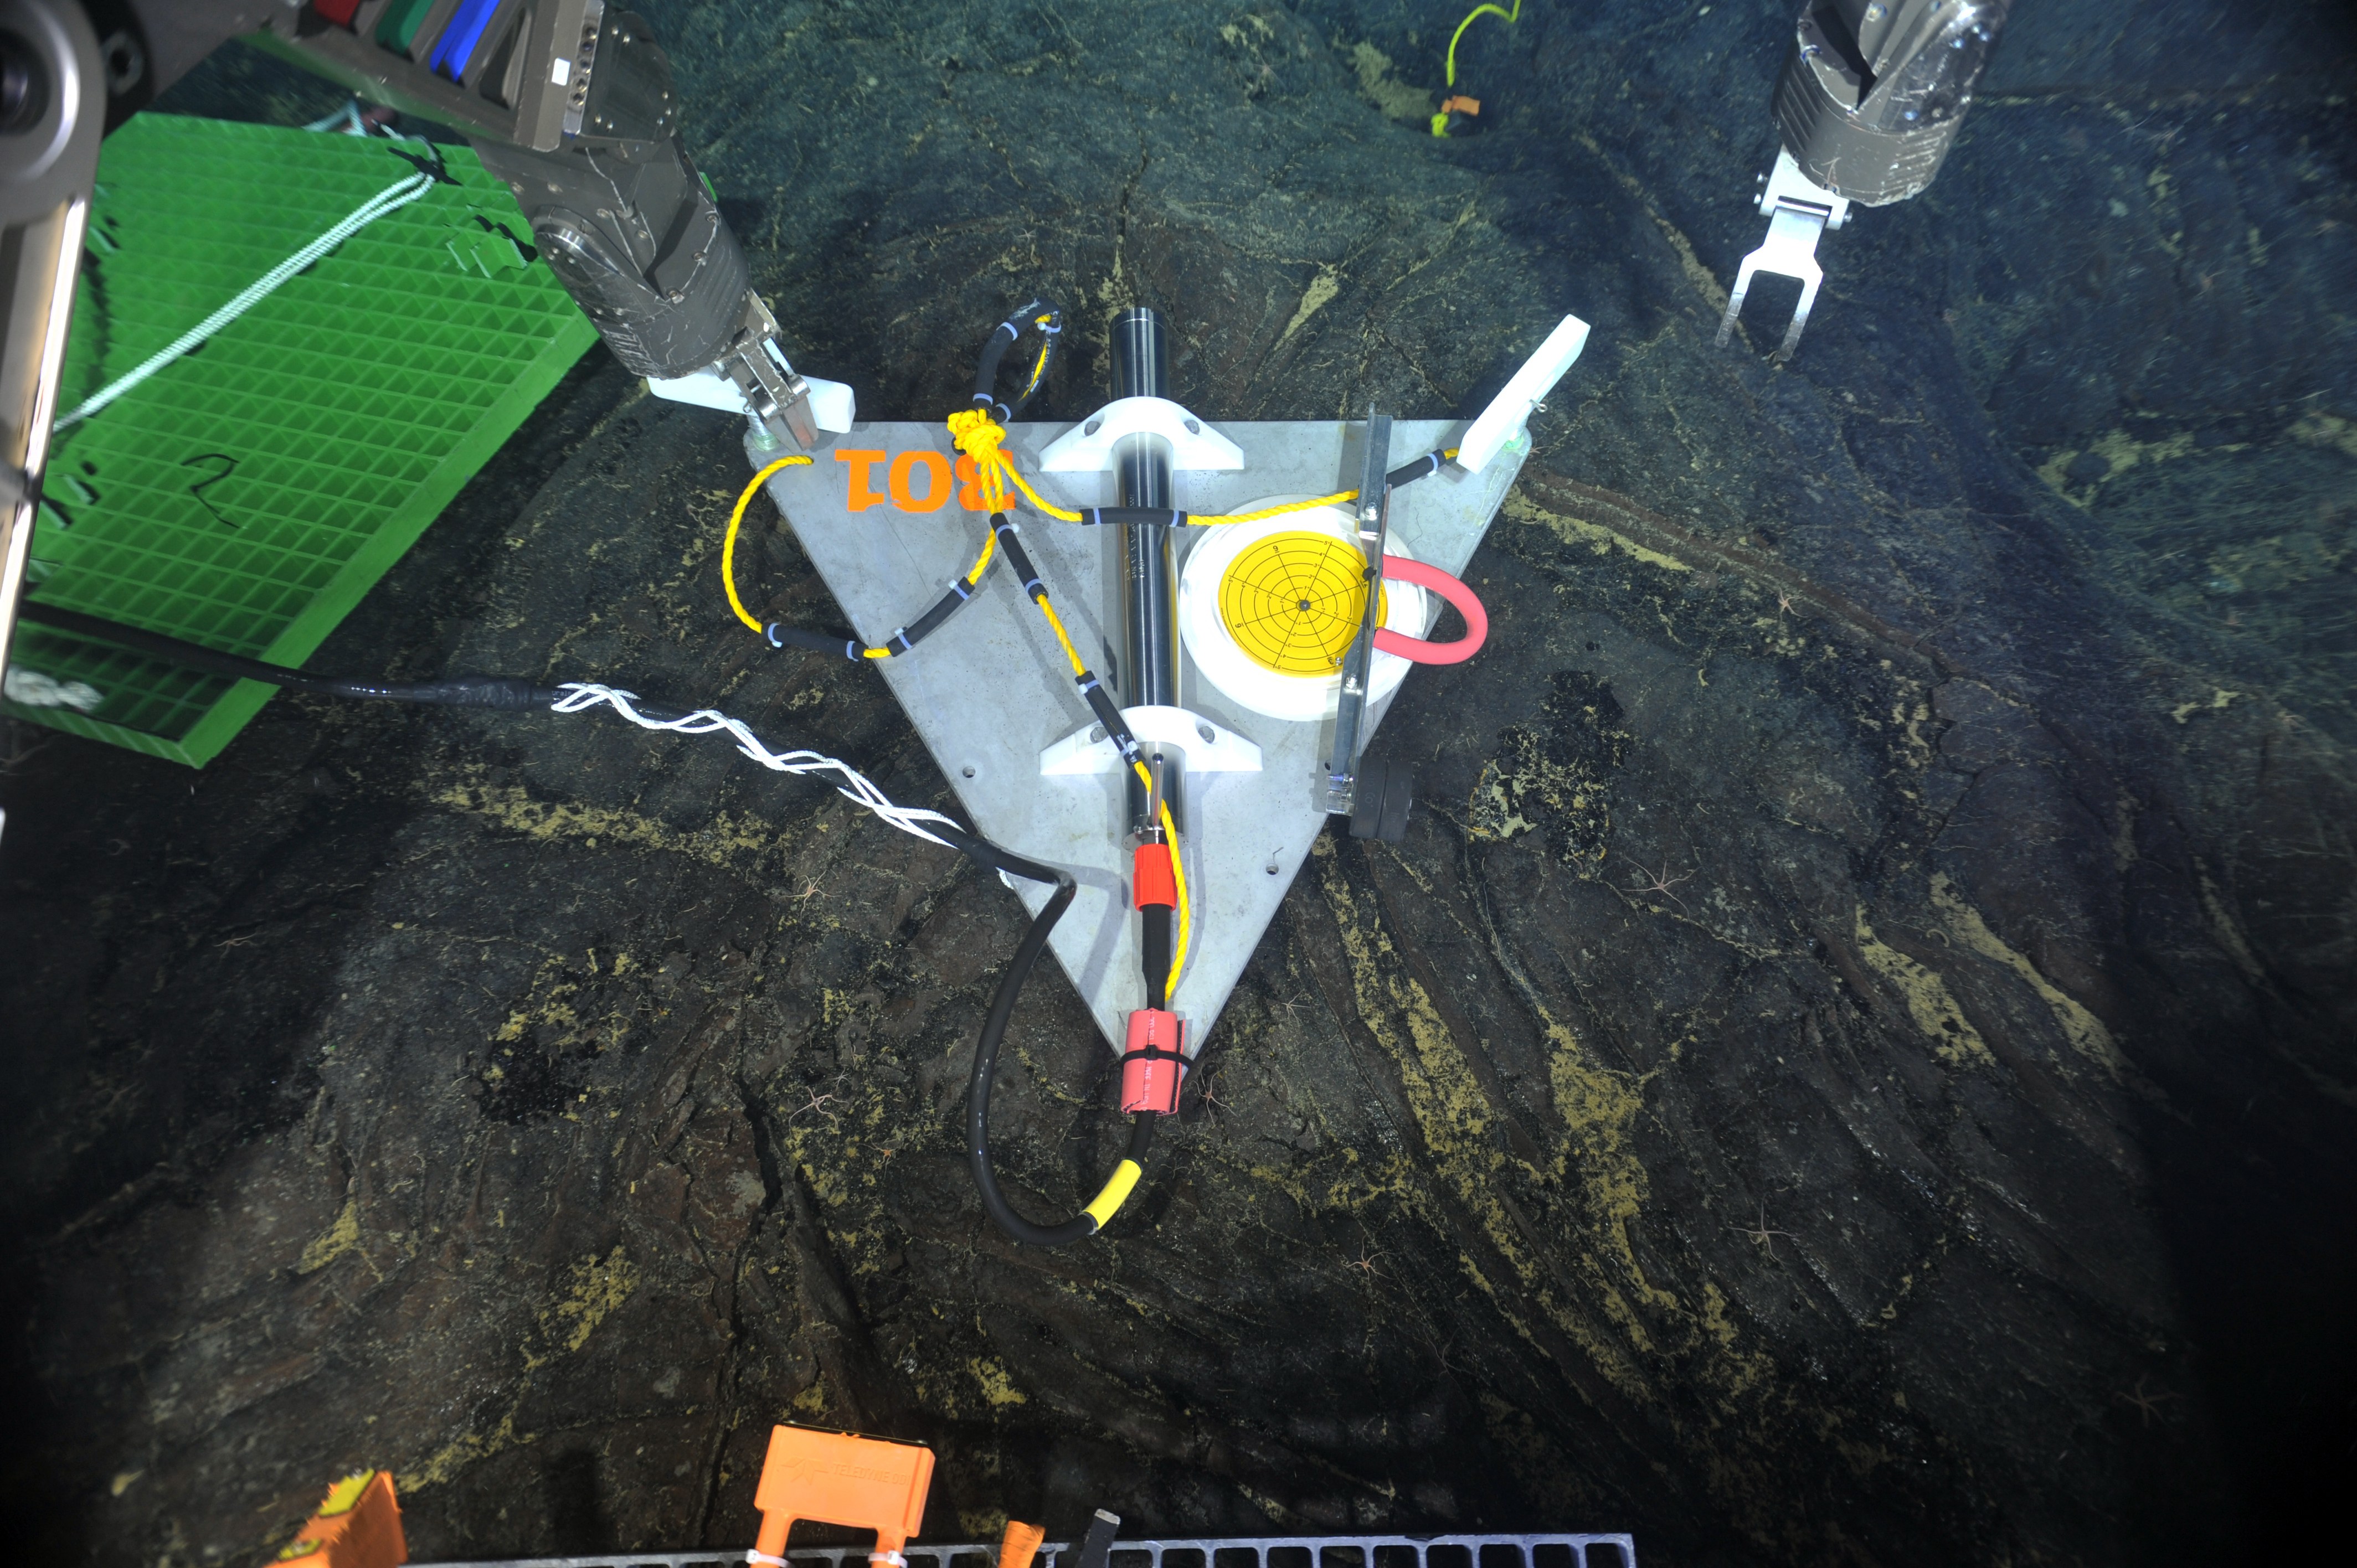 Data from short period seismometers installed at RCA’s Axial Seamount and Southern Hydrate Ridge sites are streamed live to IRIS. Credit: UW/NSF-OOI/Canadian Scientific Submersible Facility, V13.[/caption]
“RCA is a critical community resource for seismic data. Axial Seamount, for example, which erupted in 1998, April 2011, was the site of more than 8,000 earthquakes over a 24-hour period April 24, 2015 marking the start of large eruption,” explained Deb Kelley, PI of the RCA. “Being able to witness and measure seismic activity in real time is providing scientists with invaluable insights into eruption process, which along with co-registered pressure measurements is making forecasting possible of when the next eruption may occur. We are pleased to share data from this volcanically and hydrothermally active seamount so researchers the world over can use it to better understand processes happening at mid ocean ridges and advance forecasting capabilities for the first time of when a submarine eruption may occur.”
Providing Data with Regional Implications
[caption id="attachment_21047" align="alignright" width="203"]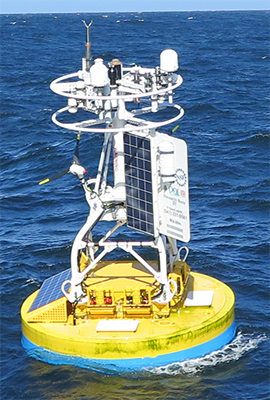 Data from Endurance Array buoy 46100 are fed into WCOFS, where they are accessible to maritime users. Credit: OSU[/caption]
OOI also provides data to regional ocean observing partners. Data from two Endurance Array buoys (46099 and 46100), for example, are fed into a four-dimensional U.S. West Coast Operational Forecast System (WCOFS), which serves the maritime user community. WCOFS generates water level, current, temperature and salinity nowcast and forecast fields four times per day. The Coastal Pioneer Array is within the future Northeastern Coast Operational Forecast System (NECOFS). Once operational, Pioneer’s observations will potentially be used for WCOFS data assimilation scenario experiments.
Coastal Endurance Array data are shared with the Northwest Association of Networked Ocean Observing Systems (NANOOS), which is part of IOOS, and the Global Ocean Acidification Observing Network (GOA-ON). Endurance data are ingested by the NANOOS Visualization System, which provides easy access to observations, forecasts, and data visualizations. Likewise, for GOA-ON, the Endurance Array provides observations useful for measuring ocean acidification.
Data from three of the Pioneer Array buoys also are part of the Mariners’ Dashboard, a new ocean information interface at the Northeastern Regional Association of Coastal Ocean Observing Systems (NERACOOS). Visitors can use the Dashboard to explore the latest conditions and forecasts from the Pioneer Inshore (44075), Central (44076), and Offshore (44077) mooring platforms, in addition to 30+ other observing platforms throughout the Northeast.
“We are working hard to distribute the OOI data widely through engagement with multiple partners, which together are helping inform science, improve weather and climate forecasts, and increase understanding of the ocean,” added Al Plueddemann, PI of the Coastal and Global Scale Nodes, which include the Pioneer, Station Papa, and Irminger Sea Arrays.
Read More
Women Who Make OOI Happen
[gallery columns="5" ids="28710,28711,28712,28713,28714"]
Keeping OOI operational and providing data around the clock requires a whole team of people working behind the scenes. Because March is Women’s History Month, we have taken the opportunity to ask a few women to share their stories about coming to and working for OOI. By featuring women who contribute to OOI’s success, we honor those women, past and present, who have made OOI possible.
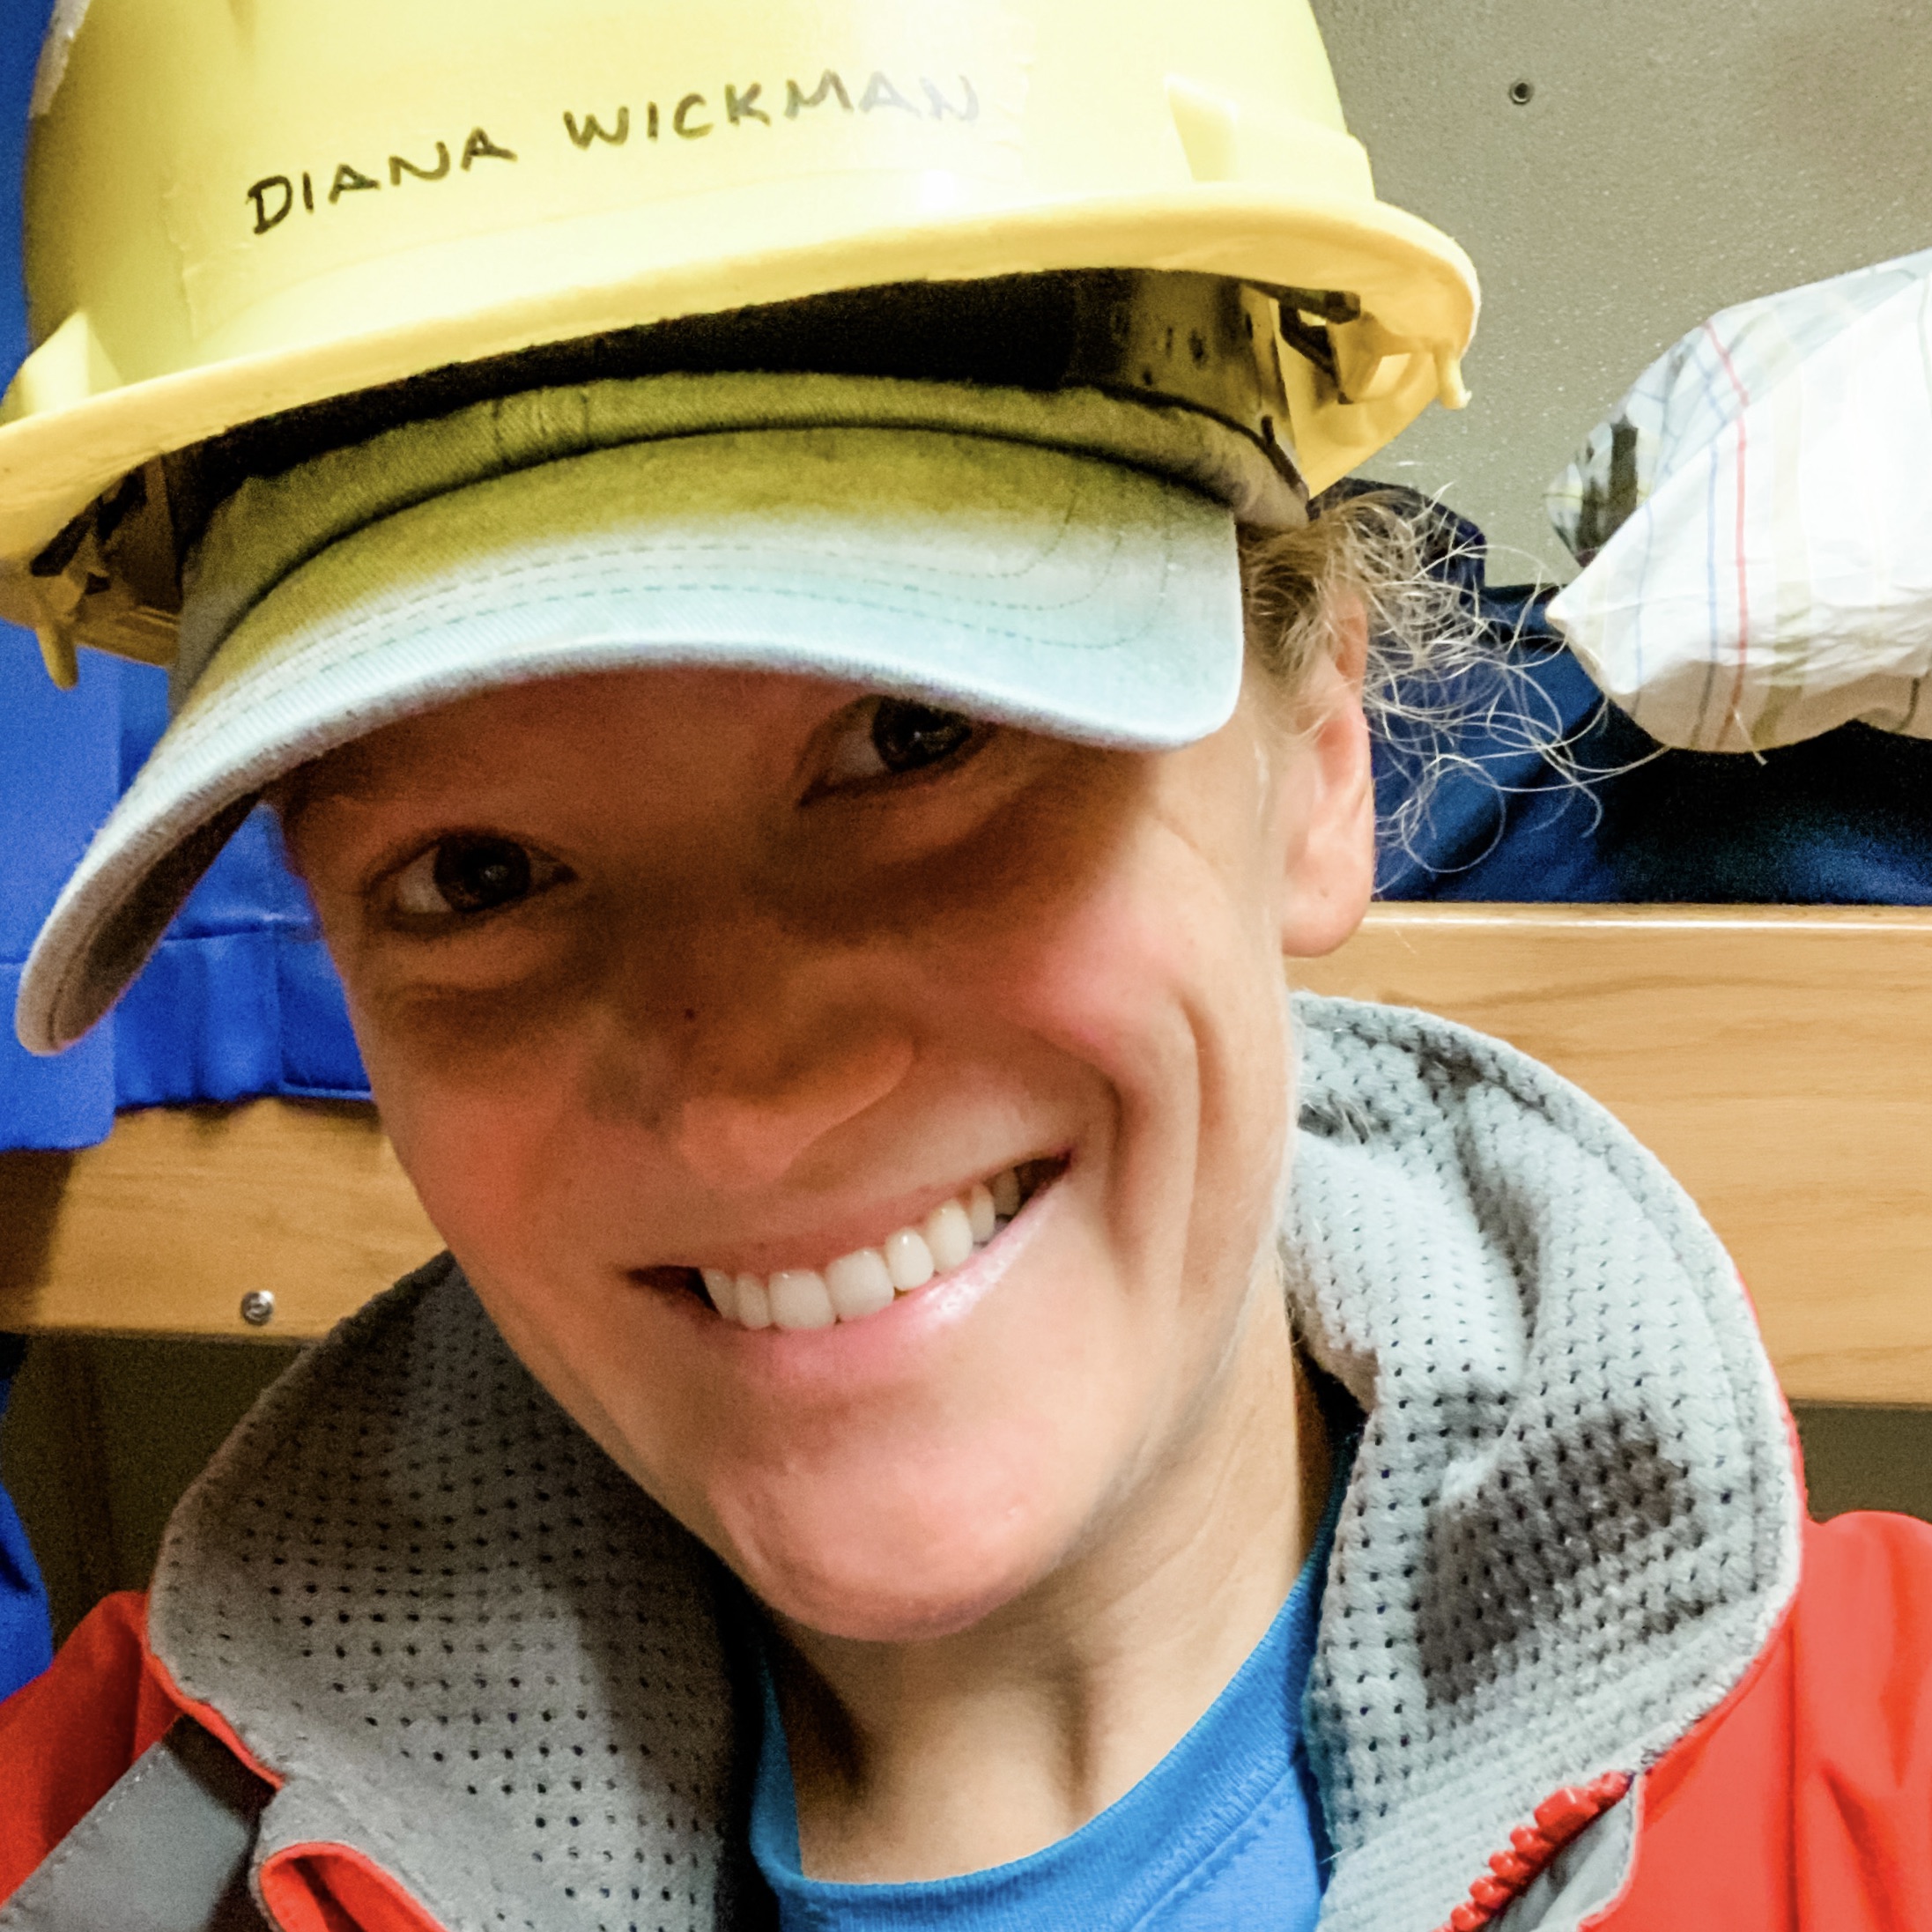
Diana Wickman
Senior Engineering Assistant II
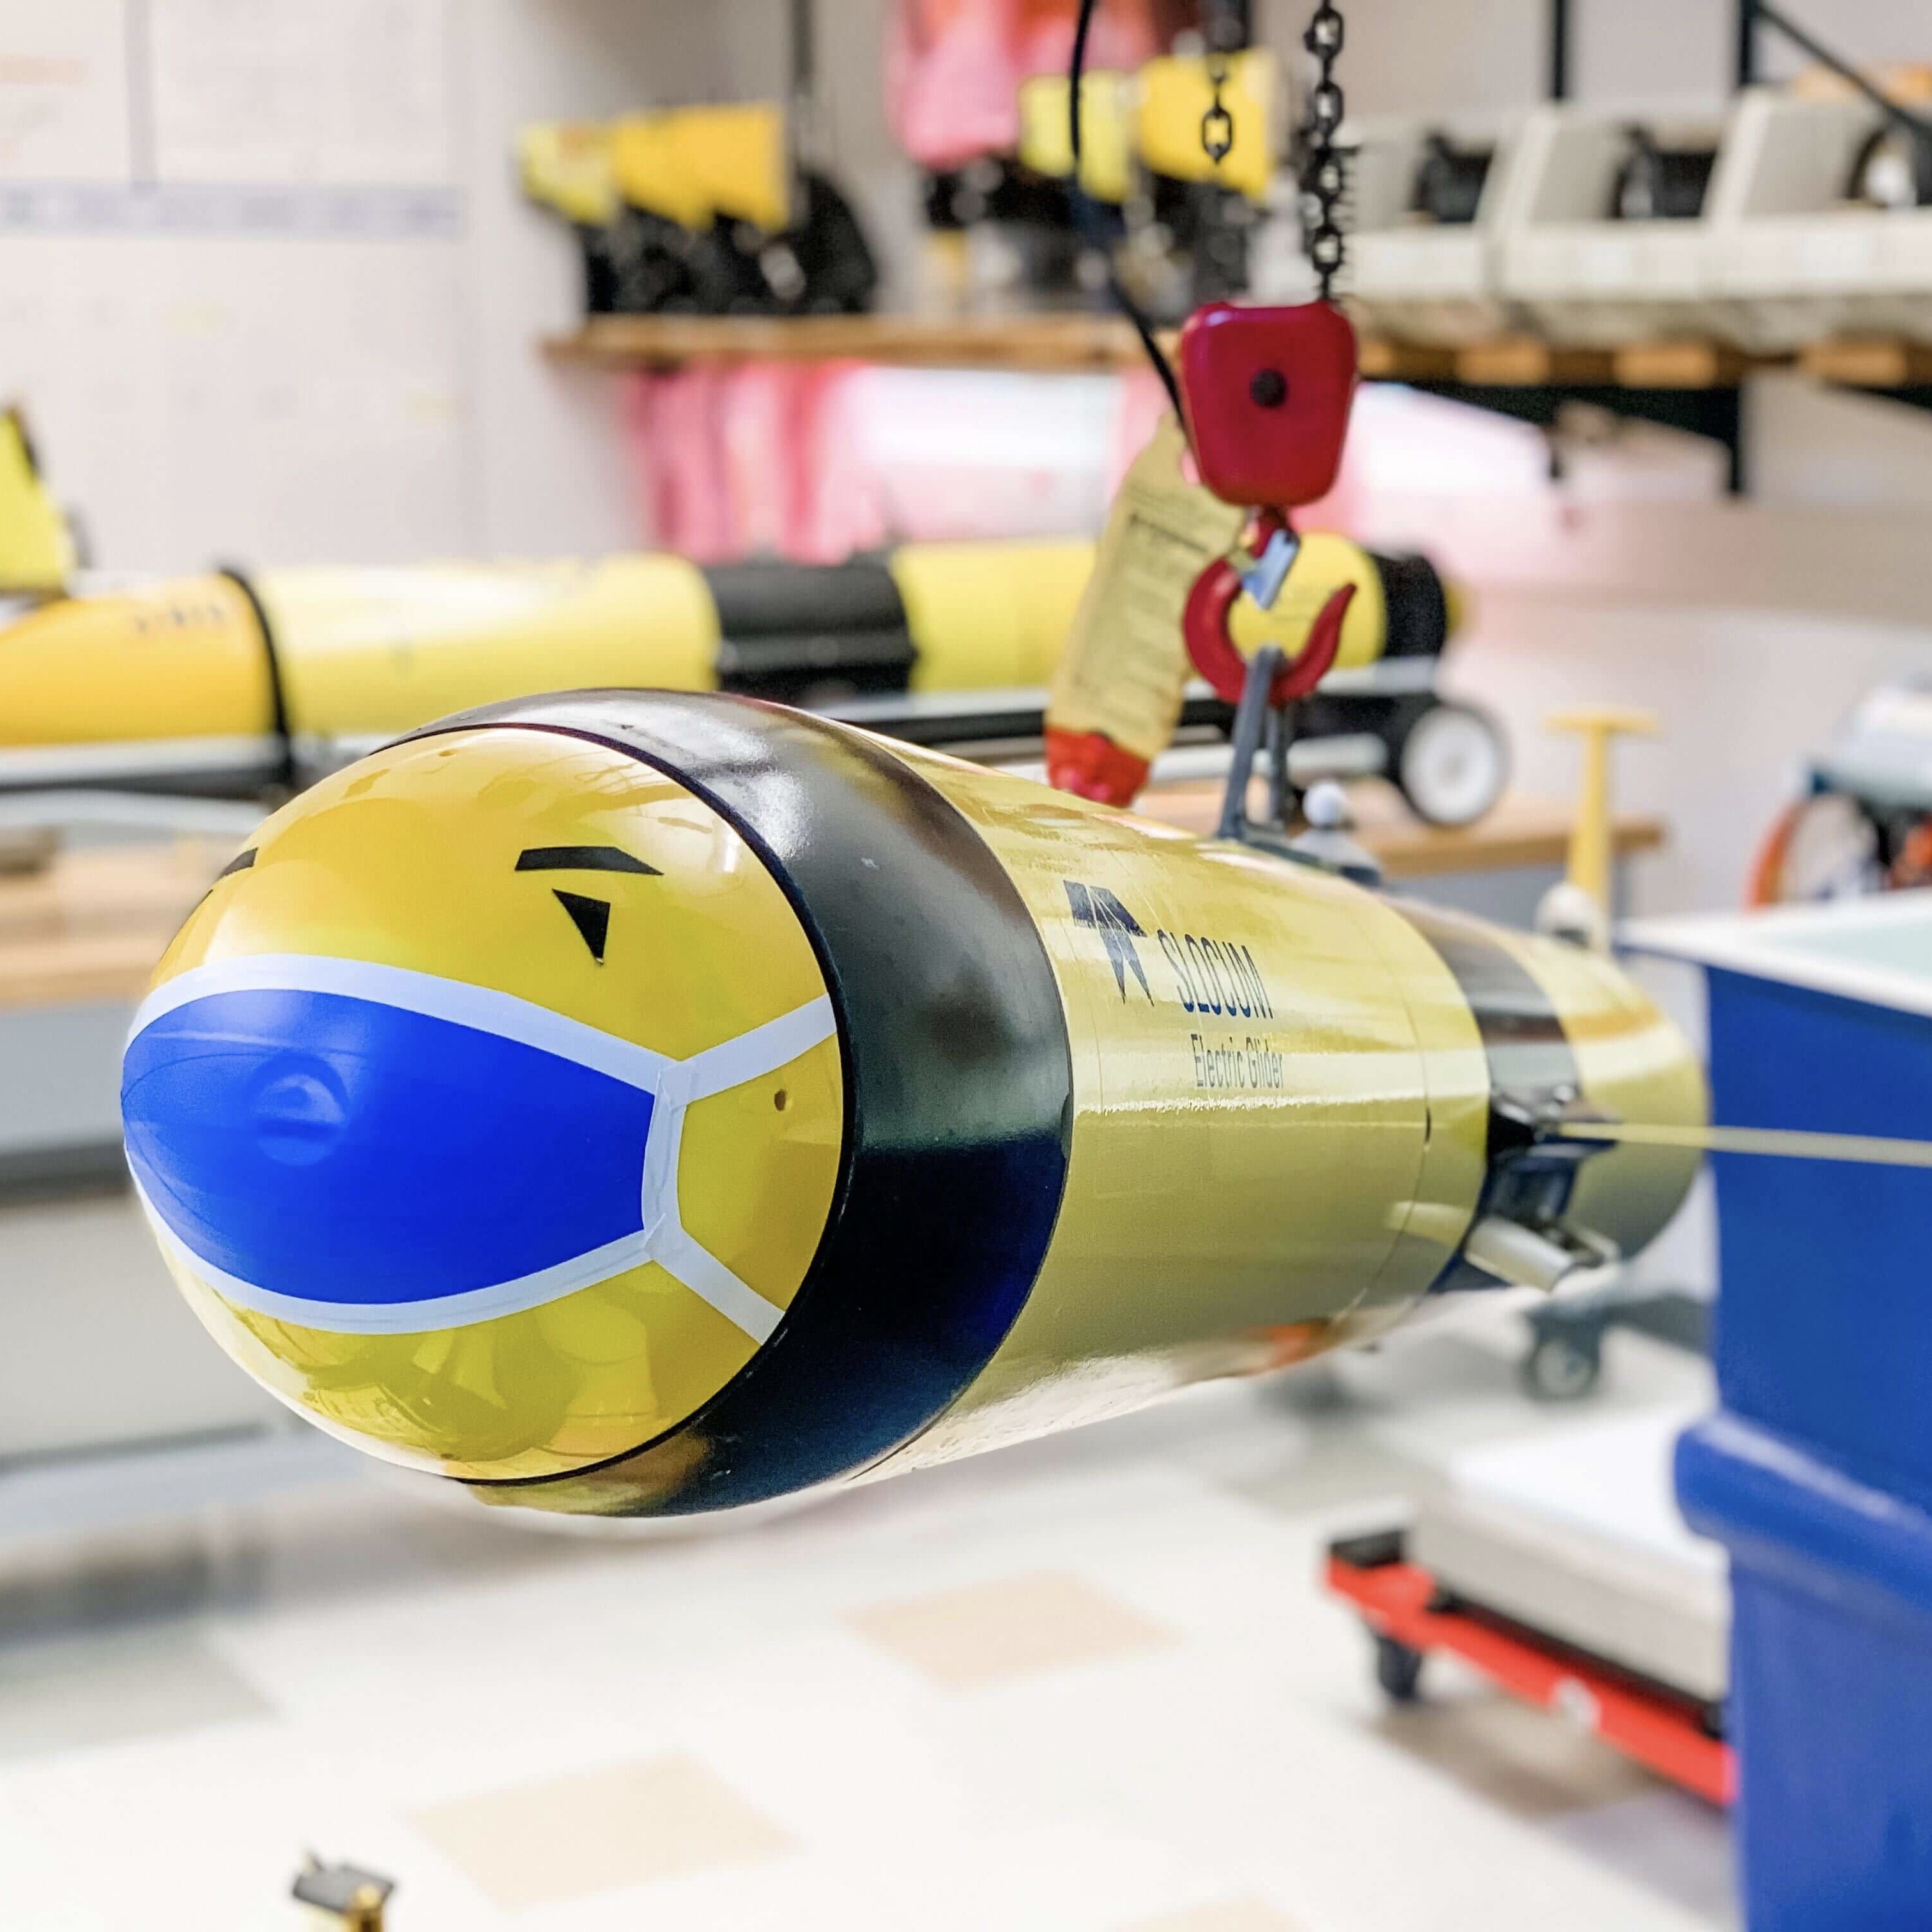
Diana’s job involves the operation, maintenance and piloting of OOI’s fleet of Slocum Gliders and two REMUS 600 AUVs. She is based at Wood Hole Oceanographic Institution.
How did you end up at OOI? When people ask me this question I often say “by accident.” I interviewed with OOI 11 years ago in early 2009 when the program was just kicking off. I had a degree in Marine Science from the University of Connecticut and was wrapping up a four-year stint in the US Air Force as a Satellite Communications Technician – an odd combo to say the least. I applied to be an electrical engineering technician but was instead offered the job of Configuration Manager. I had spent about three years doing configuration management when the program acquired its first Slocum Gliders. I remember walking past the gliders in the hallway one day, so shiny and yellow, and I was immediately hooked. I wanted to know all about these giant “tub toys.” The rest is history.
What is the most challenging part of your job? The most matter-of-fact answer to this question is: keeping the ocean OUT of the inside of the robot, but that is only half of the challenge. The ocean, especially the areas OOI operates in, is really good at breaking things. The OOI Gliders are designed to be deployed with no hands-on human interaction for up to one year at a time. When I’m in the lab working on the gliders I cannot stop at “it is working today,” I need to constantly be thinking “will this remain working for up to a year?” It has been very challenging and also rewarding to learn a system well enough to be able to predict future failures and prevent them before they arise.
What do you enjoy most about your job? I’m only part joking when I tell people the robots are like my kids. They seem to have their own unique “personalities”; some are difficult and some are easy, some seem to love to be deployed and others seem to want to sit in the lab, some are warriors and others wave the white flag at the first sign of trouble. For me, the most rewarding part of the job is seeing the gliders succeed at their missions and come home after their long deployments. Finally getting them on the bench in the lab after a year apart is kind of surreal. I love the story each glider tells of its deployment through the engineering data it gathered at sea. In laying my hands on the vehicle again I become a detective of sorts: did the Glider have a run in with a shark, a near miss with a leak, a collision with an ice berg?
Anything else you’d like to add? Having gone from the Air Force where my particular job was 96% male dominated, to ocean engineering which is also heavily male dominated (although there are many, many brilliant female engineers and engineering technicians at WHOI to look up to), I have no idea what it’s like to work in a non-male dominated career field. Being a woman in a very heavily male dominated career field has its challenges. There have been times I have been the only woman in a meeting, or on a vessel during a cruise (and often in those cases have been the one in charge). I have experienced people make assumptions about my role on the team, or my ability to do my job due to my gender. Luckily for me I’m loud, largely oblivious, and occasionally overconfident, which has helped me break through some of those gender assumptions that may have held other women back. For these traits I both thank and blame my paternal Grandmother.
Trina Litchendorf
Oceanographer IV
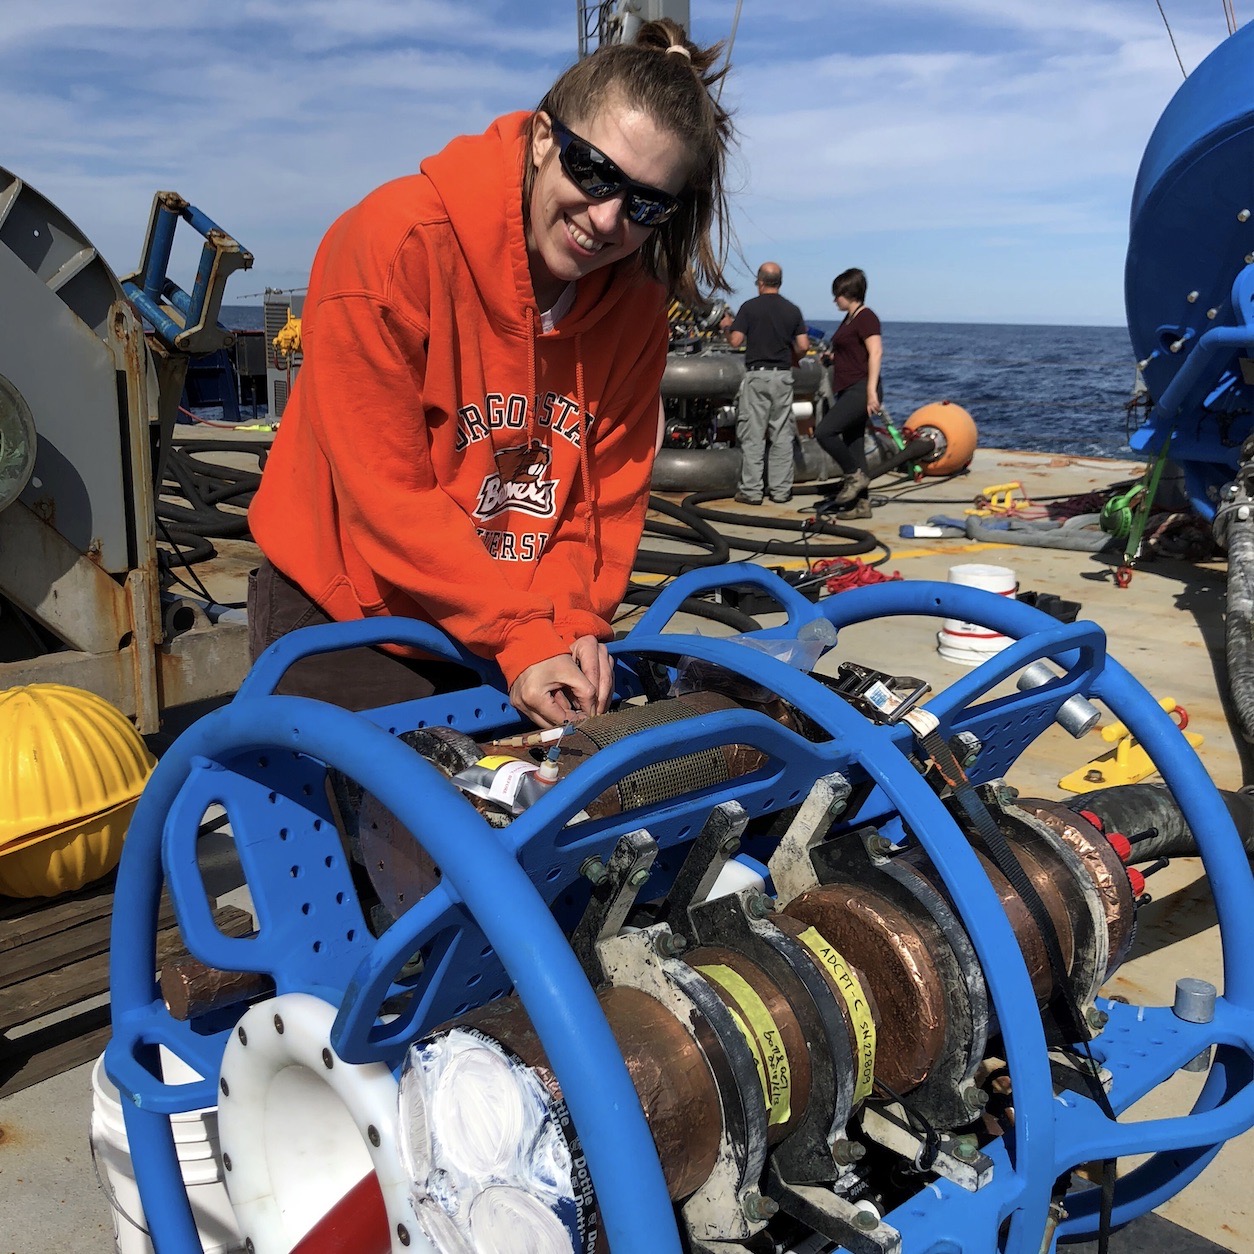
Trina is part of the OOI instrument team at the University of Washington’s Applied Physics Laboratory, where they test, maintain and deploy all the commercially-produced instrumentation on the Regional Cabled Array.
What does your job entail?
There are over two dozen different types of oceanographic instruments deployed on the Regional Cabled Array – from A to Z – ADCPs (acoustic Doppler current profilers) to zooplankton sonars, and everything in between: CO2 and pH sensors, CTDs, digital still cameras, fluorometers, hydrophones, oxygen optodes, seismometers, and velocity sensors, to name a few. Every summer I go to sea off the Oregon and Washington Coast with the Woods Hole Oceanographic Institution’s Jason remotely operated vehicle (ROV) team. The ROV team recovers all of the instrument platforms that were deployed the previous year and then deploys and connects new instrument platforms. After the cruise, in the fall, we send all of the instruments recovered during the cruise, about 135 of them, to their manufacturers so the instruments can be refurbished and calibrated. The instruments start coming back from servicing in the late fall and throughout the winter. During that time, I thoroughly test the instruments to ensure they are working perfectly before they are mounted on their deployment platforms in the spring. Then they go through a round of integration testing on the platforms before the cruise. All of this careful testing ensures high-quality data and a low failure rate once the instruments are deployed. Come summer, I am back out at sea, ready to repeat the yearly maintenance cycle.
How did you end up in this job? I started working at the Applied Physics Lab as a full-time employee in 2001. The projects I have worked on since then have involved everything from lasers, gas chromatographs, and infra-red imagers to underwater vehicles, such as Seagliders and REMUS AUVs (autonomous underwater vehicles). I also have been to sea numerous times for those projects. My familiarity with various oceanographic equipment and my sea-going experience made for a natural fit for the RCA Instrument Team, which I joined in 2015.
What is the most challenging part of your position? The cruises are the most challenging. They average about 40 days, give or take, and the work is non- stop. ROV operations happen around the clock and there is always a lot to do to get the instrument platforms ready to be deployed for the next dive. Every instrument must be powered on for one final check, the platforms must be rigged properly for the ROV, and every instrument on the platform must be photographed before we send it over the side. I also run some of the dives, sitting to the left of the ROV pilot in the control van and telling him or her the order of operations and which cables to plug in. These dives can sometimes last 12 hours or more and I usually pull a few all-nighters. During cruises, we have to come into port several times to offload all the recovered gear and load the next set of equipment, which we try to accomplish in a day or two. The cruises are like marathons and require a lot of stamina. It is also hard to be away from friends and family for so long, especially during the summer when Seattle has its best weather and I’m wearing a down jacket and wool cap because it’s so overcast and cold offshore.
What do you enjoy most about your job? The cruises. As challenging as they are, the cruises also offer the greatest rewards. I enjoy working with the undergraduate students who go to sea with us for their first oceanographic cruises; their enthusiasm reminds me of my first time at sea. There are beautiful sunrises and sunsets to see, the full moon shining on the ocean is stunning, and on moonless nights, the Milky Way is visible and the stars are spectacular. Whales and dolphins occasionally swim by, and there are incredible things to see on the seafloor with the ROV’s HD (high-definition) cameras. My favorite part of the cruise every year is when we do photo-surveys of the hydrothermal vent fields and the lava flows at Axial Caldera. Seeing the interesting biology that lives at these depths and the unique lava and vent formations never gets old!
Anything else you’d like to add? In the early 2000’s, when I was an oceanography undergrad at the University of Washington, my Geological Oceanography course was taught by Drs. Deb Kelly and John Delaney. One day, Dr. Delaney gave a presentation to our class and described a revolutionary way the oceans would be studied in the future: with regional scale ocean observatories that could send data, in real time, over the Internet to scientists around the world. This was years before the Canadian NEPTUNE array, the world’s first such underwater observatory, had been deployed. I remember thinking what a fascinating idea that was. It’s amazing now to be a part of it all, going to sea alongside Dr. Kelly, and deploying the instruments that I tested on the array. I look forward to the future and a day when Dr. Delaney’s other vision is a reality: resident AUVs stationed year-round on the Regional Cabled Array, ready to be deployed immediately after an event such as an eruption at Axial Seamount.
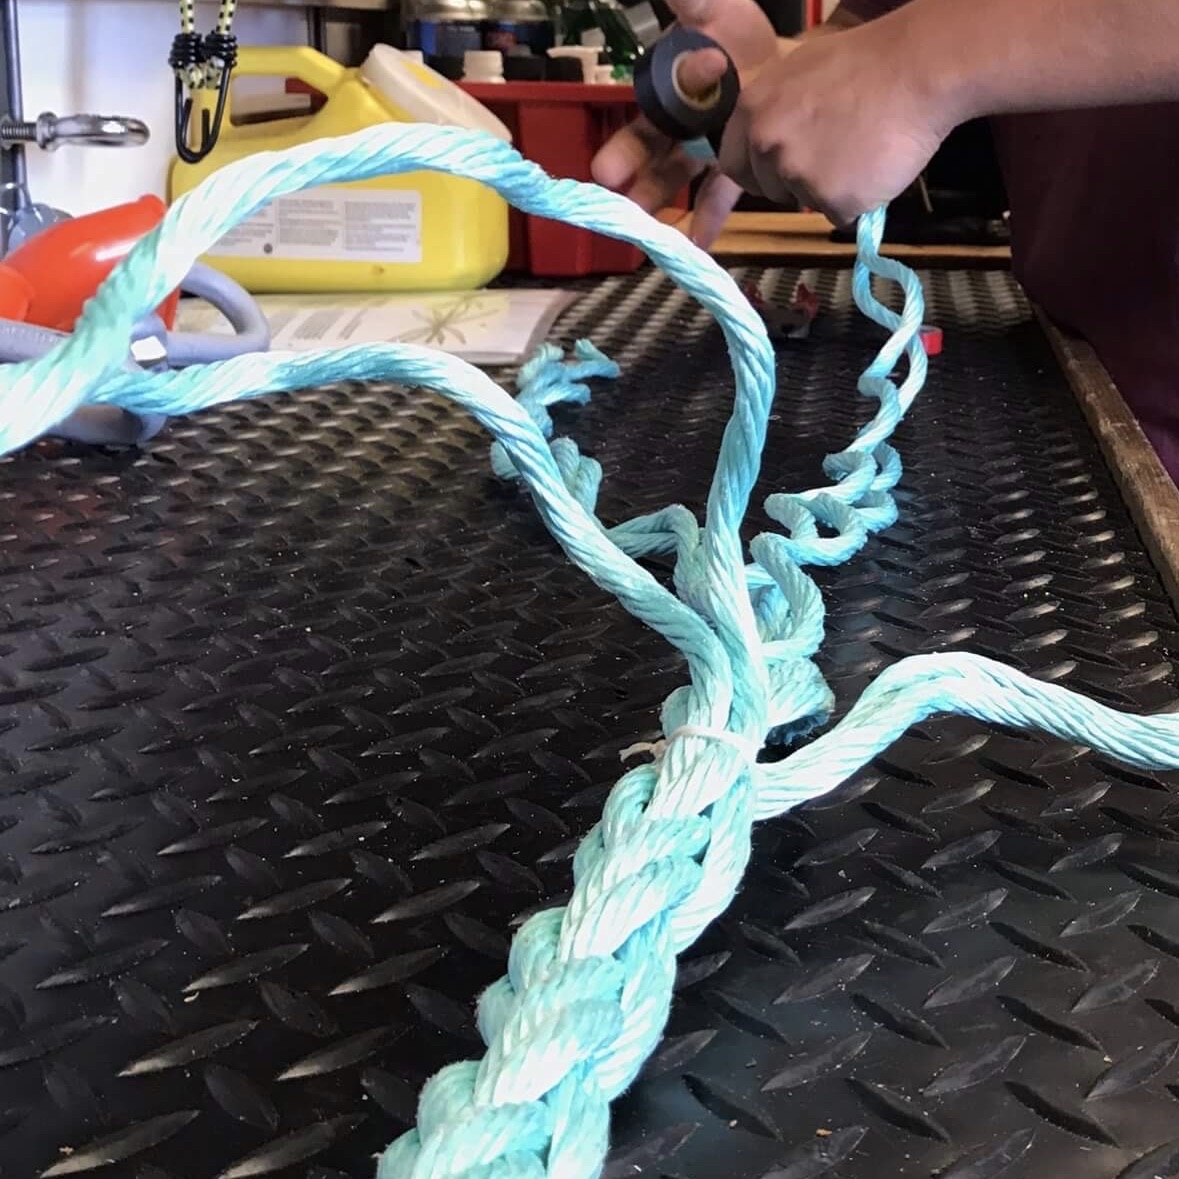
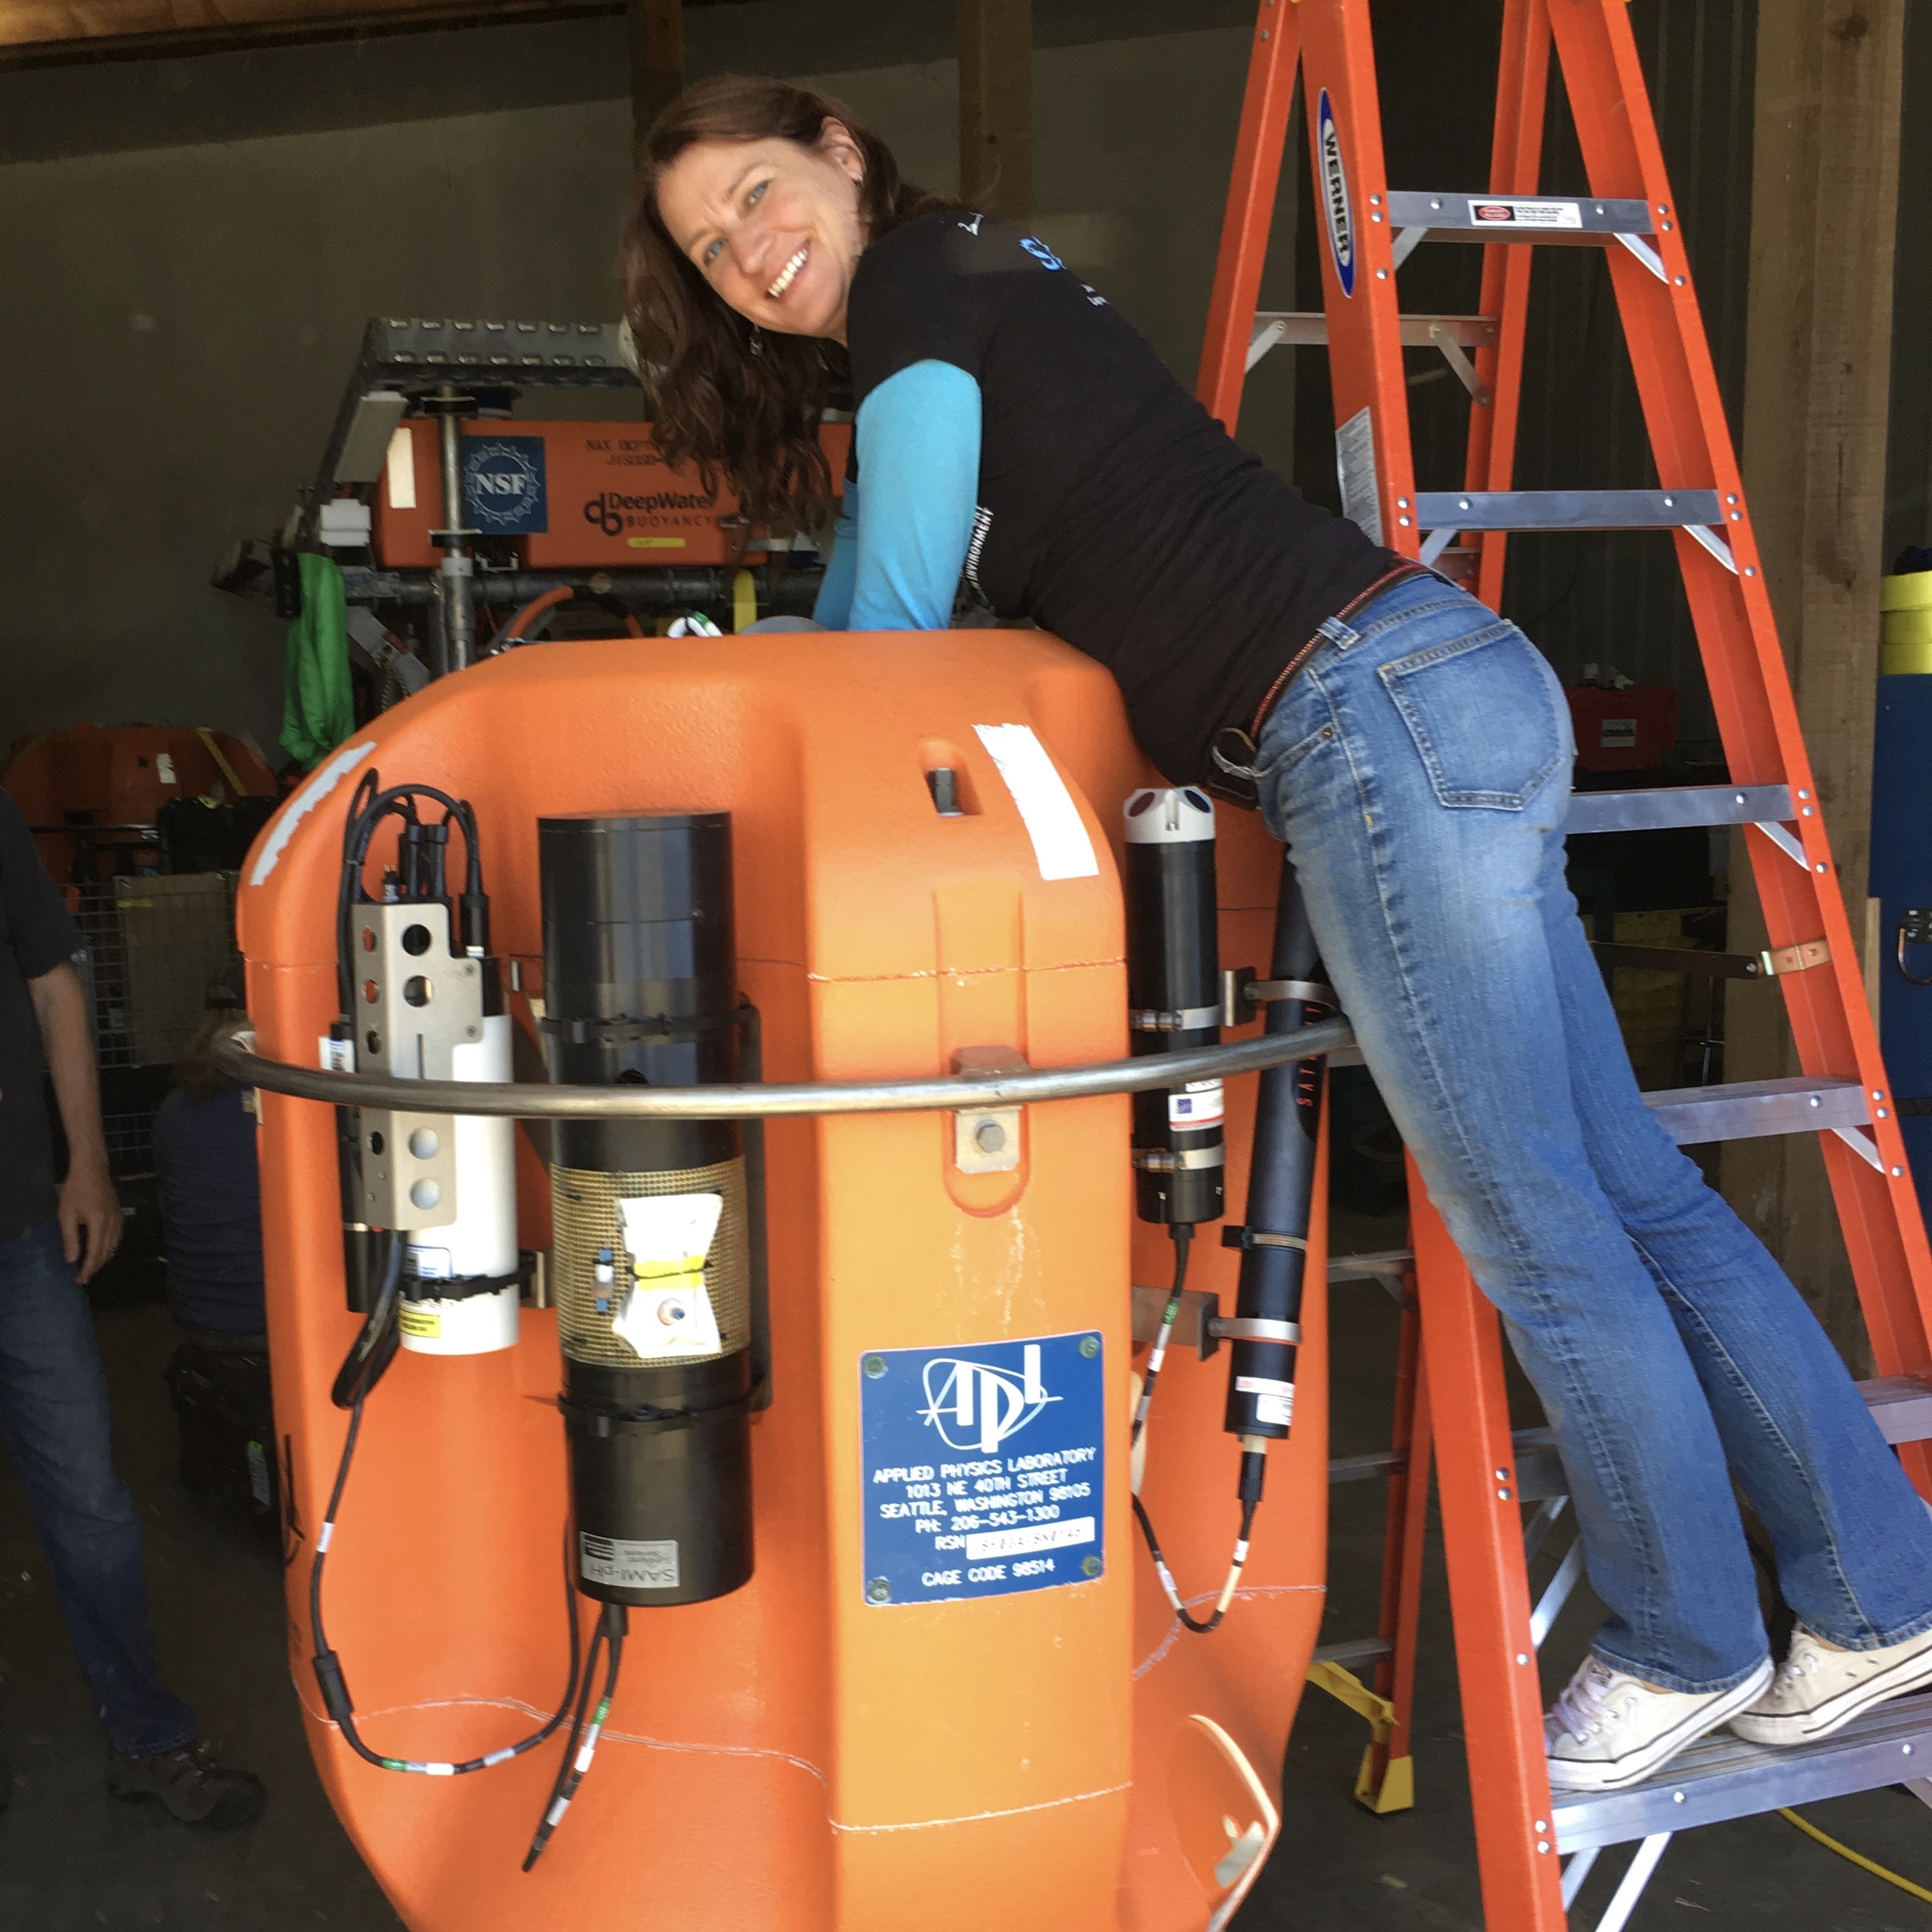
Meghan Donohue
Senior Engineering Assistant I Meghan’s job is ever-evolving. She recently changed from being a mooring tech at Wood Hole Oceanographic Institution, who served as the deck lead on multiple OOI cruises, to being a full-time OOI tech, who preps and builds the moorings for the cruises. Her new position allows her to play more with the computer side of things rather than focusing solely on mechanical issues.
How did you end up at OOI? I was a hyper-focused child who knew from a very young age that I wanted to be an oceanographer. Everything I did, from going on my first real research cruise in high school on the R/V Connecticut to studying Marine Science Physics at the University of San Diego to getting my mariners license at the Maine Maritime Academy, eventually landed me here. I worked for Scripps Institution of Oceanography as a shipboard tech, running the deck. I planned all the cruises, operated all of the oceanographic equipment and managed the computer systems on their smaller vessels. At Scripps, I met John Kemp, head of the WHOI mooring group, which eventually led to a job offer. The majority of the work I did for the WHOI mooring group was with OOI.
What is the most challenging part of your job? Balancing family and work has been my greatest challenge. Trying to rebalance that is part of the reason why I chose to change positions.
What do you enjoy most about your job? I like being able to teach the new techs and crew how to do the moorings. And I enjoy splicing—the act of weaving a piece of line together. It’s just relaxing. In addition to splicing line on the global moorings, I also splice the lines used for the Pioneer ARMS and profiler linepacks. I have made all of the ARMS linepacks with various helpers for the Pioneer cruises since the fall of 2014.
Kristin Politano
Faculty Research Assistant Kristin works with a team at Oregon State University on instrument quality control, refurbishment, and data monitoring. She also manages mooring integration for the Endurance Array, which involves building and integrating the electrical components of the moorings with the instrumentation.
How did you end up at OOI? In 2016, I joined the Oregon State University branch of PISCO (Partnership for the Interdisciplinary Studies of Coastal Oceans) as their lead mooring technician. That position allowed me to gain valuable experience with the process of building, integrating, deploying, and maintaining mooring systems. I participated in several OOI cruises while I was at PISCO and was able to meet the team of people who build and maintain the Endurance Array. When they eventually had an opening for a new position, I jumped at the chance to work with them full time.
What is the most challenging part of your job? Every new deployment brings its own set of challenges, but most of the big ones are time-related. We work closely with vendors and suppliers to stick to a timeline during builds, but it’s inevitable that delays in servicing or deliveries occur. When that happens, you have to be ready to move quickly when the parts eventually show up. Another big challenge is the lack of time to make significant improvements to the moorings. There are moments when we’re building the systems that we think “wouldn’t it be smarter it if we did it like this…” or “we could really make this more reliable if we changed that…” and often times the schedule doesn’t allow us the flexibility to make those changes.
What do you enjoy most about your job? I really enjoy problem solving, and in a lot of ways, the moorings are just like big puzzles. All the parts and pieces have to fit together perfectly for the system to function properly. Building the moorings in our shop and running them through integration and burn-in testing allows us to chase down and solve any issues that could mean the difference between a successful deployment, and a mooring that’s at sea for months with failed components. I like being able isolate and solve issues when they arise.
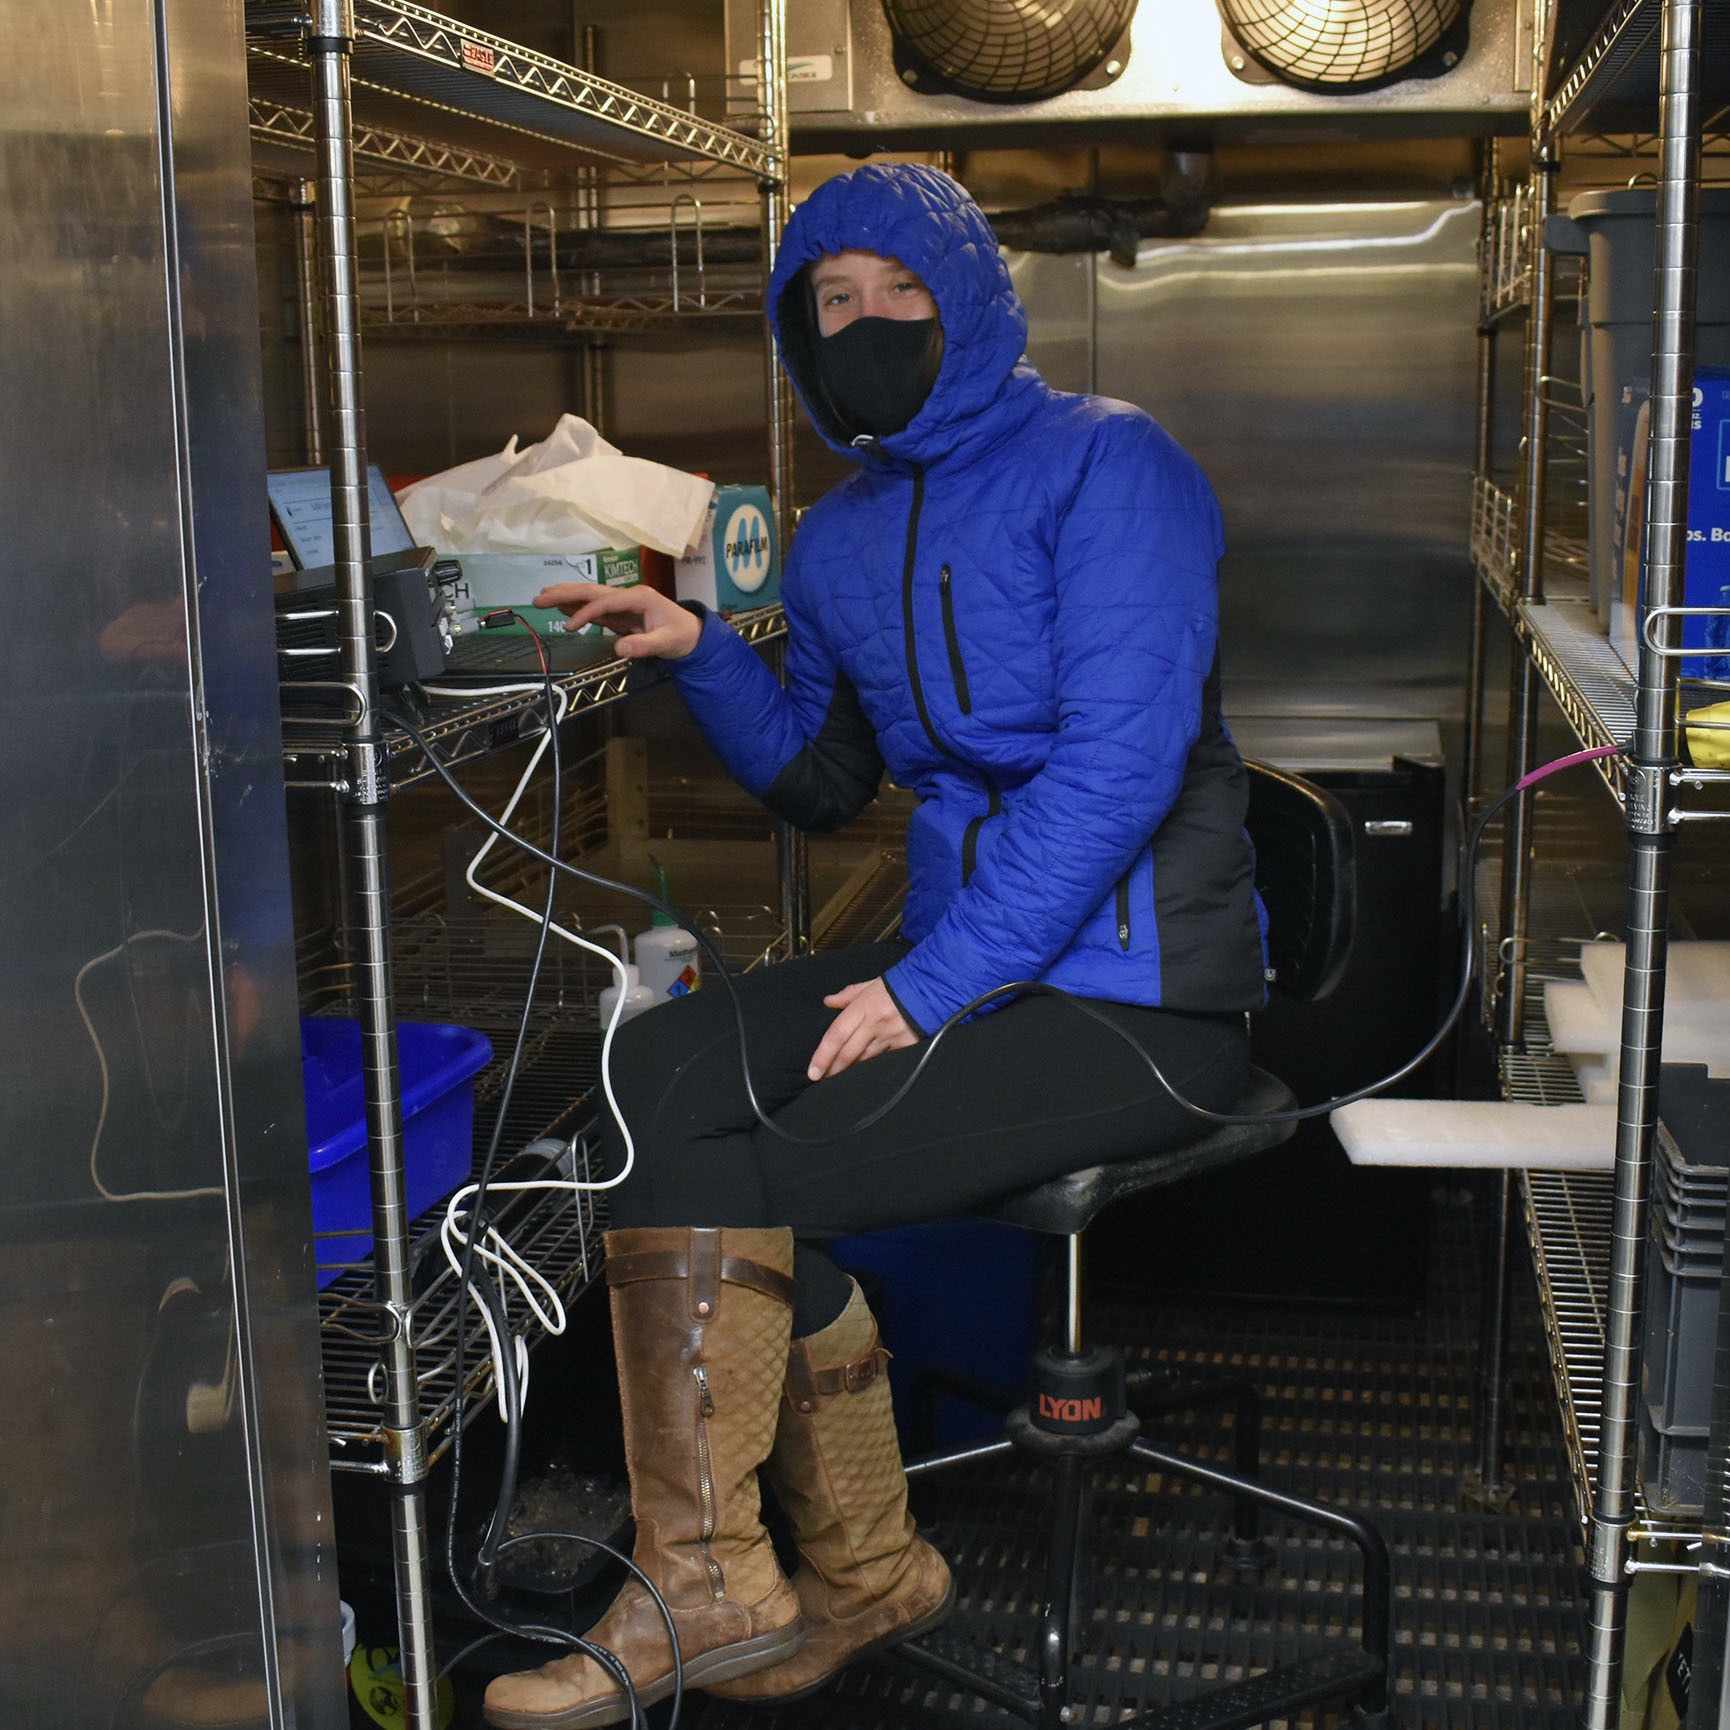
Jennifer Batryn
Engineer II
Jennifer works with (almost) all of the more than 1200 instruments that pass through the OOI program at WHOI. She is involved in the whole life cycle of the instruments, including testing, configuring, troubleshooting, deploying, data monitoring, and refurbishment.
How did you end up at OOI? I received my degree in mechanical engineering, thinking that I would end up in some sort of aeronautics or robotics field. I had never really considered a career centered around the ocean until taking part in a research program through my university. Through that program, we traveled to Malta for a month and collaborated with local archeologists, using small ROVs (remotely operated vehicles) and an AUV (autonomous underwater vehicle) to map out wells, cisterns, an underwater cave, and other features of interest around the island. Being able to work with interesting technology, travel and do field work, and collaborate with a multidisciplinary group really appealed to me, and I was sold on ocean research after that. I got involved with any ocean-based work I could afterwards, including internships at UC San Diego, National Geographic, and a summer fellowship at Woods Hole Oceanographic Institution. After college, I was thrilled to find my way back to WHOI, where I joined the OOI team.
What is the most challenging part of your position? Schedules and lack of time are the most challenging parts. Depending on how our cruise schedule line up for a particular year, it can be a surprisingly tight turnaround between recovering a set of moorings and when we need to make everything ready to deploy again. Inevitably, we have sensors and other components that come back from sea damaged. We then run into schedule conflicts with vendors and suppliers, and later discover instrument communication or sampling issues during our burn-in/testing period that need troubleshooting. The ship is going to sail regardless, which leaves very limited flexibility with timing, and sometimes there’s a real crunch period leading up to a deployment. It can also be very challenging to ensure we get good data for the entire duration of any particular deployment. The ocean is a tough environment for electronics and sensors, especially when in the water for prolonged periods. We run into problems with biofouling, physical damage from severe storms, icing, waves, or vibrations, and limitations of battery life, reagent, and other consumables.
What do you enjoy most about your job? Going to sea to support deployments and recoveries of our moorings is a nice change of pace from working in the lab and is very rewarding (if not exhausting). It’s great to see all of the work building up and burning-in of the mooring to that final end product of deployment in the ocean for six months to a year. It’s also great seeing all the data successfully come through back to shore. Long, tiring days at sea are offset by seeing all the wildlife and other natural sights in the open ocean (starry nights with no light pollution, Northern lights, stormy seas, icebergs, etc.), and traveling to different ports and experiencing different parts of the world. My dog (Teddy) was actually a Chilean street dog that I met while down in Punta Arenas preparing a mooring before a cruise. I ended up falling in love and bringing him back home with me after the cruise. Hard to beat that! It also has been really rewarding to see more people actually using OOI data, knowing that the work we are putting in is going towards the creation of a really unique, long-term data set.
Anything else you’d like to add? Going to school in such a male dominated field, it has been neat to find a core group of really smart and talented women within OOI. Everyone comes from such diverse backgrounds, and yet we all found our way to this project. Naturally the whole team is great though. It is equal parts entertaining and inspiring to work alongside everyone on our team, whether in the lab, on deck deploying a mooring, or scraping barnacles after a recovery.
Photo Credits from top
Diana Wickman headshot and glider Photo: Diana Wickman©WHOI for both
Trina Litchendorf securing oceanographic instruments on the Science Pod platform prior to a cruise. Photo: Dana Manalang
Meghan Donohue Photo: ©WHOI
Kristin Politano Photo: OSU
Jennifer Batryn in the freezer of the R/V Armstrong working on instrument calibrations at a controlled (cold) temp during the Pioneer 16 operation and maintenance cruise. Photo: Rebecca Travis©WHOI
Read MorePI Cabled Instrument Provides Real-Time Sonar Measurements of Hydrothermal Plume Emissions
Adapted and condensed by OOI from Xu et al., 2022, doi:/10.1029/2020EA001269.
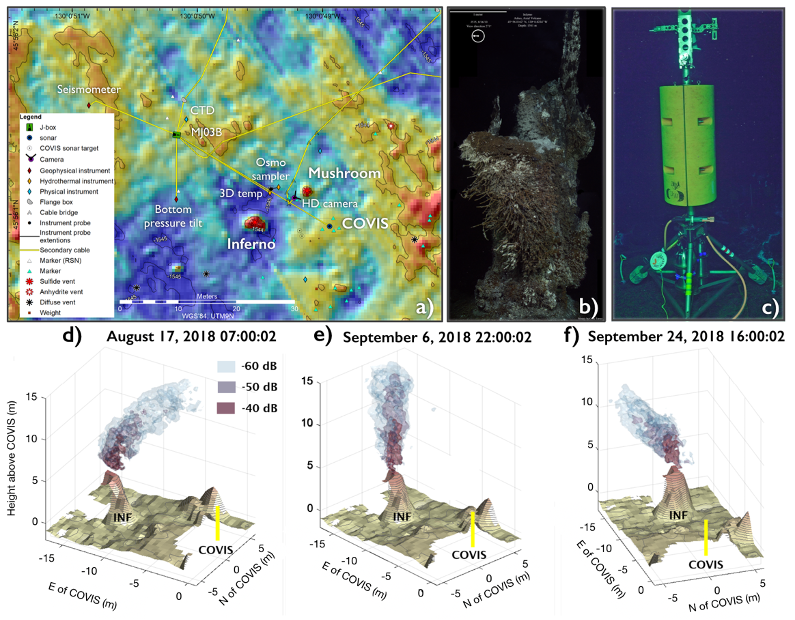
[media-caption path="https://oceanobservatories.org/wp-content/uploads/2021/02/RCA-FOR-SCIENCE-HIGHLIGHTS.png" link="#"]Figure 26. a) Location of the COVIS sonar and RCA infrastructure in the ASHES Hydrothermal Field. Also shown are locations of the active ~ 4 m tall hydrothermal edifices ‘Mushroom’ and ‘Inferno’. c) The COVIS sonar in 2019 (Credit: Rutgers/UW/NSF-OOI/WHOI). The tower is 4.2 m tall and hosts a modified Reson 7125 SeaBat multibeam sonar mounted on a tri-axial rotator. The system was built by the UW Applied Physics Laboratory. d) Selected time-series images from COVIS showing bending of the plume eastward, e) a nearly vertical plume, and f) southward bending of the plume (after Fig. 7 Xu et al., 2020).[/media-caption]The Cabled Observatory Vent Imaging Sonar (COVIS) was installed on the OOI RCA in the ASHES hydrothermal field (Fig. 26 a-c) at the summit of Axial Seamount in 2018, resulting in the first long-term, quantitative monitoring of plume emissions (Xu et al., 2020). The sonar provides 3-dimensional backscatter images of buoyant plumes above the actively venting ‘Inferno’ and ‘Mushroom’ edifices, and two-dimensional maps of diffuse flow at temporal frequencies of 15 and 2 minutes, respectively. Sonar data coupled with in-situ thermal measurements document significant changes in plume variations (Fig. 26 d-f) and modeling results indicate a heat flux of 10 MW for the Inferno plume (Xu et al., 2020). COVIS will provide key data to the community investigating the impacts of eruptions on hydrothermal flow at this highly active volcano.
[1] Xu, G., Bemis, K., Jackson, D., and Ivakin, A., (2020) Acoustic and in-situ observations of deep seafloor hydrothermal discharge: OOI Cabled Array ASHES vent field case study. Earth and Space Science. Note: This project was funded by the National Science Foundation through an award to PI Dr. K. Bemis, Rutgers University – “Collaborative Research: Heat flow mapping and quantification at ASHES hydrothermal vent field using an observatory imaging sonar (#1736702). COVIS data are available through oceanobservatories.org.
Read MoreRCA Video Shared via Oregon Coast Beach Connection
The Oregon Coast Beach Connection reports:
(Newport, Oregon) – There’s a whole lotta Sci-Fi-like action taking place off the Washington and Oregon coast, and no one really knows. Think the movie “Sphere” with a touch of “The Abyss,” throw in some X-Files and even a handful of high seas adventures, and you may have what’s going on with the Ocean Observatories Initiative (OOI), its enormous cabled array around the ocean floor, and the occasional research vessel – all studying the Axial Mount undersea volcano and the entirety of that area where the two tectonic plates meet…
Read More
Ocean Visions: New RCA Video Tells Grand Visual Story

Ocean Visions – The story of the Regional Cabled Array
Sarah Smith is not your typical undergraduate. She is a 41-year-old communications major at the University of Washington (UW) Tacoma, who used her life experience and creative talent to produce a nine-minute video Ocean Visions that tells the story of the Ocean Observatories Initiative Regional Cabled Array. The production is stunning and Smith achieved her goal of showing the human side of science. Smith served as writer, producer, and director of the production.
“I wanted to show the human side of science…that people come up with big ideas like the Regional Cabled Array. And, these big ideas that take years to come to fruition and so much money to realize, “ Smith explained. “I also wanted to convey that there are these dedicated people out there working hard at what they are passionate about, continually asking questions. While people might romanticize ocean research, it’s really hard work. It’s dangerous and conditions can be wild. I wanted viewers to see and understand all that it takes to make these big ideas happen.”
Smith’s former work as a photographer and visual artist is apparent in this nine-minute video, about the Regional Cabled Array, which provides electricity and Internet to >150 instruments measuring ocean and Earth conditions. Working initially with UW oceanography professor Cheryl Greengrove, Smith had hoped to be aboard the R/V Thomas G. Thompson this past summer with the scientific team as part of their educational VISIONS program. COVID-19 put an end to those plans. Instead, she spent hours and hours going through footage in RCA’s considerable archive of video and images of life below the surface, Interactive Oceans. (She’s hoping that the stars will align and a trip aboard the R/V Revelle will be possible next summer during RCA’s regular operations and maintenance cruise.)
“It’s hard to estimate how many hours I spent on the project. Sometimes it felt like I was living and breathing the project, but it was an incredible experience for which I am grateful,” she said. Smith did everything from schlepping the camera equipment, making sure the lighting was right, asking the questions, and spending hours in the editing room to ensure the story of the RCA was accurate and compelling.
Smith will graduate next month with a major in communications. She has an internship lined up after that with NASA where she will be working with its STEM program connecting students with the International Space Station. From there, she plans on heading to graduate school in a cinema and media studies program. “I just want to keep exploring. Video and film are such important communication tools, which are constantly evolving. I want to be part of that changing story to continue to tell stories of people who doggedly follow their curiosity as did those involved in making the RCA a reality.”
Read More